2019 VOC Emissions Monitoring in the Lost Hills Vicinity, San Joaquin Valley
←
→
Page content transcription
If your browser does not render page correctly, please read the page content below
Toxic Air Contaminant and Greenhouse Gas
Measurements near Oil and Gas Operations and
                                               2019
Proximate Communities

VOC Emissions Monitoring in
the Lost Hills Vicinity, San
Joaquin Valley

                                               Summary REPORT

                                               FluxSense Inc
                                               27 October 2020
                                                                 1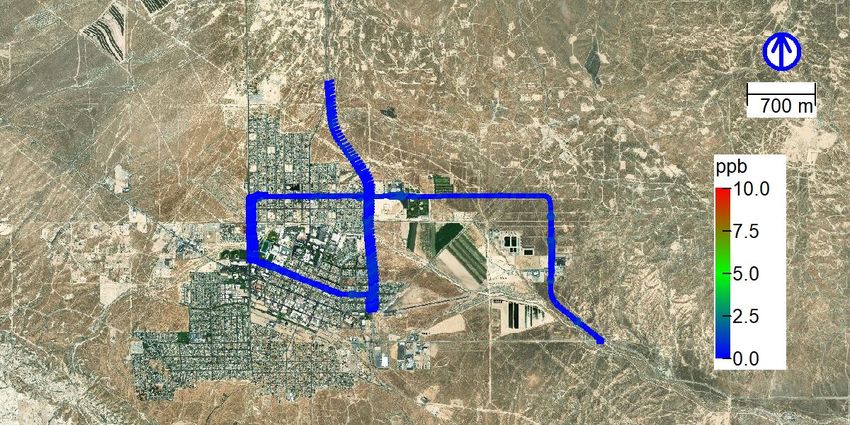
Date: 27 October 2020

Title: VOC Emissions Monitoring in the Lost Hills Vicinity, San Joaquin Valley

Authors: Johan Mellqvist1,3, Jerker Samuelsson1, Brian Offerle2, Tobias Lysvret2, Samuel
Brohede2 and Marianne Ericsson1

1
  FluxSense Inc, 113 W G Street # 757, San Diego, CA 92101
2
  FluxSense AB, Sven Hultins gata 9, SE-41288 Göteborg, Sweden
3
  Chalmers University of Technology, Hörsalsvägen 11, SE-41296, Göteborg, Sweden

CARB contract no. 18ISD023, “Toxic Air Contaminant and Greenhouse Gas
Measurements near Oil and Gas Operations and Proximate Communities”
Principal Investigator: Johan Mellqvist,
October 2019, San Joaquin Valley survey
Prepared for the California Air Resources Board
and the California Environmental Protection Agency

[Cover: FluxSense MobileLab © 2019.]

DISCLAIMER
The statements and conclusions in this Report are those of the contractor and not necessarily
those of the California Air Resources Board. The mention of commercial products, their source,
or their use in connection with material reported herein is not to be construed as actual or
implied endorsement of such products.

                                                                                            2
Executive summary
Objective
Study carried out by FluxSense Inc on behalf of California Air Resources Board (CARB). The
objective is to provide ground-based flux measurements of VOCs, methane and air toxics from
oil and gas production in the San Joaquin Valley (SJV). The study also characterizes ground
concentrations of the above-mentioned species at community scale to provide insights on
concentration levels particularly in disadvantaged communities near emission sources and to
identify emissions sources and their contributions to observed concentration levels. This project
complements community monitoring efforts by CARB staff who have measured speciated
VOCs and other toxics of concern.
Background
This is a report from the first SJV project survey primarily focused on the Lost Hills area. This
report also includes investigations of the impact of various sources on the concentration levels
in some of the communities near the oil and gas production area.
The emission fluxes (kg/h) of alkanes, ammonia, SO2, NO2 and formaldehyde were quantified
using Solar Occultation Flux (SOF) and mobile SkyDOAS (Differential Optical Absorption
Spectroscopy). MWDOAS (Mobile White Cell DOAS) and MeFTIR (Mobile extractive
Fourier Transform Infrared) techniques were used to measure ground level concentrations of
alkanes, BTEX and methane, which allowed to indirectly obtain emission fluxes when
combined with measured SOF fluxes.
SOF is a proven technique that has been developed at Chalmers University of Technology in
Sweden and further developed and applied by FluxSense in over 100 fugitive emission studies
around the world. In Europe the SOF technique is considered Best Available Technology (BAT)
for measurements of fugitive emissions of VOCs from refineries, and in Sweden it is used in
conjunction with tracer correlation and optical gas imaging to annually screen all larger
refineries and petrochemical industries. The estimated uncertainty for SOF emission
measurements is typically 30 % for total site emissions. The estimated measurement
uncertainties have been verified in several (blind and non-blind) controlled gas release studies
and in side-by-side measurements with other measurement techniques.
The instrument systems above were operated in the FluxSense mobile laboratory and the
measurement were conducted while driving outside the source area fence-lines along public
roads. For parts of the study, on site measurements were done on two distinct portions of the
Lost Hills oil field. Background columns and concentrations were subtracted by encircling the
sites, when possible, or by measuring upwind columns and concentrations, so that only
emissions from within the facilities were quantified. Wind data were obtained from a Light
Detection and Ranging (LIDAR) instrument that measured the wind profile between 10 to 300
m altitude and from a 10 m mast mounted anemometer. From the combination of the measured
column and concentration values, respectively, the height of the plume could be derived to first
order.

                                                                                               3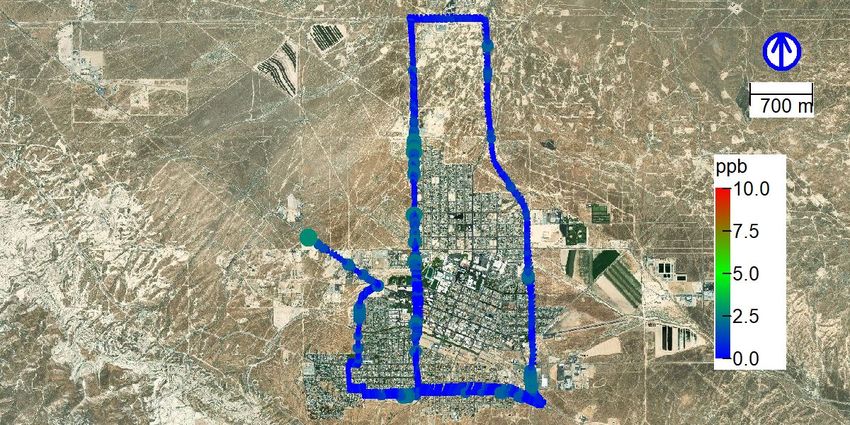
Emissions measurements and community monitoring
Measurements of emissions were made over the course of 3 weeks in October 2019 with a little
more than two weeks spent on Lost Hills and four days for other sources in the SJV. More than
half the duration in Lost Hills was devoted to near-field measurements of emissions and
identifying large sources or leaks within the fields of two of the major oil producers in the
region.

Lost Hills and Other Oil Field Emissions
Total large-scale fugitive NMVOC emissions from Lost Hills oil and gas production area
averaged 522 kg/h over the campaign time frame. This is lower than was previously measured
in an earlier study conducted by FluxSense (780 +/- 310 kg/h, May 2019) but the difference
was not statistically significant. Additionally, activity related factors vary over time. Roughly
50 % of the emissions originate from the area north of Highway 46 with the remainder coming
from the southern portion. Most of the emissions in the Lost Hills area are diffuse and do not
originate from a few major sources although activity related sources (drilling, work-over,
vacuum trucks) were evident.

Measurements were also made of Cymric and McKittrick fields with combined NMVOC
emissions averaging over 1300 kg/h. This is very similar to an earlier study (May 2019). There
are at least 5 large sources of the emissions within these fields that account for over half of the
emissions.

Table S1 lists the emissions measurement results for the oil and gas fields included in the study.

Table S1 Results of the emission measurements from SOF and indirectly measured emissions (IME) from MeFTIR
concentration. Days are the number of individual SOF measurement days, N is the number of emission or
concentration measurements; Mean and SD are the mean and standard deviation of the SOF emission
measurements, respectively; 1Q, Med, 3Q are the 25th, 50th (Median) and 75th percentile of the concentration ratio.
The IME for methane is calculated from the SOF Alkane emissions and the median methane to alkane ratio.

 Area                                                                   MEFTIR       MEFTIR        MEFTIR
 (fields and                   SOF Alkane     SOF Alkane                                                        IME
                                                                        CH4 /        CH4 /         CH4 /
 associated    Days    NSOF    Emissions      Emissions      NMEFTIR                                            CH4
                                                                        Alkane       Alkane        Alkane
 facilities)                   Mean (kg/h)    SD (kg/h)                                                         (kg/h)
                                                                        1Q           Med           3Q
 Lost Hills        2       5            522             69          1            -          0.47            -     244
 Lost Hills
               3      14                210             85          6       0.24            0.29      0.35         61
 N of 46
 Lost Hills S
               3        3               214            180          6       0.44            0.76      1.47        163
 of 46
 Cymric &
               3      10               1380            373        10        1.39            1.77      2.14       2430
 McKittrick
 Cymric &
 McKittrick    2        7              2970            873   N.M.       N.M.         N.M.          N.M.         N.M.
 Belridge
N.M.=Not measurable as an entity

                                                                                                                       4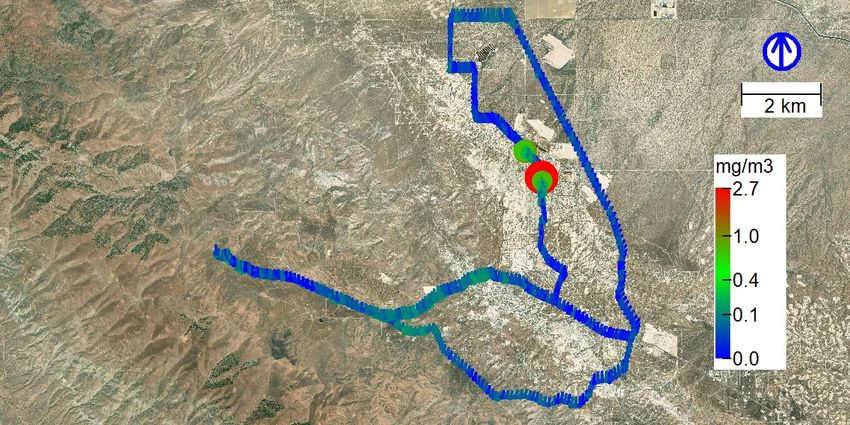
Two of the oil producers in the Lost Hills field agreed to allow daytime access and provided
support for emissions measurements and concentration measurements. Access to Operator A’s
operations were granted for a week and measurements were comprehensive including
individual wellhead measurements, investigation of hot spots and thus determination of
possible leaks. Several individual wellheads including pumpjack and other associated
measurements using tracer gas were also done. Access to Operator B’s operations in Lost Hills
were more restricted but still allowed for complete geographical coverage of the fields where
large leaks could be detected. However optimal leak search and detection and individual well
measurements could not be made.

Many of the larger identified point sources for instantaneous emissions detected within the
surveyed operators’ fields were associated with temporary but continually ongoing activities:
workover rigs, drilling rigs and vacuum truck emissions. To the extent that measurements were
carried out in the fields only during daytime, this would bias emissions if they are not 24-hour
activities. However, these activities represent only a fraction of total field emissions so any bias
should be relatively small.

The other larger point sources were separators or gathering lines from areas of the field where
we did not have operator access. Gathering sites, separators and de-sulfurization units in the
fields had detectable emissions but measurements were not always possible due to access
limitations. The most apparent of these, and largest point sources on the fields, were on operator
sites to which we did not have access.

None of the individual wellheads measured in the tracer measurements had greater than 1 kg/h
emissions of NMVOCs. With more than 5000 active wells within the Lost Hills fields, wells
are still expected to be the major contributor to NMVOC and methane emissions. The largest
methane leak detected in the Operator A field was from a buried pipeline belonging to a
residential gas operator and not Operator A.

While activity related emissions were readily visible and identifiable due to close observations,
permanent installations should still be the largest point emission sources on a long term basis.
Emissions from Operator A’s main facility varied diurnally and throughout the campaign and
accounted for 10% of the Lost Hills NMVOC emissions. Operator B facilities’ emissions were
measured over a much more limited time and included interference from vacuum truck
operations. No near-field measurements were made of the other operators’ facilities to which
we had no access.

BTEX concentrations from fenceline measurements were below detection limits except for a
few specific sources. BTEX emissions measured at the water treatment of an O&G production
facility were measurable at the fenceline and at a distance downwind comparable with a nearby
community. Benzene concentrations in these plumes were less than 3 ppb except for
immediately adjacent to the facility.

                                                                                                  5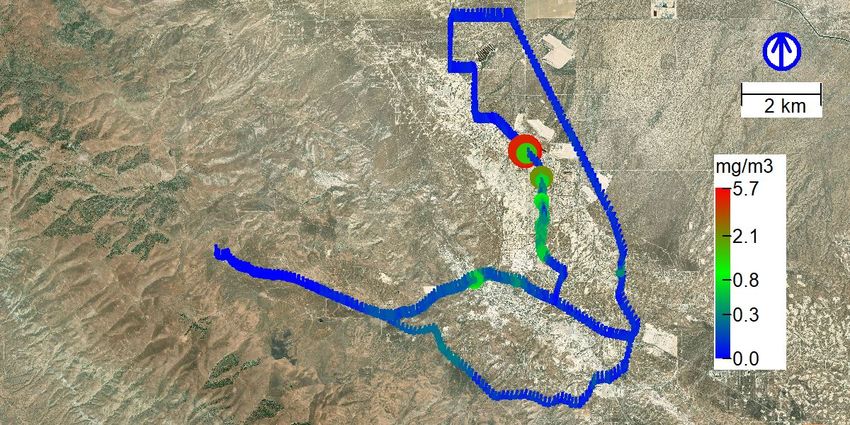
Community monitoring in Lost Hills and elsewhere
In addition to daily field monitoring, measurements with the mobile laboratory were carried out
during 2 mornings/evenings in the Lost Hills community. Targeted measured species included
benzene, BTEX, various alkanes, and methane. A few ephemeral residential BTEX sources
were observed. Otherwise BTEX levels were not significantly different from the large-scale
observations in the surroundings. The focus on the community also allowed the detection and
plume tracing to the source of a commercial gas pipeline leak at 800 Aqueduct Road, Lost Hills.
Although the leak had been noted earlier in the measurement campaign, it was then assumed
that the plume originated from the oil field. It was first during the community monitoring time
possible to trace back the plume and the source location became apparent.

                                                                                             6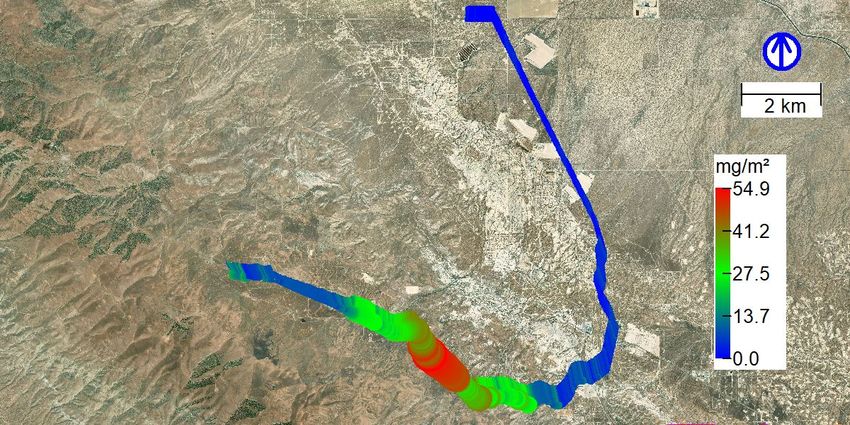
Acronyms, Units and Definitions

Acronyms used in this report

BPD           Barrels per day
BTEX          Sum of Benzene, Toluene, Ethyl Benzene and Xylene
CARB          California Air Resources Board
DOAS          Differential Optical Absorption Spectroscopy
CalGEM        California Geologic Energy Management Division
EF            Emission factor
FTIR          Fourier Transform InfraRed
IME           Indirectly Measured Emission, combining direct emission with concentration ratios
LIDAR         Light Detection and Ranging
MWDOAS        Mobile White cell DOAS
MeFTIR        Mobile extractive FTIR
NMVOC         Non-methane volatile organic compound
SkyDOAS       Scattered Skylight DOAS
SOF           Solar Occultation Flux
VOC           Volatile organic compound, used interchangeably for non-methane VOC

Units
Air temperature              degrees C
Atmospheric pressure         Mbar
Relative humidity            %
Wind direction               degrees North
Wind speed                   m/s
Column                       mg/m2
Concentration                mg/m3
Flux                         kg/h

Unit Conversions

1 lbs = 0.4536 kg
1 kg/h = 52.9 lbs/day
1 bbl = 159 l
1 bbl/day = 5.783 kg/h (crude oil)
1 (short) ton = 907.2 kg
1 kton/year = 104 kg/h
1 klbs/year=0.052 kg/h

Definitions

Alkane or Alkanes are considered to be all non-methane alkane species.

                                                                                                  7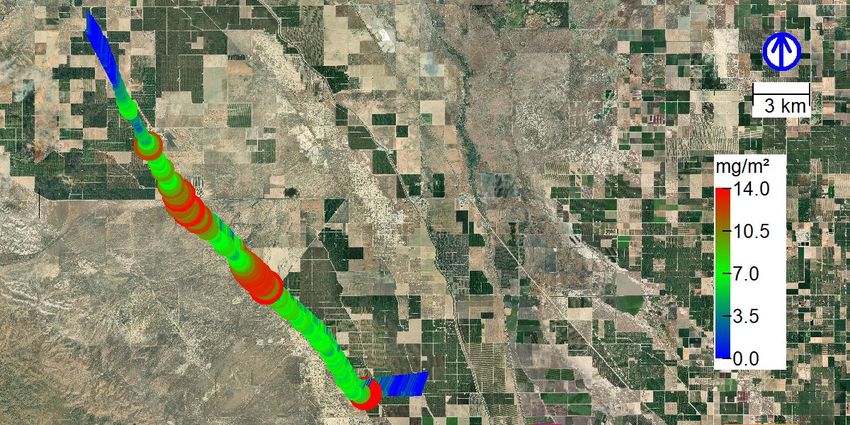
Table of Contents
EXECUTIVE SUMMARY ................................................................................................................................... 3
ACRONYMS, UNITS AND DEFINITIONS ...................................................................................................... 7
LIST OF FIGURES .............................................................................................................................................. 9
LIST OF TABLES .............................................................................................................................................. 11
1       OBJECTIVE AND INTRODUCTION .................................................................................................... 13
2       SURVEY SETUP & COMPLEMENTARY MEASUREMENTS ......................................................... 13
    2.1     SITES – LOST HILLS AND OTHER OIL AND GAS FIELDS ............................................................................ 15
    2.2     PLUME HEIGHT ........................................................................................................................................ 17
3       RESULTS ................................................................................................................................................... 19
       3.1.1 Lost Hills ....................................................................................................................................... 20
       3.1.2 Cymric and McKittrick .................................................................................................................. 29
       3.1.3 Belridge ......................................................................................................................................... 32
       3.1.4 Oil and Gas Produced Water Ponds ............................................................................................. 33
    3.2 COMMUNITY MONITORING ...................................................................................................................... 34
       3.2.1 Lost Hills ....................................................................................................................................... 34
       3.2.2 McKittrick, Derby Acres and Taft ................................................................................................. 38
    3.3 PLUME TRANSPORT AND DISPERSION ....................................................................................................... 40
4       ACKNOWLEDGEMENTS ...................................................................................................................... 42
5       REFERENCES .......................................................................................................................................... 42

                                                                                                                                                                   8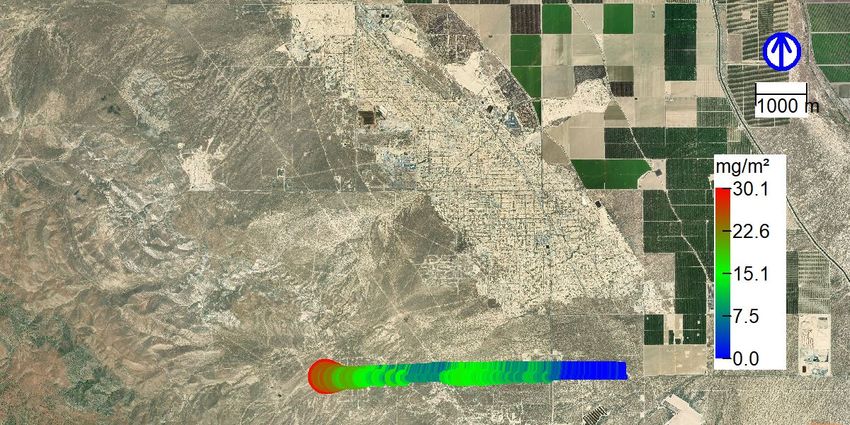
List of Figures
Figure 1. Lost Hills oil field and surroundings. Approximate boundary for total emissions area
     shown in blue. Areas within the fields that were surveyed completely are shown in red
     with lines indicating section borders and section numbers. Cyan section indicated area run
     by an operator outside the current study and was only surveyed from the fenceline. Point
     markers indicate methane sources within the study area measured by The Jet Propulsion
     Laboratory (JPL, URL https://methane.jpl.nasa.gov/, 13 Dec 2019). Inset: JPL methane
     sources and actual field boundary from https://methane.jpl.nasa.gov/ ............................ 14
Figure 2. SOF measurement box in blue defining the measurement area for the Lost Hills
     region. The figure also shows new (orange) and active wells (green) (CalGEM, 2019). 15
Figure 3. SOF measurement box in blue defining the measurement area for the Belridge North
     and South area. The figure also shows new (orange) and active wells (green) (CalGEM,
     2019). Note that wells in Belridge South east of Highway 33 (highlight in red) have been
     included occasionally. ...................................................................................................... 16
Figure 4. SOF measurement box in blue defining the measurement area for the fields Cymric-
     McKittrick is highlighted. The figure also shows new (orange) and active wells (green)
     (CalGEM, 2019) ............................................................................................................... 16
Figure 5 Plume height measurement example showing SOF alkane slant column (left) and
     MEFTIR alkane concentration (right). Two measurements are shown, one in the near field
     on Holloway and Highway 46 and the other in the far-field along Highway 33. The first
     order plume height estimates are 130 and 210 m, respectively. ...................................... 18
Figure 6. Emission measurement of Lost Hills Area with northeasterly winds ....................... 21
Figure 7 Concentration mapping of alkanes in Lost Hills N. Color and apparent height of curve
     (m) is proportional to concentration in mg/m3 x 100. Red > 2 mg/m3. ............................ 23
Figure 8. Concentration measurements showing BTEX and alkanes downwind of a water
     treatment area ................................................................................................................... 28
Figure 9. Concentration measurements of benzene. Color scale and point size show benzene
     concentrations (ppb) and the lines point in the instantaneous wind direction.................. 29
Figure 10. Alkane emission measurement of Cymric and McKittrick Areas with northerly winds
     .......................................................................................................................................... 30
Figure 11. Ratio measurement in and around Cymric and McKittrick fields with northeasterly
     winds ................................................................................................................................ 31
Figure 12. Partial alkane emission measurement of Belridge with northeasterly winds ......... 32
Figure 13. Ratio measurement in and around Taft ponds with northeasterly winds ................ 34
Figure 14. Mobile concentration measurements for community monitoring in Lost Hills 191007
     20:33 – 21:39 .................................................................................................................... 35
Figure 15. Mobile concentration measurements for community monitoring in Lost Hills 191015
     19:30 – 20:35 .................................................................................................................... 36
Figure 16. Mobile concentration measurements for community monitoring in Lost Hills 7, 9,
     and 15 October (top to bottom). Color scale and point size show benzene concentration
     (ppb) and the lines point in the instantaneous wind direction. ......................................... 37
Figure 17. Mobile concentration measurements of benzene in and around the McKittrick, 6 Oct
     (top) and 13 Oct (bottom)................................................................................................. 38

                                                                                                                                                9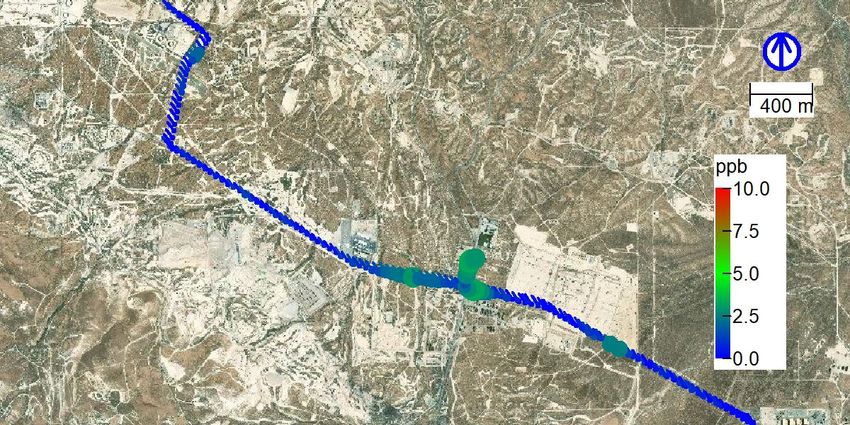
Figure 18. Mobile concentration measurements of benzene in and around the Derby Acres, 13
Oct (top) and 17 Oct (bottom) .......................................................................................... 39
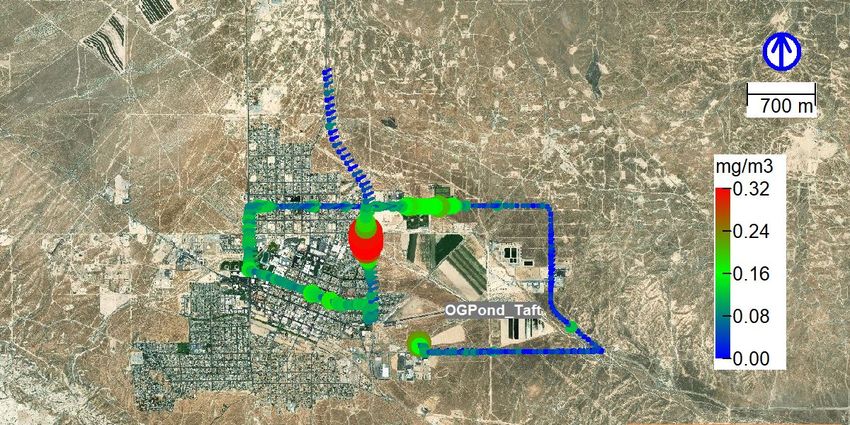
Figure 19. Mobile concentration measurements of benzene in and around the Taft, 16 Oct 2019
.......................................................................................................................................... 40
Figure 20 Plume dispersion visualized with SOF measurements with increasing distance from
a VOC emission source, daytime convective conditions. The two measurements nearest
the bottom of the image were made on a different day. ................................................... 41
10List of Tables
Table 1. Measurements carried out during the campaign. ....................................................... 17
Table 2 First order plume height from rise time (distance, d, divided by wind speed, U)
estimation and measurements (SOF column/MEFTIR concentration). ........................... 18
Table 3 Results of the emission measurements from SOF and indirectly measured emissions
(IME) from MeFTIR concentration. Days are the number of individual SOF measurement
days, N is the number of emission or concentration measurements; Mean and SD are the
mean and standard deviation of the SOF emission measurements, respectively; 1Q, Med,
3Q are the 25th, 50th (Median) and 75th percentile of the concentration ratio. The IME for
methane is calculated from the SOF Alkane emissions and the median methane to alkane
ratio................................................................................................................................... 20
Table 4 Alkane emission measurements of the Lost Hills oil field. ........................................ 21
Table 5 Alkane emission measurements of the Lost Hills N (North of Highway 46). ............ 21
Table 6 Methane to alkanes concentration ratios for Lost Hills N (North of Highway 46). .... 22
Table 7 Alkane emission measurements of the Lost Hills S (South of Highway 46). ............. 22
Table 8 Methane to alkanes concentration ratios for Lost Hills S (South of Highway 46). .... 22
Table 9 Summary of alkane emissions measurements for sections and groupings of sections in
the Lost Hills area made with SOF. Note that because measurements were made on
different days individual section emissions do not necessarily sum to the whole of the
group. Entries with an asterisk (*) in the first column (also underlined) had sufficient
measurements to meet the criteria for 30% certainty in emissions, while all others did not.
An underscore followed by a direction e.g. West, represents a half (West) or a quarter
(NW) section. ................................................................................................................... 23
Table 10 Summary of emissions measurements for well units (wellhead and aboveground
equipment) in the Lost Hills area made with SOF. Entries with an asterisk (*) in the Unit
column (also underlined) had sufficient measurements to meet the criteria for 30%
certainty in emissions, while all others did not. ............................................................... 24
Table 11 Summary of emissions measurements for activity related and other equipment
emissions in the Lost Hills area made with SOF. All of these locations and activities had
fewer than the minimum number of measurements required for 30% certainty in emissions.
An underscore followed by a direction e.g. West, represents a half (e.g. West) or a quarter
e.g. (NW) section. ............................................................................................................ 25
Table 12 Summary of emissions measurements for wells in the Lost Hills area made with
MEFTIR and tracer gas. ................................................................................................... 25
Table 13 Summary of alkane emission measurements for facilities in the Lost Hills area made
with SOF and MEFTIR. All areas except Facility 1 and its subsections had fewer than the
minimum number of measurements required for 30% certainty in emissions. ................ 26
Table 14 Alkane emission measurements of Facility 1. ........................................................... 26
Table 15 Alkane emission measurements of the Facility 1, plant only. ................................... 27
Table 16 Alkane emission measurements of Facility 1, water treatment. ................................ 27
Table 17 Alkane emission measurements of Cymric and McKittrick Fields........................... 31
11Table 18 Alkane and Methane emissions and Methane/Alkane ratios of the Cymric and
McKittrick major sources from SOF and MEFTIR measurements. *Could not be
confirmed as the same source. .......................................................................................... 32
Table 19 Partial emission measurements of Belridge Area. .................................................... 32
Table 20 Alkane and methane emission measurements of O&G produced water ponds. High
methane percentages for Cymric and Taft may indicate interfering sources. Cymric 2 had
fewer than the minimum number of measurements required for 30% certainty in emissions.
.......................................................................................................................................... 33
Table 21. Summary of all days with community monitoring. ................................................. 34
121 Objective and Introduction
This summary report consists of measurement results from a campaign in October 2019 carried
out in the San Joaquin Valley, CA. The campaign focused on methane and NMVOC emissions
from oil and gas production in the Lost Hills field and its impact on the neighboring community.
This report also includes investigations of other oil and gas production sources in Kern County
in support of CARB SNAPS measurements.
2 Survey Setup & Complementary Measurements
Measurements with Solar Occultation Flux (SOF), sky differential optical absorption
spectroscopy (SkyDOAS), mobile White cell DOAS (MWDOAS) and mobile extractive
Fourier transform infrared (MeFTIR) methods were carried out over 16 measurements days in
2019 (September 30-October 10 and October 13-October 18) in the SJV, California (Figure 1).
The focus of these measurements was methane and NMVOC emissions from oil and gas
production as well as investigating the impact of various sources on communities within the
vicinity. The gas measurements were combined with wind data, primarily from a mobile wind
LIDAR, to calculate fluxes and identify sources.
The objective was to quantify VOC emissions from the Lost Hills oil field and determine larger
sources and identify leaks within the field. Areas for emissions quantification are limited by
traversable roads and prevailing wind direction. The emissions area for the Lost Hills field is
delineated in Figure 1. This may exclude some minor producing areas with few active wells in
the south, east of Lost Hills Road, and another area in the north, north of Twisselman Road, in
some measurements. The survey areas within the Lost Hills field are shown in red in the same
figure. An extensive survey of methane point sources and emissions within the State of
California was conducted by the The Jet Propulsion Laboratory (JPL) from 2016 – 2017 (URL
https://methane.jpl.nasa.gov/, 13 Dec 2019). Of these measurements only 4 sources were
positively identified by repeated measurements in the Lost Hills field (Figure 1) out of 1105 for
the survey across the entire state.
1313 18
24 19
30 29
31 32 33
5 4 3
8 9 10
16 15
22
Figure 1. Lost Hills oil field and surroundings. Approximate boundary for total emissions area shown in blue.
Areas within the fields that were surveyed completely are shown in red with lines indicating section borders and
section numbers. Cyan section indicated area run by an operator outside the current study and was only surveyed
from the fenceline. Point markers indicate methane sources within the study area measured by The Jet Propulsion
Laboratory (JPL, URL https://methane.jpl.nasa.gov/, 13 Dec 2019). Inset: JPL methane sources and actual field
boundary from https://methane.jpl.nasa.gov/
All measurements have been subjected to quality control and assurance. This includes following
the standard protocols for SOF, MEFTIR, and MWDOAS, ocular examination of instruments
14and data, daily instrument calibration and statistical measures of data quality. The number of
accepted measurements varied substantially from day to day and from source to source
depending on weather conditions, local measurement conditions (accessibility, state of the
roads, obstacles etc.) and time sharing between areas and instruments. Statistical estimates of
the flux emissions (kg/h) from the various sources were computed for each measurement day
and for the entire survey, including the statistical error.
2.1 Sites – Lost Hills and other Oil and Gas Fields
Measurements during the survey were made on publicly accessible roads and for the Lost Hills
field on the roads operated by Operator A and Operator B. Some crossing of the areas of other
operators was inevitable in trying to reach the full extent of the Operator A or Operator B areas
and was unintentional. Active oil and gas wells within Lost Hills and the other major fields of
the study along with approximate area boundaries for the emissions survey are shown
highlighted in Figure 2 to Figure 4. In 2019 there were over 5000 new or active wells within
the Lost Hills fields (CalGEM 2019). Belridge was not measured in its entirety independently
during the campaign but was measured in part and in combination with Cymric-McKittrick.
Figure 2. SOF measurement box in blue defining the measurement area for the Lost Hills region. The figure also
shows new (orange) and active wells (green) (CalGEM, 2019).
15Figure 3. SOF measurement box in blue defining the measurement area for the Belridge North and South area.
The figure also shows new (orange) and active wells (green) (CalGEM, 2019). Note that wells in Belridge South
east of Highway 33 (highlight in red) have been included occasionally.
Figure 4. SOF measurement box in blue defining the measurement area for the fields Cymric-McKittrick is
highlighted. The figure also shows new (orange) and active wells (green) (CalGEM, 2019)
Table 1 shows the days that measurements were carried out during the campaign.
16Table 1. Measurements carried out during the campaign.
Date Lidar Location Emissions and Concentration Measurements Community Monitoring
30-Sep-2019 Wonderful Park Lost Hills
1-Oct-2019 Wonderful Park Lost Hills
2-Oct-2019 Operator A Lost Hills Operator A Lost Hills
3-Oct-2019 Operator A Lost Hills Operator A Lost Hills
4-Oct-2019 Operator A Lost Hills Operator A Lost Hills
5-Oct-2019 Operator A Lost Hills Lost Hills
McKittrick N of Fire Cymric, McKittrick, oil and gas produced
6-Oct-2019 Station water ponds (Ponds)
7-Oct-2019 Operator A Lost Hills Operator A Lost Hills Lost Hills, evening
8-Oct-2019 Operator A Lost Hills Operator A Lost Hills
Lost Hills, early morning
9-Oct-2019 Operator A Lost Hills Operator B, Outside operator fenceline Commercial Gas Leak
10-Oct-2019 Operator A Lost Hills Operator B, Outside operator fenceline
McKittrick N of Fire
13-Oct-2019 Station Cymric, McKittrick, Belridge, Ponds McKittrick, Derby Acres
15-Oct-2019 Wonderful Park Lost Hills Lost Hills
16-Oct-2019 Taft Ponds Taft, Midway-Sunset + Ponds Taft
McKittrick N of Fire
17-Oct-2019 Station McKittrick, Derby Acres
McKittrick N of Fire Plume tracing in
18-Oct-2019 Station Cymric, McKittrick, Belridge McKittrick, Derby Acres
2.2 Plume height
The height of the plume influences which wind speed and direction to apply in the flux
calculation. In this study we used the average wind speed of the wind LIDAR between ground
and 300 m altitude as the main wind speed and direction. This is based on other studies showing
a typical vertical mixing speed of 0.5 m/s (Mellqvist, 2009). Given the spatial extent of the oil
fields the orthogonal transport distance to the geographic center line generally leads to plume
height estimates above 300 m. However, for many of the measurements in this campaign near-
field sources may dominate, which leads to lower plume height estimates.
Therefore, appropriate wind profiles were applied individually. For large scale oil field fluxes,
0 – 300m winds were used, and for within field sources with ground level emissions, e.g. pump
jacks, gathering lines, and to some extent separators, 10 m winds from the in-field mast were
used. For Lost Hills measurements made on GP Road, Holloway Rd and Highway 46, 0 – 100m
winds were used. Because the 100 m and 300m winds are very similar this had little impact on
the measured emissions. A more complete analysis of winds will be made in a following report.
17An example of applied plume height estimation is shown in Figure 5. In this example plume
heights are estimated at least 130 m for the Holloway Road measurement and above 210 m for
the Highway 33 measurement. First order plume height estimates based on measurements are
given in Table 2. Calculated plume height from rise time is based on average distance from
mid-field source and wind speed during measurements and a vertical rise of 0.25 m/s.
Figure 5 Plume height measurement example showing SOF alkane slant column (left) and MEFTIR alkane
concentration (right). Two measurements are shown, one in the near field on Holloway and Highway 46 and the
other in the far-field along Highway 33. The first order plume height estimates are 130 and 210 m, respectively.
Table 2 First order plume height from rise time (distance, d, divided by wind speed, U) estimation and
measurements (SOF column/MEFTIR concentration).
Area (fields and associated facilities) Average Rise Time, Height, Rise Height,
Distance, d d/U (s) Time (m) Measured
(m) (m)
Lost Hills 4725 1970 492 210
Lost Hills N of 46 1940 747 187 150
Lost Hills S of 46 3779 1774 444 230
Cymric & McKittrick 3011 1187 297 540
Belridge 5073 2169 542 520
183 Results
Quantitative results for the oil field emission measurements in the San Joaquin Valley are
presented in section 3.1 and emission measurements of point sources and other distinct sources
are presented in section 3.2. Concentration measurements in communities and along oil field
‘fencelines’ (perimeters) as well as are detailed in Section 3.3 Community monitoring. Section
3.1 includes the results of a small number of measurement days in the San Joaquin Valley from
October 2018.
SOF measured direct emissions of alkanes, and SkyDOAS measured direct emissions of SO2,
NO2 and H2CO. MeFTIR and MWDOAS were used to measure mass concentration ratios of
methane to alkanes and BTEX to alkanes at the site fence-lines. These plume mass ratios were
combined with the direct alkane flux from SOF measurements to obtain indirect emission
estimates of methane and BTEX, respectively.
3.1 Emission measurements and gas fluxes – Oil and Gas Fields
Table 3 summarizes the results of the measurements of alkane emissions and methane/alkane
ratios for methane emissions (IME) for the major oil and gas fields in the survey. Ratio
measurements can be influenced by nearby point sources with different compositions than the
field, however, care has been taken to include as large an area as possible, to minimize the
influence of individual sources. Further details are given under the areas’ respective section and
in the results for identification and measurement of point sources.
Alkane emissions from Lost Hills averaged 522 kg/h with the emissions about equally
distributed between North and South fields (Table 3). Because the measurements were made at
different times, the sum of the area emissions does not equal the total for Lost Hills. There is
more uncertainty in the emissions from the South field. The nearby fields of Cymric &
McKittrick had much greater alkane emissions, averaging 1380 kg/h. The field of Belridge
could not be measured separately in its entirety due to wind direction. On the occasions when
Belridge was measured in conjunction with Cymric & McKittrick, emissions from Cymric &
McKittrick were judged to be significantly higher as well, so the difference between the two
measures (2968 to 1380 kg/h) does not solely represent the contribution of Belridge but also
the variability of Cymric & McKittrick.
Ratios of methane to alkanes varied between the fields with Cymric & McKittrick having much
higher percentages. For the Lost Hills field as a whole, the only qualified measurement gave an
integrated plume concentration ratio of 0.47 CH4/Alkane, which combined with the alkane
emissions, produces methane emissions of 244 kg/h. More measurements were available for
the fields individually with the South field showing higher methane ratios, 0.76 to 0.29 for the
North field.
19Table 3 Results of the emission measurements from SOF and indirectly measured emissions (IME) from MeFTIR
concentration. Days are the number of individual SOF measurement days, N is the number of emission or
concentration measurements; Mean and SD are the mean and standard deviation of the SOF emission
measurements, respectively; 1Q, Med, 3Q are the 25th, 50th (Median) and 75th percentile of the concentration ratio.
The IME for methane is calculated from the SOF Alkane emissions and the median methane to alkane ratio
Area (fields and Days NSOF Alkane SDalkane Nconc CH4 / CH4 / CH4 / CH4
associated kg/h kg/h Alkane Alkane Alkane kg/h
facilities) 1Q Med 3Q
Lost Hills 2 5 522 69 1 0.47 244
Lost Hills N of 46 3 14 210 85 6 0.24 0.29 0.35 61
Lost Hills S of 46 3 3 214 180 6 0.44 0.76 1.47 163
Cymric &
3 10 1380 373 10 1.39 1.77 2.14 2430
McKittrick
Cymric &
2 7 2970 873 N.M. N.M. N.M. N.M. N.M.
McKittrick Belridge
N.M.=Not measurable as an entity
SkyDOAS measurements were not a primary focus of the campaign since few combustion
sources exist in the fields and distances to the field perimeters and private roads preclude closer
access to facilities. There was no evidence of “super emitters” and the large-scale measurements
of NO2, SO2 and H2CO were not consistently differentiable from background and/or other
interfering sources and as such no results for the fields are reported. BTEX measurements with
the exception of point sources are below detectability for fenceline measurements. The point
sources measured indicate that BTEX emissions are less than 1% of the total emissions.
3.1.1 Lost Hills
Large scale measurements of the Lost Hills field were made on 2 days. Figure 6 shows one such
alkane emission measurement with easterly winds. Alkane emissions averaged 520 kg/h. Ratio
measurements were made on two days. Results for the emission measurements are given in
Table 4. Due to distance and meteorology, only one of the methane/alkane concentration ratio
measurements for Lost Hills in its entirety had sufficiently high concentrations of alkanes to be
used for the ratio determination. This had a methane to alkane mass ratio of 0.46 giving total
methane emissions of 244 kg/h.
Results for emissions measurements of the Lost Hills areas north and south of Highway 46 are
shown in Table 5 and Table 7, respectively. Substantially more measurements of the northern
portion were made due to the prevailing north-easterly winds on many days. Methane/alkane
concentration ratios are shown in Table 6 and Table 8 for the north and south sections,
respectively.
20Figure 6. Emission measurement of Lost Hills Area with northeasterly winds. Color scale and point size show the
SOF alkane column (mg /m2) and the lines point in the instantaneous wind direction.
Table 4 Alkane emission measurements of the Lost Hills oil field.
Day [yymmdd] Time Span N Emission Emission Wind Speed Wind
or Summary [hhmmss-hhmmss] Average SD Min-Max Direction
Statistic [kg/h] [kg/h] [m/s] Span [deg]
191001 151839-155657 1 450 N/A 2.8-2.8 350-350
191015 121110-165351 4 541 63.5 1.6-2.5 2-360
Total number of 5
measurements
Median 503.8
IQR 479.0 - 558.6
Mean 522.6
SD 68.5
Table 5 Alkane emission measurements of the Lost Hills N (North of Highway 46).
Day [yymmdd] Time Span N Emission Emission Wind Speed Wind
or Summary [hhmmss-hhmmss] Average SD Min-Max Direction
Statistic [kg/h] [kg/h] [m/s] Span [deg]
190930 123248-154234 5 174 56.2 2.2-3.2 16-339
191001 095714-164459 6 245 106.7 2.1-3.4 2-360
191005 132303-161818 3 200 66.9 2.3-2.8 334-357
Total number of 14
measurements
Median 204.1
IQR 134.6 - 245.5
Mean 210.2
SD 84.5
21Table 6 Methane to alkanes concentration ratios for Lost Hills N (North of Highway 46).
Day [yymmdd] Time Span N Mass Ratio Mass Ratio Wind Speed Wind
or Summary [hhmmss-hhmmss] Average SD Min-Max Direction
Statistic [%] [%] [m/s] Span [deg]
190930 150134-151945 1 27.8 N/A 2.4-2.4 343-343
191001 140851-163039 2 34.8 6.3 1.8-4.0 12-323
191005 144715-164050 2 29.6 10.2 1.3-1.9 313-345
191007 144737-145922 1 16.2 N/A 2.3-2.3 328-328
Total number of 6
measurements
Median 29.1
IQR 23.8 - 35.2
Table 7 Alkane emission measurements of the Lost Hills S (South of Highway 46).
Day [yymmdd] Time Span N Emission Emission Wind Speed Wind
or Summary [hhmmss-hhmmss] Average SD Min-Max Direction
Statistic [kg/h] [kg/h] [m/s] Span [deg]
190930 154616-163412 1 409 N/A 2.9-2.9 355-355
191005 135236-144610 1 55.0 N/A 2.1-2.1 340-340
191015 113525-130945 1 177 N/A 1.5-1.5 7-7
Total number of 3
measurements
Median 177.0
IQR 116.0 - 292.9
Mean 213.6
SD 179.7
Table 8 Methane to alkanes concentration ratios for Lost Hills S (South of Highway 46).
Day [yymmdd] Time Span N Mass Ratio Mass Ratio Wind Speed Wind
or Summary [hhmmss-hhmmss] Average SD Min-Max [m/s] Direction
Statistic [%] [%] Span [deg]
191001 115953-121050 1 74.4 N/A 3.7-3.7 290-290
191005 172126-173705 2 19.9 19.0 2.8-3.0 240-275
191007 221144-222049 1 78.1 N/A 3.9-3.9 279-279
191015 203938-210827 2 206 50.7 0.7-0.8 227-238
Total number of 6
measurements
Median 76.2
IQR 43.6 - 147.2
3.1.1.1 In Field Measurements
Seven days of in field measurements were made within the boundaries of the Lost Hills field.
A very large number of measurements were made of both individual wells and oil field sections.
No large well head leaks were detected during the survey. The largest leak detected was traced
to a buried pipeline that was later identified as belonging to a residential gas supplier and
emissions averaged 4.5 kg/h methane. A smaller leak on a pipeline from a pumpjack was also
identified through measurements and repaired by the operator. Most of the larger emission
sources were traced to activities: workover and other rigs, and vacuum trucks frequently
encountered in the field. The large instantaneous emissions from these activities can make it
more difficult to detect and locate smaller leaks. The largest permanent sources were traced to
22various separators within the fields. These were not generally located on the fields of the
operators for which we had authorization to measure. However, even well downwind their
emissions could dominate quarter sections. Leak detection would have benefited from night-
time measurements with less convection and better sensitivity to sources from a greater
distance. Figure 7 shows an example of the type of digital data from the survey and its
usefulness in identifying hotspots.
Figure 7 Concentration mapping of alkanes in Lost Hills N. Color and apparent height of curve (m) is proportional
to concentration in mg/m3 x 100. Red > 2 mg/m3.
Table 9 summarizes the results of section alkane emissions measurements where sections or
groupings could be measured multiple times. The section emissions are often difficult to
separate from one another and should be used merely as an indication of relative source
strength.
Table 9 Summary of alkane emissions measurements for sections and groupings of sections in the Lost Hills area
made with SOF. Note that because measurements were made on different days individual section emissions do not
necessarily sum to the whole of the group. Entries with an asterisk (*) in the first column (also underlined) had
sufficient measurements to meet the criteria for 30% certainty in emissions, while all others did not. An underscore
followed by a direction e.g. West, represents a half (West) or a quarter (NW) section.
Lost Hills Field Half Sections Days NSOF Alkane kg/h SDalkane kg/h
North S13+18+19+24 2 2 126 38
North S19 2 2 21 4
North* S24 3 6 39 21
North S32 3 3 30 5
South S3 - S10 1 2 135 86
South S4_West 1 2 13 2
South S4_North 2 3 10 8
South* S5 2 5 12 7
23Table 10 and Table 11 summarize unit (wellhead and aboveground equipment) and activity
related emissions. Note that the unit and activity related emissions differ strongly from field
measurements since they are biased to times of presumably higher emissions, i.e. a
measurement is made when emissions were seen. For example, no measurements were made
of vacuum trucks in the field that did not have obvious emissions. Because of time constraints
these were ignored. Note that units identify an area rather than a specific pump jack, pipe, or
other piece of equipment. Most units were measured only a single time but are included for
completeness. Most of the well units are below the typically accepted quantification limit for
SOF, 1 kg/h. Therefore, in addition to being biased to times of visible emissions, only one well
unit had emissions significantly greater than 1 kg/h. This particular well was also within the
vicinity of a vacuum truck which may have interfered, i.e. it was not possible to note the position
of the vacuum truck in relation to the wind at all times. For the entirety of the well unit
measurements, alkane emissions averaged 0.66 kg/h.
Table 10 Summary of emissions measurements for well units (wellhead and aboveground equipment) in the Lost
Hills area made with SOF. Entries with an asterisk (*) in the Unit column (also underlined) had sufficient
measurements to meet the criteria for 30% certainty in emissions, while all others did not.
Units (sequentially Days NSOF Alkane
numbered for Emissions
anonymization) kg/h
1 1 1 1.0
2 1 1 0.8
3* 2 9 0.7
4 1 1 0.5
5 1 2 1.1
6 1 2 0.1
7 1 1 0.4
8 1 1 0.3
9* 1 6 0.3
10 1 2 0.4
11 1 2 0.4
12 1 3 0.5
13 1 2 0.0
14 1 1 0.1
15 2 3 1.4
16* 1 4 1.7
17 1 2 0.4
18 1 2 1.9
19* 2 6 0.1
20 1 2 1.1
21 1 1 0.4
All* 54 0.66
24Table 11 Summary of emissions measurements for activity related and other equipment emissions in the Lost Hills
area made with SOF. All of these locations and activities had fewer than the minimum number of measurements
required for 30% certainty in emissions. An underscore followed by a direction e.g. West, represents a half (e.g.
West) or a quarter e.g. (NW) section.
Approximate location and Days NSOF Alkane
activity kg/h
S9_NW Vacuum Truck 1 3 2.0
Vacuum Truck Parking 1 3 1.7
S32 Drilling Fluid
Container 1 1 0.3
S29 Workover rig &
Vacuum Truck 1 2 1.4
S32 Workover 1 1 5.5
S4_SW Vacuum Truck 1 1 27.9
S4 Vacuum Truck 1 1 6.0
S5_SE Gathering 1 2 15.2
Additionally, emissions measurements of randomly selected wellheads and associated
aboveground equipment were made using the tracer correlation technique. If a large number of
wellheads can be measured in this manner, the technique can be used to scale up to field
emissions. Due to access and time constraints only a few well units were measured in this
fashion. Six wells were initially randomly selected from wells that could be accessed from their
entire perimeter. The selection was made by a CARB staff member. For the first 2 selections
the exact well could not be located so the team measured the emissions from the well nearest
the one identified in the selection process. Table 12 summarizes these measurements. Median
emissions from these for alkane were 0.07 kg/h and for methane 0.06 kg/h.
Table 12 Summary of emissions measurements for wells in the Lost Hills area made with MEFTIR and tracer gas.
Well Day Timespan N Alkane Methane Wind Speed Wind
[yymmdd] [hhmmss - hhmmss] Emissions ±SD Emissions ±SD (m/s) Direction
(kg/h) (kg/h) (deg)
1 191008 135721 -142031 8 0.07±0.10 0.02±0.02 1.6-2.5 17-355
2 191008 144914 -151152 6 0.10±0.06 0.15±0.11 0.7-2.7 7-348
3 191008 153715 -154803 5 0.02±0.02 0.06±0.08 2.0-3.5 3-60
4 191008 161052 -161943 5 0.04±0.03 0.01±0.01 0.8-2.3 30-72
3.1.1.2 Treatment/Processing Facilities
There are at least 5 facilities within the Lost Hills fields of which measurements were made.
The largest facility was also the largest emissions source of NMVOC emissions within the
Operator A area. The water treatment area for this facility contributes a large but highly variable
portion of these emissions. Because of the difference in plume heights between the plant and
the water treatment, total emissions are a little less certain. There were very little methane
emissions from the water treatment, and even the plant emissions were largely alkanes, with
methane emissions only 11% as large as the alkane emissions. To the SW corner of the plant
perimeter fenceline there was a parking/handling area for vacuum trucks. Both alkane and
methane emissions were measured from this location (SW quadrant of facility) but apparently
different sources. As with vacuum trucks in the field, emissions from this area were variable
25and suspect highly activity related. The total facility ratio measurements show the influence of
this additional methane source. Methane plumes from this facility were noted during two
flyovers in September 2017 (JPL, URL https://methane.jpl.nasa.gov/, 13 Dec 2019).).
The other smaller facilities also had measurable emissions, however, many fewer measurements
due to restricted access.
Table 13 Summary of alkane emission measurements for facilities in the Lost Hills area made with SOF and
MEFTIR. All areas except Facility 1 and its subsections had fewer than the minimum number of measurements
required for 30% certainty in emissions.
Area Days NSOF Alkane SDalkane Nconc CH4 / Alkane (%) CH4 kg/h
kg/h kg/h
Facility 1 Total 8 27 54 36 13 33* 18
Facility 1 Plant 2 5 27 10 9 11 3
Facility 1 Water Treatment 4 11 32 26 11 1 0
S32_Treatment+Storage 1 2 1 1
Facility 2 1 2 3 2 2 59 2
Facility 3 1 3 5 2 2 153 7
S19_Unknown 1 3 12 13 11 414 48
S19_Treatment 2 3 4 2 4 194 10
Table 14 Alkane emission measurements of Facility 1.
Day [yymmdd] Time Span N Emission Emission Wind Speed Wind
or Summary [hhmmss-hhmmss] Average SD Min-Max Direction
Statistic [kg/h] [kg/h] [m/s] Span [deg]
191002 112817-162519 6 64.9 61.1 1.9-2.8 5-356
191003 125807-161938 4 41.6 30.7 2.4-3.0 9-352
191004 103525-112450 3 59.9 13.8 3.0-3.3 341-341
191005 122512-164644 2 69.5 29.9 2.3-2.8 321-356
191007 112458-165708 6 40.4 8.9 1.3-2.8 4-343
191008 123342-132709 3 34.3 9.0 1.4-1.6 104-250
191009 150725-153722 2 54.5 0.2 6.3-6.5 352-353
191010 144046-145016 1 139 N/A 2.3-2.3 360-360
Total number of 27
measurements
Median 48.4
IQR 32.1 - 61.6
Mean 54.4
SD 36.6
26Table 15 Alkane emission measurements of the Facility 1, plant only.
Day [yymmdd] Time Span N Emission Emission Wind Speed Wind
or Summary [hhmmss-hhmmss] Average SD Min-Max Direction
Statistic [kg/h] [kg/h] [m/s] Span [deg]
191002 122336-164152 4 26.7 12.0 2.4-2.6 1-340
191007 162033-162713 1 26.8 N/A 1.9-1.9 334-334
Total number of 5
measurements
Median 26.8
IQR 25.2 - 35.6
Mean 26.7
SD 10.4
Table 16 Alkane emission measurements of Facility 1, water treatment.
Day [yymmdd] Time Span N Emission Emission Wind Speed Wind
or Summary [hhmmss- Average SD Min-Max Direction
Statistic hhmmss] [kg/h] [kg/h] [m/s] Span [deg]
191002 114544-121206 6 20.7 8.8 1.2-1.9 12-357
191003 130737-131156 1 16.1 N/A 2.1-2.1 324-324
191004 110025-110655 1 6.8 N/A 2.3-2.3 36-36
191008 113140-131726 3 67.2 22.8 1.0-1.7 85-109
Total number of 11
measurements
Median 25.6
IQR 13.4 - 35.2
Mean 31.7
SD 26.1
The water treatment area was the only consistently measurable source of BTEX emissions,
Figure 8. Here it can be seen how BTEX concentrations diminish with distance, i.e. toward the
north-south road crossing the channel in the image, while the alkane plume is still evident at
this distance. This likely indicates much larger and more alkane emissions, which is logical.
Benzene concentrations (Figure 9) higher than 5 ppb adjacent to one basin were measured on
multiple occasions and likewise diminished with distance to the road.
27Figure 8. Concentration measurements showing BTEX and alkanes downwind of a water treatment area. Color
scale and point size show BTEX (upper figure) and alkane (lower figure) concentrations (mg/m3) and the lines
point in the instantaneous wind direction. Color scale is logarithmic.
28Figure 9. Concentration measurements of benzene. Color scale and point size show benzene concentrations (ppb)
and the lines point in the instantaneous wind direction.
3.1.2 Cymric and McKittrick
The area defined here as Cymric and McKittrick includes the named fields and facilities within
their boundaries. Measurements were typically made as a partial box of Cymric and McKittrick
where the western boundary is formed by the western foothills. An example measurement is
shown in Figure 10. A concentration ratio measurement is shown in Figure 11. Several point
and area sources are evident in the figure: in the middle of the Cymric field there are several
large facilities and clear point source emissions of methane and alkane VOCs. Emissions from
these point sources were also quantified with SOF during this survey.
Emissions of alkanes for the Cymric and McKittrick fields were consistently greater than 1000
kg/h. Results are presented in Table 17. Alkane emissions averaged 1380 kg/h over 3 days and
10 measurements. Ratios of methane to alkanes were consistently greater than one, with a
median value of 1.8 and hence total methane emissions of 2430 kg/h (Table 3).
Emissions from the major sources in the Cymric and McKittrick fields are summarized in Table
18. None of these sources could be measured repeatedly on different days during the campaign
so the results should not be considered indicative of continuous emissions but provide a
snapshot of instantaneous emissions.
29Figure 10. Alkane emission measurement of Cymric and McKittrick Areas with northerly winds. Color scale and
point size show the SOF alkane column (mg /m2) and the line points in the instantaneous wind direction.
30Figure 11. Ratio measurement in and around Cymric and McKittrick fields with northeasterly winds. Color scale
and point size show methane (upper figure) and alkane (lower figure) concentrations (mg/m3) and the lines point
in the instantaneous wind direction. Color scale is logarithmic. The typical integrated mass ratio between CH4 and
alkanes was 1.3:1.
Table 17 Alkane emission measurements of Cymric and McKittrick Fields.
Day [yymmdd] Time Span N Emission Average Emission Wind Speed Wind
or Summary [hhmmss-hhmmss] [kg/h] SD Min-Max Direction
Statistic [kg/h] [m/s] Span [deg]
191006 115747-162159 6 1360 437.9 1.9-2.6 10-359
191013 151955-155628 1 1834 N/A 2.5-2.5 337-337
191018 143502-153414 3 1258 137.6 3.8-4.2 315-321
Total number of 10
measurements
Median 1340.4
IQR 1173.9 - 1478.2
Mean 1376.8
SD 372.6
31Table 18 Alkane and Methane emissions and Methane/Alkane ratios of the Cymric and McKittrick major sources
from SOF and MEFTIR measurements. *Could not be confirmed as the same source.
Area Days NSOF Alkane SDalkane Nconc CH4 / CH4 / CH4 / CH4
kg/h kg/h Alkane Alkane Alkane kg/h
1Q (%) Med (%) 3Q (%)
Cymric Facility 1 1 2 289 150 6 426 473 477 1369
Cymric Facility 2 1 2 99 8 8 93 107 158 106
MidField
Facility/Gathering 1 1 408 - 3 904 1218 1656 *
Gathering_Hwy58
W 1 2 6 7 2 460 474 488 31
3.1.3 Belridge
Partial emissions measurements of Belridge were made during the current study as these
accounted for the inflow to Cymric-McKittrick emission measurements. One such
measurement is shown in Figure 12. Alkane emission measurements of this portion of Belridge
were made over several days with consistent results over 400 kg/h. No complete measurements
of Belridge were possible due to prevailing easterly winds.
Figure 12. Partial alkane emission measurement of Belridge with northeasterly winds. Color scale and point size
show the SOF alkane column (mg /m2) and the line points in the instantaneous wind direction.
Table 19 Partial emission measurements of Belridge Area.
Day [yymmdd] or Time Span N Emission Emission Wind Speed Wind
Summary Statistic [hhmmss-hhmmss] Average SD Min-Max Direction
[kg/h] [kg/h] [m/s] Span [deg]
191006 111238-132116 4 379 115.7 1.8-2.5 10-355
191013 154315-162512 2 380 63.3 2.3-2.7 333-338
Total measurements 6
Median 369.5
IQR 311.4 - 419.3
Mean 379.1
SD 94.0
323.1.4 Oil and Gas Produced Water Ponds
The Cymric/McKittrick oil and gas produced water ponds surveyed were small sources of
alkane emissions and should be inconsequential for methane emissions. Because they are
surrounded by typically larger sources, isolated emissions measurements with SOF were
difficult. The Taft ponds and nearby vicinity showed evidence of emissions and high
concentrations during times of low wind speeds. Only one day of measurements were made so
it is unknown if these are typical emissions. The high percentages of methane in the plume may
indicate other sources than the ponds if they are not evidence of biological activity in the
sediment.
Table 20 Alkane and methane emission measurements of O&G produced water ponds. High methane percentages
for Cymric and Taft may indicate interfering sources. Cymric 2 had fewer than the minimum number of
measurements required for 30% certainty in emissions.
O&G Ponds Days NSOF Alkane SDalkane Nconc CH4 / Alkane (%) CH4 kg/h
kg/h kg/h
Cymric 1 2 4 10 7 - - -
Cymric 2 2 3 7 8 1 60 4
Taft 1 4 17 4 7 241 40
33You can also read