2021 WCA Annual Conference - The Latest on Multi-Modal Transportation Presented by Gary R. Goyke - Wisconsin Counties ...
←
→
Page content transcription
If your browser does not render page correctly, please read the page content below
2021 WCA Annual
          Conference
The Latest on Multi-Modal Transportation
       Presented by Gary R. Goyke

                Tuesday, September 28, 2021
                    8:00 a.m. – 9:00 a.m.
     La Crosse Center – South Hall B4/Blue (Lower Level)
                    La Crosse, Wisconsin

          Moderated by Monica Kruse
      County Board Chair, La Crosse County

                   Gary R. Goyke
                 Goyke & Associates
          130 Lakewood Blvd., Madison, WI 53704
              gary.goyke@gmail.com (email)
            608-249-8118 • 608-219-5237 (cell)
                 garygoyke.com (website)
Our discussion today summarizes some basic principles for sound multi-
modal programs and planning. I am honored to be included in this
convention.
The Wisconsin Counties Association is already a leader in defining the
principles and practices of multi-modal transportation. I am hopeful our
meeting today will continue to move all of us forward in our state’s
commitment to an efficient and fair Wisconsin transportation network.
I want to acknowledge the excellent work and ideas of Todd Alexander
Litman that form the basis for this breakout session.
Gary R. Goyke
WCA Convention
La Crosse, Wisconsin
September 28, 2021
Two Boxes of Twelve Points for Discussion
• Highways • Mississippi River
• Complete streets • La Crosse Transit Center
• Eminent domain • Interstate highways
• Transit cuts • Airport
• Transportation • Passenger rail
Committees • Shared rides
• Joint Finance Committee • Taxis
• Robin Vos • TNCs
• Tony Evers • Bikes
• Pete Buttigieg • Pedestrian access
• Craig Thompson • Medical rides
• Joe Biden • Roads and highways
• Democracy – State budgetMulti-Modal Transportation Planning
Victoria Transport Policy Institute
Introduction
To be efficient and fair a transportation system must serve diverse demands. For example, would be
inefficient if inadequate sidewalks and paths force parents to chauffeur children to local destinations
to which they would rather walk or bicycle, or if inadequate mobility options force urban commuters
to drive although they would prefer to rideshare or use transit. Physically, economically and socially
disadvantaged people in particular need diverse mobility options: walking and cycling for local travel,
public transit for longer trips, and automobiles (ridesharing, chauffeuring and taxi travel) when
necessary. As a result, to be efficient and fair transportation must be multimodal.
Before about 1940, walking, bicycling and public transit were recognized as important travel modes,
but for most of the last century transport planning was automobile-oriented. As a result, most
communities now have well developed road systems that allow motorists to drive to most
destinations with relative convenience and safety; at worst they may be delayed by peak period
congestion, and pay tolls and parking fees at some destinations. However, such planning ignored
non-automobile travel demands, such as those in the following box.
Non-Automobile Travel Demands
Youths 10-20 (10-30% of population).
Seniors who do not or should not drive (5-15%).
Adults unable to drive due to disability (3-5%).
Lower income households burdened by vehicle expenses (15-30%).
Law-abiding drinkers, and other impaired people (a small but important demand to serve).
C i ii h lack a ehicle d i e lice e
People who want to walk or bike for enjoyment and health.
Drivers who want to avoid chauffeuring burdens.
Residents who want reduced congestion, accidents and pollution emissions.
Of course, not everybody uses all travel options, but most communities include people who need
each one. For example, not everybody uses public transit or needs universal design features such as
curbcuts and ramps, but most communities include some people who require them to travel
independently, and most people will need them sometime in their lives. As a result, even people
h d c e l e a a ic la de a al e ha i g i i hei c nity, similar to
lifeboats on a ship that are seldom used but important to have available; called option value.
Travel demands, and therefore the value of more multimodal planning, can be evaluated from
different perspectives. The narrowest only counts people who currently depend on a particular
mode. However, this often reflects a self-fulfilling prophecy: underinvestment in these modes makes
them difficult to use. A broader perspective also considers occasional users, and latent demand
(potential walking, cycling and public transit trips that could be made if their conditions were
improved), external impacts (benefits to other people when travellers can walk, bicycle and use
public transit rather than drive) and strategic community objectives (reduced traffic and parking
congestion, affordability, improved mobility for non-drivers, etc.). These tend to justify more
multimodal planning. As a result, many people around the world increasingly recognize the diversity
of travel demands and the importance of more multimodal planning.
This report examines these issues. It discusses various travel demands, and how multimodal
transportation planning can effectively respond to those demands.
7Multi-Modal Transportation Planning
Victoria Transport Policy Institute
Multimodal Planning Concepts
Multi-modal planning refers to planning that considers various modes (walking, cycling, automobile,
public transit, etc.) and connections among modes.
There are several specific types of transport planning which reflect various scales and objectives:
Traffic impact studies evaluate traffic impacts and mitigation strategies for a particular development
or project.
Local transport planning develops municipal and neighborhood transport plans.
Regional transportation planning develops plans for a metropolitan region.
State, provincial and national transportation planning develops plans for a large jurisdiction, to be
implemented by a transportation agency.
Strategic transportation plans develop long-range plans, typically 20-40 years into the future.
Transportation improvement plans (TIPs) or action plans identify specific projects and programs to be
implemented within a few years.
Corridor transportation plans identify projects and programs to be implemented on a specific
corridor, such as along a particular highway, bridge or route.
Mode- or area-specific transport plans identify ways to improve a particular mode (walking, cycling,
public transit, etc.) or area (a campus, downtown, industrial park, etc.).
Figure 1 Transport Planning Process A transport planning process typically
(FHWA and FTA, 2007) includes the following steps:
Monitor existing conditions.
Forecast future population and
employment growth, and identify major
growth corridors.
Identify current and projected future
transport problems and needs, and various
projects and strategies to address those
needs.
Evaluate and prioritize potential
improvement projects and strategies.
Develop long-range plans and short-range
programs identifying specific capital
projects and operational strategies.
Develop a financial plan for implementing
the selected projects and strategies.
Conventional transportation evaluation tends to focus on certain impacts, as summarized in Table 1.
Commonly-used transport economic evaluation models, such as MicroBenCost, were designed for
8Multi-Modal Transportation Planning
Victoria Transport Policy Institute
highway project evaluation, assuming that total vehicle travel is unaffected and is unsuitable for
evaluating projects that include alternative modes or demand management strategies.
Table 1 Impacts Considered and Overlooked
Usually Considered Often Overlooked
Generated traffic and induced travel impacts
Downstream congestion
Impacts on non-motorized travel (barrier effects)
Parking costs
Vehicle ownership and mileage-based depreciation costs.
Project construction traffic delays
Indirect environmental impacts
Strategic land use impacts (sprawl versus smart growth)
Financial costs to governments Transportation diversity and equity impacts
Vehicle operating costs (fuel, tolls, tire wear) Per-capita crash risk
Travel time (reduced congestion) Public fitness and health impacts
Per-mile crash risk T a ele efe e ces for alternative modes (e.g., for walking
Project construction environmental impacts and cycling)
Conventional transportation planning tends to focus on a limited set of impacts. Other impacts tend to be
overlooked because they are relatively difficult to quantify (e.g., equity, indirect environmental impacts), or
simply out of tradition (e.g., parking costs, vehicle ownership costs, construction delays).
Conventional transportation planning strives to maximize traffic speeds, minimize congestion and
reduce distance-based crash rates using a well-developed set of engineering, modeling and financing
tools. Many jurisdictions codify these objectives in concurrency requirements and traffic impact fees,
which require developers to finance roadway capacity expansion to offset any increase in local
traffic. Alternatives to roadway expansion, such as transportation demand management and multi-
modal transport planning, are newer and so have fewer analysis tools. As a result, conventional
planning practices support automobile dependency, which refers to transport and land use patterns
favoring automobile travel over alternative modes (in this case, automobile includes cars, vans, light
trucks, SUVs and motorcycles).
In recent years transportation planning has expanded to include more emphasis on non-automobile
modes and more consideration of factors such as environmental impacts and mobility for non-
drivers. In recent decades many highway agencies have been renamed transportation agencies, and
have added capacity related to environmental analysis, community involvement and nonmotorized
planning. Some are applying more comprehensive and multi-modal evaluation (Litman 2012).
Transport modeling techniques are improving to account for a wider range of options (such as
alternative modes and pricing incentives) and impacts (such as pollution emissions and land use
effects). In addition, an increasing portion of transport funds are flexible, meaning that they can be
spent on a variety of types of programs and projects rather than just roadways.
9Multi-Modal Transportation Planning
Victoria Transport Policy Institute
Figure 2 Four-Step Traffic Model Most regions use four-step models to predict future
transport conditions (see Figure 2). The region is
divided into numerous transportation analysis zones
(TAZs) each containing a few hundred to a few
thousand residents. Trip generation (the number
and types of trips originating from each TAZ) is
predicted based on generic values adjusted based on
local travel surveys that count zone-to-zone peak-
period trips. These trips are assigned destinations,
modes and routes based on their generalized costs
(combined time and financial costs), with more trips
assigned to relatively cheaper routes and modes,
taking into account factors such as travel speeds,
congestion delays and parking costs. Transport
models are being improved in various ways to better
predict future travel activity, including the effects of
various transport and land use management
strategies.
www.mwcog.org/transportation/activities/models/4_step.asp
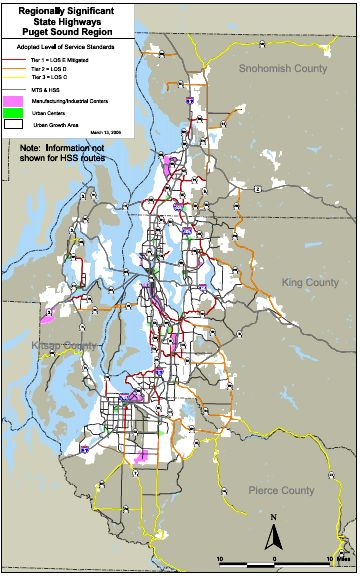
This predicts future peak-period traffic Figure 3 Highway LOS Map (PSRC 2008)
volumes on each route, and identifies
where volumes will exceed capacity
(based on the volume/capacity ratio or
V/C) of specific roadway links and
intersections. The intensity of congestion
on major roadways is evaluated using
level-of-service (LOS) ratings, a grade
from A (best) to F (worst).
Table 2 summarizes highway LOS ratings.
Similar ratings are defined for arterial
streets and intersections. Roadway level-
of-service is widely used to identify
traffic problems and evaluate potential
roadway improvements. Figure 3
illustrates a typical model output: a map
showing LOS ratings of major regional
roadways.
10Multi-Modal Transportation Planning
Victoria Transport Policy Institute
Table 2 Highway Level-Of-Service (LOS) Ratings (Wikipedia)
LOS Description Speed Flow Density
(mph) (veh./hour/lane) (veh./mile)
Traffic flows at or above posted speed limit. Motorists
A have complete mobility between lanes. Over 60 Under 700 Under 12
Slightly congested, with some impingement of
maneuverability. Two motorists might be forced to
B drive side by side, limiting lane changes. 57-60 700-1,100 12-20
Ability to pass or change lanes is not assured. Most
experienced drivers are comfortable and posted speed
is maintained but roads are close to capacity. This is
C the target LOS for most urban highways. 54-57 1,100-1,550 20-30
Typical of an urban highway during commuting hours.
Speeds are somewhat reduced, motorists are hemmed
D in by other cars and trucks. 46-54 1,550-1,850 30-42
Flow becomes irregular and speed varies rapidly, but
rarely reaches the posted limit. On highways this is
E consistent with a road over its designed capacity. 30-46 1,850-2,000 42-67
Flow is forced, with frequent drops in speed to nearly 67-
F zero mph. Travel time is unpredictable. Under 30 Unstable Maximum
This table summarizes highway Level of Service (LOS) rating, an indicator of congestion intensity.
Under optimal conditions a grade separated highway can carry up to 2,200 vehicles per hour (VPH)
per lane, and an arterial with intersections about half that. Table 3 indicates commonly used traffic
measurement units. These are generally measured during peak hours. Speed is generally based on
the 85th percentile (the speed below which 85% of vehicles travel). Traffic volumes are also
sometimes measured as Annual Average Daily Traffic (AADT).
Table 3 Basic Traffic Units
Parameter Typical Units Reciprocal Typical Units
Flow Vehicles per hour (Veh/h) Headway Seconds per vehicle (s/veh)
Speed Kilometers or miles per hour (Km/h) Travel time Seconds per km or mi (s/km)
Density Vehicles per lane-km or mi (veh/lane-km) Spacing Feet or meters per vehicle (m/veh)
This table summarizes units commonly used to measure vehicle traffic.
Terms and Concepts
Traffic congestion can be recurrent (occurs daily, weekly or annually, making it easier to manage) or
non-recurrent (typically due to accidents, special events or road closures).
Design vehicle refers to the largest vehicle a roadway is designed to accommodate. Passenger Car
Equivalents PCE i dica e a la ge ehicle affic i a c compared with a typical car.
A queue is a line of waiting vehicles (for example, at an intersection). A platoon is group of vehicles
moving together (such as after traffic signals turn green).
Capacity refers to the number of people or vehicles that could be accommodated. Load factor refers
to the portion of capacity that is actually used. For example, a load factor of 0.85 indicates that 85%
of the maximum capacity is actually occupied.
11Multi-Modal Transportation Planning
Victoria Transport Policy Institute
A typical transport planning process defines the minimum level-of-service considered acceptable
(typically LOS C or D). Roads that exceed this are considered to fail and so deserve expansion or
other interventions. This approach is criticized on these grounds:
It focuses primarily on motor vehicle travel conditions. It assumes that transportation generally
consists of automobile travel, often giving little consideration to travel conditions experienced by
other modes. As a result, it tends to result in automobile dependency, reducing modal diversity.
It defines transportation problems primarily as traffic congestion, ignoring other types of problems
such as inadequate mobility for non-drivers, the cost burden of vehicle ownership to consumers and
parking costs to businesses, accident risk, and undesirable social and environmental impacts.
It ignores the tendency of traffic congestion to maintain equilibrium (as congestion increases, traffic
demand on a corridor stops growing), and the impacts of generated traffic (additional peak-period
vehicle travel that results from expanded congested roadways) and induced travel (total increases in
vehicle travel that result from expanded congested roadways). As a result, it exaggerates the degree
of future traffic congestion problems, the congestion reduction benefits of expanding roads, and the
increased external costs that can result from expanding congested roadways.
It can create a self-fulfilling prophecy by directing resources primarily toward roadway expansion at
the expense of other modes (widening roads and increasing traffic speeds and volumes tends to
degrade walking and cycling conditions, and often leaves little money or road space for improving
other modes).
Short trips (within TAZs), travel by children, off-peak travel and recreational travel are often ignored
or undercounted in travel surveys and other statistics, resulting in walking and cycling being
undervalued in planning.
In recent years transportation planning has become more multi-modal and comprehensive,
considering a wider range of options and impacts. Transport planners have started to apply Level-of-
Service ratings to walking, cycling and public transit, and to consider demand management
strategies as alternatives to roadway capacity expansion.
Green Transportation Hierarchy Some urban areas have established a
1. Pedestrians transportation hierarchy which states
2. Bicycles
that more resource efficient modes will
3. Public transportation
4. Service and freight vehicles be given priority over single occupant
5. Taxis automobile travel, particularly on
6. Multiple occupant vehicles (carpools) congested urban corridors. This provides
7. Single occupant vehicles a basis for shifting emphasis in transport
planning, road space allocation, funding
The Green Transportation Hierarchy favors more and pricing to favor more efficient
affordable and efficient (in terms of space, energy
modes.
and other costs) modes.
12Multi-Modal Transportation Planning
Victoria Transport Policy Institute
Multimodal Transportation Planning
Multmodal planning refers to transportation and land use planning that considers diverse
transportation options, typically including walking, cycling, public transit and automobile, and
accounts for land use factors that affect accessibility. A growing body of resources are being
developed for multimodal planning (Williams, Claridge and Carroll 2016).
Multimodal transportation accounts for the differing capabilities of different modes, including their
availability, speed, density, costs, limitations, and therefore their most appropriate uses (Table 4).
Table 4 Mode Profiles
Mode Availability Speed Density Loads Costs Potential Users Limitations
Times and locations typical space carrying user Non- Handi-
served speeds needed capacity costs Drivers Poor capped
Requires physical ability.
Limited distance and
Wide (nearly carrying capacity. May be
Walking universal) 2-5 mph High Small Low Yes Yes Varies difficult or unsafe to use.
Limited
(requires Requires suitable sidewalk
suitable or path. Limited distance
Wheelchair facilities) 2-5 mph Medium Small Med. Yes Yes Yes and carrying capacity.
Wide (feasible Requires bicycle and ability.
on most roads 5-15 Small to Limited distance and
Bicycle and paths) mph Medium medium Med. Yes Yes Varies carrying capacity.
Moderate (in
most urban 20-60 Limite High costs and limited
Taxi areas) mph Low Medium High Yes d Yes availability.
Fixed Route Limited (major 20-40 Limited availability.
Transit urban areas) mph High Small Med. Yes Yes Yes Sometimes difficult to use.
10-30 High cost and limited
Paratransit Limited mph Medium Small High Yes Yes Yes service.
Wide (nearly 20-60 Medium Limite Requires driving ability and
Auto driver universal) mph Low to large High No d Varies automobile. Costly.
Requires cooperative
Ridesharing Limited (only motorist. Chauffeuring
(auto suited for some 20-60 (special trips) require
passenger) trips) mph High Medium Low Yes Yes Yes di e i e.
Carsharing Limited (needs Requires convenient and
(vehicle nearby 20-60 Medium Limite affordable vehicle rentals
rentals) services) mph Low to large Med. No d Varies services.
Wide (nearly 20-60 Limite Requires motorcycle and
Motorcycle universal) mph Medium Medium High No d No ability. Moderate costs.
Wide (nearly Requires equipment and
Telecommute universal) NA NA NA Med. Yes Varies Varies skill.
This table summarizes the performance of various transportation modes.
13Why Not Drive?
Driving is often the fastest mode of travel, and although automobiles are expensive to own (considering fixed
costs such as depreciation, insurance, registration fees, scheduled maintenance and residential parking
expenses) they are relatively cheap to drive, typically costing just a few cents per mile in operating expenses.
Automobile travel also tends to be more comfortable and prestigious than other modes. This explains why 70-
1
90% of trips are made by automobile (depending on definitions and conditions).
But for various reasons travelers often need or prefer travel by alternative modes:
Many people cannot drive. In a typical community, 20-40% of the total population, and 10-20% of
adolescents and adults, cannot drive due to disability, economic, age constraints, or vehicle failures.
Inadequate transport options reduces non-drivers ability to access activities and forces motorists to
chauffeur non-drivers (according to the 2009 National Household Travel Survey, 5% of total trips were
specifically to transport a passenger).2
Many people should not drive for some trips, due to inebriation, disability, or economic constrains. For
example, efforts to reduce driving by higher-risk groups (people who are impaired by alcohol or drugs,
young males, or people with dementia) can only be successful if there are good alternatives to driving. The
high costs of automobile transport places a major financial burden on many lower-income people.
Travelers sometimes prefer using alternative modes, for example, because walking and cycling are more
enjoyable and provide healthy exercise, or public transit commuting imposes less stress and allows
commuters to read, work or rest.
Society could benefit from more efficient road, parking, fuel and insurance pricing, or more efficient
management of road space, that favor higher value trips and more efficient modes in order to reduce
traffic congestion, parking costs, accidents and pollution emissions.
It is therefore interesting to consider what mode share is overall optimal to users and society, and the portion
of automobile travel that occurs because travelers lack suitable alternatives. For example, if walking and
cycling conditions, and public transit service quality were better, how much more would people rely on these
mode, and how much less automobile travel would occur?
In fact, walking, cycling and public transit travel do tend to be much higher, and automobile travel is much
lower, in communities with better transport options. For example, Guo and Gandavarapu (2010) estimate
that completing the sidewalk network in a typical U.S. town on average increases non-motorized travel 16%
(from 0.6 to 0.7 miles per day) and reduces automobile travel 5% (from 22.0 to 20.9 vehicle-miles). Similarly,
residents of transit-oriented communities tend to use alternative modes 2-10 times more frequently, and
drive 10-30% fewer miles, than residents of automobile-oriented communities (Cervero and Arrington 2008;
Litman 2009). Even larger travel reductions occur if improvements in alternative modes are implemented in
conjunction with incentives such as more efficient road, parking and insurance pricing.
This indicates latent demand for alternative modes, that is, people would like to rely more on alternative
modes but are constrained by poor walking and cycling conditions and inadequate public transit services. This
is not to suggest that in an optimal transport system people would forego driving altogether, but it does
indicate that given better transport options and more efficient incentives, people would rationally choose to
drive less, rely more on alternative modes, and be better off overall as a result.
1
Travel surveys tend to undercount walking and cycling trips, so actual non-motorized mode share is often much
higher than indicated by conventional surveys. Walking, cycling and public transit represent a greater mode share in
urban areas, and among people who are young, have disabilities, or low incomes.
2
http://nhts.ornl.gov/tables09/fatcat/2009/pmt_TRPTRANS_WHYTRP1S.html.
Todd Alexander Litman © 2006-2021
You are welcome and encouraged to copy, distribute, share and excerpt this document and its ideas, provided the author is
given attribution. Please send your corrections, comments and suggestions for improvement.Multi-Modal Transportation Planning
Victoria Transport Policy Institute
Such analysis is even more complex because each mode includes various subcategories with
i e cha ac e i ic F e a le ede ia i cl de e le a ding, walking alone and in
groups, using canes and walkers, jogging and running, playing, walking pets, carrying loads, and
pushing hand carts. Their actual needs, abilities, impacts and value to society can vary
significantly, as indicated in Table 5.
Table 5 Nonmotorized Facility Uses Compared
Mode or Activity Facility Requirements Risk to Others Basic Mobility
Quality and quantity of Danger these users Whether the mode provides
pedestrian facilities impose on others basic mobility benefits)
People standing Minimal None NA
People sitting at benches or Seats or benches None NA
tables
Individual walkers Minimal Low High
Walkers in groups Medium Low High
Walkers with children Medium Low High
Children playing Medium to large Medium Medium
Walkers with pets Medium to large Low Medium
Human powered wheelchairs Medium Low Very High
Motor powered wheelchairs Medium to large Medium to high Very High
Joggers and runners Medium to large Medium Medium
Skates and push-scooters Large Medium Low
Powered scooters and Segways Large Medium Low to high
Human powered bicycle Medium to large Medium to high Medium
Motorized bicycle Large High Low
People with handcarts or wagons Medium to large Low to medium Medium
Vendors with carts and wagons Medium to large Low Sometime (if the goods sold
a e c ide ed ba ic
This table compares various nonmotorized facility users.
Similarly, public transit (also called public transportation or mass transit) includes various types
of services and vehicles. Table 6 summarizes the performance of various types of public transit.
Actual performance depends on specific circumstances; for example costs per trip can vary
depending on which costs are included (for example, whether major new road or rail
improvements are required, whether Park-and-Ride facilities are included in transit budgets,
construction and operating costs, load factors and types of trips.
8Multi-Modal Transportation Planning
Victoria Transport Policy Institute
Table 6 Transit Modes Compared
Name Description Availability Speed Density Costs
Destinations Passenger Passenger Cost per trip
served travel speeds volumes
Heavy rail Relatively large, higher-speed trains, Limited to High Very high Very high
operating entirely on separate rights- major corridors
of-way, with infrequent stops, in large cities
providing service between
communities.
Light Rail Transit Moderate size, medium-speed trains, Limited to Medium High High
(LRT) operating mainly on separate rights-of- major corridors
way, with variable distances between
stations, providing service between
urban neighborhoods and commercial
centers.
Streetcars (also Relatively small, lower-speed trains, Limited to Medium High High
called trams or operating primarily on urban streets, major corridors
trolleys) with frequent stops which provide
service along major urban corridors.
Fixed route bus Buses on scheduled routes. Widely available Low to High Low to
transit in urban areas medium medium
Bus Rapid A bus system with features that Limited to Medium to High Low to
Transit (BRT) provide a high quality of service. major corridors high medium
Express bus Limited stop bus service designed for Limited to High High Low to
commuters and special events. major corridors medium
Ferry services Boats used to transport people and Limited to Low to Low to Medium to
vehicles. major corridors medium medium high
Paratransit Small buses or vans that provide door- Widely available Low Low High
to-door, demand-response service.
Personal Rapid Small, automated vehicles that provide Limited to Low to Low to Medium to
Transit (PRT) transit service, generally on tracks. major corridors medium medium high
Vanpool Vans used for ridesharing. Widely available Medium to High Low
high
Shared taxi. Private taxis that carry multiple Limited to busy Medium to Low to Medium to
customers. corridors high medium high
Taxi Conventional taxi service. Widely available Medium to Low High
high
This table summarizes different types of public transit and their performance attributes.
Multi-modal transport planning requires tools for evaluating the quality of each mode, such as
Level-of-Service standards which can be used to indicate problems and ways to improve each
mode. Tables 7 and 8 indicate factors that can be considered when evaluating different modes.
9Multi-Modal Transportation Planning
Victoria Transport Policy Institute
Table 7 Nonmotorized Level-Of-Service Rating Factors
Feature Definition Indicators
Portion of streets with nonmotorized facilities.
Whether sidewalks and Length of path per capita.
paths exist, and connect Network connectivity and density (kilometers of
Network continuity throughout an area. sidewalks and paths per square kilometer).
Sidewalk and path functional width.
Whether sidewalks and Portion of sidewalks and paths that meet current
paths are properly designed design standards.
Network quality and maintained. Portion of sidewalks and paths in good repair.
Road crossing widths.
Motor vehicle traffic volumes and speeds.
Average pedestrian crossing time.
Safety and speed of road Quantity and quality of crosswalks, signals and crossing
Road crossing crossings guards.
Separation of nonmotorized Distance between traffic lanes and sidewalks or paths.
traffic from motorized Presence of physical separators, such as trees and
traffic, particularly high bollards.
Traffic protection traffic volumes and speeds. Speed control.
Functional width of sidewalk and paths.
Peak-period density (people per square meter)
Clearance from hazards, such as street furniture and
Whether sidewalks and performers within the right-of-way.
Congestion and paths are crowded or Number of reported conflicts among users.
user conflicts experience other conflicts. Facility management to minimize user conflicts.
Topography Presence of steep inclines. Portion of sidewalks and paths with steep inclines.
Perceived accident, crime or Reported security incidents.
Sense of Security abuse threats. Quality of visibility and lighting.
Availability and quality of signs, maps and visitor
Wayfinding Station area navigation aids. information services.
Weather User protected from sun
protection and rain. Presence of shade trees and awnings.
Litter, particularly potentially dangerous objects.
Cleanliness of facilities and Graffiti on facilities and nearby areas.
Cleanliness nearby areas. Effectiveness of sidewalk and path cleaning programs.
Quality of facility design.
Quality of nearby buildings and landscaping.
Area Livability (environmental and social quality of an
area).
Community cohesion (quantity and quality of positive
The attractiveness of the interactions among people in an area).
facility, nearby areas and Number of parks and recreational areas accessible by
Attractiveness destinations. nonmotorized facilities.
Quality of nonmotorized education and promotion
Effectiveness of efforts to programs.
encourage nonmotorized Nonmotorized transport included in Commute Trip
Marketing transportation. Reduction programs.
This table summarizes factors to consider when evaluating walking and cycling conditions.
10Multi-Modal Transportation Planning
Victoria Transport Policy Institute
Table 8 Transit Level-of-Service Rating Factors
Feature Description Indicators
Geographic coverage (Portion of destinations within 500 meters of transit)
Where and when Annual service-kilometers per capita.
transit service is Daily hours of service.
Availability available. Hours of service.
Operating frequency.
Frequency of service Headways (time between trips).
Frequency and average wait time. Average waiting times.
Average vehicle speeds.
Transit travel speed relative to driving the same trip.
Travel Speed Transit travel speed. Door-to-door travel time.
How well service On-time operation.
actually follows Portion of transfer connections made.
Reliability published schedules. Mechanical failure frequency.
Boarding Vehicle loading and Dwell time.
speed unloading speed. Boarding and alighting speeds.
Perceived passenger security.
Accidents and injuries rates.
Reported security incidents.
Safety and Perceived user safety Visibility and lighting.
security and security. Absence of vandalism.
Fares relative to average incomes.
Fare prices, structure, Fares relative to other travel mode costs.
Price and payment options, ease Payment options (cash, credit cards, etc.).
affordability of purchase. Ticket availability (stations, stores, Internet, etc.).
Ease of transferring Quality of connections between transit routes.
between transit and Quality of connections between transit and other modes (train stations,
Integration other modes. airports, ferry terminals, etc.).
Seating availability and quality.
Space (lack of crowding).
Quiet (lack of excessive noise).
Air quality (lack of unpleasant smells) and temperature.
Cleanliness.
Comfort Passenger comfort Washrooms and refreshments (for longer trips).
Ease of reaching Distance from transit stations and stops to destinations.
Accessibility stations and stops. Walkability (quality of walking conditions) in areas serviced by transit.
Baggage Accommodation of Ability, ease and cost of carrying baggage, including special items such as
capacity baggage. pets.
Universal Accommodation of Accessible design for transit vehicles, stations and nearby areas.
design diverse users & needs. Ability to carry baggage.
Availability and accuracy of route, schedule and fare information.
Real-time transit vehicle arrival information.
User Ease of obtaining user Availability of Information for people with special needs (disabilities, limited
information information. language and reading ability, etc.).
How passengers are treated by transit staff.
Courtesy and Courtesy with which Ease of filing complaints.
responsiveness passengers are treated. Speed and responsiveness with which complaints are treated.
The attractiveness of Attractiveness of vehicles and facilities.
Attractiveness transit facilities. Attractiveness of documents and websites.
Effectiveness of efforts Popularity of promotion programs.
to encourage public Effectiveness at raising the social status of transit travel.
Marketing transport. Increases in public transit ridership in response to marketing efforts.
This table summarizes factors that can be considered when evaluating public transit services.
11Multi-Modal Transportation Planning
Victoria Transport Policy Institute
Automobile Dependency and Multi-Modalism
Automobile dependency refers to transportation and land use patterns that favor automobile
travel and provide relatively inferior alternatives. Its opposite, multi-modalism, refers to a
transport system that offers users diverse transport options that are effectively integrated, in
order to provide a high degree of accessibility even for non-drivers. Table 9 compares
automobile dependency and multi-modal transport systems.
Table 9 Auto Dependency and Multi-Modal Transportation Compared
Factor Automobile Dependency Multi-modal Transportation
Motor vehicle Medium per capita motor vehicle
ownership High per capita motor vehicle ownership. ownership.
Vehicle travel High per capita motor vehicle mileage. Medium to low vehicle mileage.
Land use density Low. Common destinations are dispersed. Medium. Destinations are clustered
Land use mix Single-use development patterns. More mixed-use development.
Land for transport Large amounts of land devoted to roads Medium amounts devoted to roads
and parking. and parking.
Road design Emphasizes automobile traffic. Supports multiple modes and users.
Street scale Large scale streets and blocks. Small to medium streets and blocks.
Traffic speeds Maximum traffic speeds. Lower traffic speeds.
Walking Mainly in private malls. Mainly on public streets.
Signage Large scale, for high speed traffic. Medium scale, for lower-speed
traffic.
Parking Generous supply, free. Moderate supply, some pricing.
Site design Parking paramount, in front of buildings. Parking sometimes behind buildings.
Planning Practices Non-drivers are a small minority with little Planning places are high value on
political influence. modal diversity.
Social expectations Non-drivers are stigmatized and their Non-drivers are not stigmatized and
needs given little consideration. their needs are considered.
This table compares automobile dependency and multi-modal transport systems.
Automobile dependency is a matter of degree. Few places are totally automobile dependent
(that is, driving is the only form of transport). Many relatively automobile dependent areas often
have significant amounts of walking, cycling, and transit travel among certain groups or
i ai E e ca f ee a ea all ha e ea bile a el b emergency, delivery and
service vehicles.
Automobile dependency has many impacts. It increases total mobility (per capita travel), vehicle
traffic, and associated costs. It makes non-drivers economically and socially disadvantaged, since
they have higher financial and time costs or less ability to access activities. This tends to reduce
opportunities, for example, for education, employment and recreation. In an automobile
dependent community virtually every adult is expected to have a personal automobile (as
opposed to a household automobile shared by multiple drivers), non-drivers require frequent
chauffeuring, and it is difficult to withdraw driving privileges from unfit people since alternatives
are inferior. Automobile dependency reduces the range of solutions that can be used to address
problems such as traffic congestion, road and parking facility costs, crashes, and pollution.
12Multi-Modal Transportation Planning
Victoria Transport Policy Institute
Summary of Factors Affecting Accessibility
The table below lists factors that affect accessibility and the degree to which they are
considered in current transport planning. Multi-modal transportation planning requires
consideration of all of these factors.
Table 10 Summary of Factors Affecting Accessibility (Litman 2006)
Name Description Current Consideration
Motorized travel demand is well studied,
The amount of mobility and access that people but nonmotorized demand is not. Travel
Transport and businesses would choose under various demand is often considered exogenous
Demand conditions (times, prices, levels of service, etc). rather than affected by planning decisions.
The distance and speed of travel, including Conventional transport planning primarily
personal mobility (measured as person-miles) evaluates mobility, particularly vehicle
Mobility and vehicle mobility (measured as vehicle-miles). mobility.
The quantity and quality of access options, Motor vehicle options and quality are
including walking, cycling, ridesharing, transit, usually considered, using indicators such
taxi, delivery services, and telecommunications. as roadway level-of-service, but other
Qualitative factors include availability, speed, modes lack such indicators and some
Transportation frequency, convenience, comfort, safety, price important service quality factors are often
Options and prestige. overlooked.
The quality (convenience and reliability) of Frequently considered when dealing with
User information available to users on their mobility a particular mode or location, but often
information and accessibility options. not comprehensive.
The degree of integration among transport Automobile transport is generally well
system links and modes, including terminals and integrated, but connections between
Integration parking facilities. other modes are often poorly evaluated.
The cost to users of transport and location Automobile operating costs and transit
Affordability options relative to incomes. fares are usually considered.
Mobility The quality of telecommunications and delivery Not usually considered in transport
Substitutes services that substitute for physical travel. planning.
Land Use Degree that factors such as land use density and Considered in land use planning, but less
Factors mix affect accessibility. in transport planning.
Transport The density of connections between roads and Conventional planning seldom considers
Network paths, and therefore the directness by which the effects of roadway connectivity on
Connectivity people can travel between destinations. accessibility.
Roadway Design
and How road design and management practices Some factors are generally considered, but
Management affect vehicle traffic, mobility and accessibility. others are not.
Various strategies that increase transport Often overlooked or undervalued in
Prioritization system efficiency. conventional planning.
The value of inaccessibility and external costs of Not generally considered in transport
Inaccessibility increased mobility. planning.
This table indicates factors that affect accessibility and whether they are currently considered in planning.
13Multi-Modal Transportation Planning
Victoria Transport Policy Institute
Transportation for Everyone Ratings
As previously discussed, a transportation system must be diverse in order to serve diverse travel
demands. No single travel option is sufficient; walking, bicycling, public transit and automobiles
all play important roles in an efficient and equitable transport system. Since land use factors
affect accessibility, multimodal planning must also consider development density and mix.
Table 11 summarizes the Transportation for Everyone rating system, which evaluates
multimodalism in an area, and helps identify potential gaps and improvement options.
Table 11 Transportation for Everyone Rating (Litman 2017)
Accessibility Factors Rating (1-10)
1. All-weather (paved) roads, and reliable motor vehicle fuel supplies.
2. Compact, mixed urban development, which creates Transit-Oriented Development (if
located around major transit stations) or Urban Villages (if pedestrian oriented), where
most common services (shops, restaurants, schools, parks, transit stops, etc.) can be
reached within a 5-10 minute walk or bicycle ride of most homes and worksites.
3. Good walking and cycling conditions, including adequate sidewalks, crosswalks, paths,
bike lanes, bike parking, and vehicle traffic speed control.
4. High quality public transit services, with good coverage, frequency, comfort, safety and
affordability for both local and interregional (between city) services.
5. Good connectivity, including dense walking and road networks, and intermodal
connections such as walking and cycling access, and taxi services at transit stations.
6. Convenient and affordable carsharing and bikesharing, taxi and ride-hailing services
(e.g., Uber and Lyft).
7. Universal design (transportation systems and services accommodate people with
diverse needs and abilities, including those with disabilities and heavy loads).
8. Good telework options, such as on-line shopping, banking and municipal services, and
efficient delivery services ((mail, courier and local shops).
9. Convenient user information concerning transportation options.
10. Social marketing that promotes non-automobile modes and enhances their status.
Each factor can be rated from 0 (worst) to 10 (best).
This rating system recognizes the integrated nature of multimodalism. For example, most public
transit trips including walking links, so walkability affects public transit service quality, and since
land use factors such as density and mix affect the destinations that pedestrians can reach,
these also affect public transit accessibility. As a result, walkability improvements and Smart
Growth land use policies are often an important way to improve public transit service quality
and increase transit ridership, and pedestrian and public transit improvements can have
synergistic effects; implemented together their impacts are larger than the sum of their
individual impacts.
14Multi-Modal Transportation Planning
Victoria Transport Policy Institute
Examples and Case Studies
The report, In eg a ing A alia T an S em A S a eg F An Efficien T an
Future (Booz Allen 2012) describes cities with integrated transport planning:
London
L d e all blic a e k i characterised by a well-established rail network
complemented by an extensive bus network and a ferry network. These networks are integrated
by multi-modal stations designed for ease of interchange for high volumes of passengers. At
major stations, purpose built bus interchanges have been developed to be within walking
distance of the railway and underground stations, often manned by bus station staff and
furbished with real time information systems (e.g. Countdown which shows the number of
minutes until the next bus is due to arrive).
Hong Kong
Hong Kong public transport services include railways, trams, buses, minibuses, taxis and ferries.
This results in very high public transit mode share (90%) and very low vehicle ownership rates
(50 vehicles per 1000 population). Hong Kong transport services are provided by several
operators.
Singapore
Singapore is considered an international leader in integrated multi-modal transport planning. It
e abli hed he ld fi a ea lice i g a d elec ic ad ici g systems, and uses a quota
system to limit vehicle ownership. The government makes continued investments in transport
infrastructure.
Table 12 Examples of Integrated Transport Services (Booz Allen 2012)
Type London Hong Kong Singapore
Extensive network of modes
(walking, cycling, taxi, bus, Well-designed intermodal
rail, ferry and airports) with stations integrated into Transit stations are designed to
well-designed stations and neighborhoods. integrate multiple modes and
Physical terminals local development
Oyster card introduced in Octopus Card introduced in EZ Card usable on all public
2003, can be used for most 1997 useable on most transport modes, parking, and
Fare urban transport services. transport services. small retail purchases.
TransitLink Guide and extensive
signage provide comprehensive
London has led the way in information on all aspects of
Information public transport signage. Good signage travelling.
TransLink multi-modal agency
The City of London manages Single governing authority established in 1989. Provides
all aspects of transport helps to implement strategic planning and
Institutional planning and operations. integration integrated services.
Leading cities are developing integrated, multi-modal transport systems.
15Multi-Modal Transportation Planning
Victoria Transport Policy Institute
Best Practices
The following are recommendations for multi-modal transportation planning:
Multi-modal transportation planning should have integrated institutions, networks,
stations, user information, and fare payment systems.
Consider a variety of transportation improvement options, including improvements to
various modes, and mobility management strategies such as pricing reforms and smart
growth land use policies. Consider various combinations of these options, such as public
transport improvements plus supportive mobility management strategies.
Consider all significant impacts, including long-term, indirect and non-market impacts such
as equity and land use changes. This should at least include:
Congestion Energy consumption
Roadway costs Pollution emissions
Parking costs Equity impacts
Consumer costs Physical fitness and health
Traffic accidents Land use development impacts
Quality of access for non-drivers Community livability
Impacts that cannot be quantified and monetized (measured in monetary values) should
be described.
Multi-modal comparisons should be comprehensive and marginal, and should account for
factors such as transit system economies of scale and scope.
Special consideration should be given to transport system connectivity, particularly
connections between modes, such as the quality of pedestrian and cycling access to transit
stops and stations.
Special consideration should be given to the quality of mobility options available to people
who are physically or economically disadvantaged, taking into account universal design
(the ability of transport systems to accommodate people with special needs such as
wheelchair users and people with wheeled luggage) and affordability.
Indicate impacts with regard to strategic objectives, such as long-range land use and
economic development.
Use comprehensive transportation models that consider multiple modes, generated traffic
impacts (the additional vehicle traffic caused by expansion of congested roadways), and
the effects of various mobility management strategies such as price changes, public transit
service quality improvements and land use changes.
People involved in transportation decision-making (public officials, planning professionals
and community members) should live without using a personal automobile for at least two
typical weeks each year that involve normal travel activities (commuting, shopping, social
events, etc.) in order to experience the non-automobile transportation system.
16Multi-Modal Transportation Planning
Victoria Transport Policy Institute
References and Information Resources
Booz Allen (2012), In eg a ing A alia T an S em A S a eg F An Efficien
Transport Future, Infrastructure Partnership Australia (www.infrastructure.org.au); at
www.infrastructure.org.au/DisplayFile.aspx?FileID=812.
Ralph Buehler and Andrea Hamre (2016), An Examination of Recent Trends in Multimodal
Travel Behavior Among American Motorists, International Journal of Sustainable
Transportation, Vo. 10, No. 4, pp. 354 364 (http://dx.doi.org/10.1080/15568318.2014.945672).
CALTRANS (2008), Planning Frequently Asked Questions, California Department of
Transportation (www.dot.ca.gov/hq/tpp/index.html); at www.dot.ca.gov/hq/tpp/faqs.html.
CALTRANS (2002), Guide For Preparation of Traffic Impact Studies, California DOT (www.dot.ca.gov); at
www.dot.ca.gov/hq/traffops/developserv/operationalsystems/reports/tisguide.pdf.
Cambridge Systematics (2009), Performance Measurement Framework for Highway Capacity
Decision Making, Report S2-C02-RR, Strategic Highway Research Program, TRB (www.trb.org); at
http://onlinepubs.trb.org/onlinepubs/shrp2/shrp2_S2-C02-RR.pdf.
R be Ce e a d G B A i g Vehicle Trip Reduction Impacts of Transit-Oriented
H i g Journal of Public Transportation, Vol. 11/3, pp. 1-17; at
www.nctr.usf.edu/jpt/pdf/JPT11-3.pdf.
Susan Chapman and Doug Weir (2008), Accessibility Planning Methods, Research Report 363,
New Zealand Transportation Agency (www.landtransport.govt.nz/research/reports/363.pdf).
Chris Comeau (2010), Moving Beyond the Automobile: Multi-modal Transportation Planning in
Bellingham, Washington, American Planning Association (www.planning.org); at
www.cob.org/documents/pw/transportation/practicing-planner-case-study.pdf.
DfT (2009), NATA (New Approach for Transport Appraisal) Refresh: Appraisal for a Sustainable
Transport System, UK Department for Transport (www.dft.gov.uk); at
www.dft.gov.uk/pgr/economics/integratedtransporteconomics3026.
Frederick C. Dock, Ellen G ee be g a d Ma k Ya a e M l i dal a d C le e
Stree Pe f a ce Mea e i Pa ade a Calif ia ITE Journal (www.ite.org), Vol. 82/1, pp.
33-37; at www.ite.org/membersonly/itejournal/pdf/2012/JB12AA33.pdf.
Richard Dowling, et al. (2008), Multimodal Level Of Service Analysis For Urban Streets, NCHRP
Report 616, TRB (www.trb.org); at http://trb.org/news/blurb_detail.asp?id=9470.
ECONorthwest and PBQD (1995), Least-Cost Planning: Principles, Applications and Issues, FHWA
(www.fhwa.dot.gov/environment); at www.vtpi.org/LCPpaper.pdf.
EMBARQ (2012), Evaluate, Enable, Engage: Principles to Support Effective Decision Making in
Mass Transit Investment Programs, EMBARQ (www.embarq.org); at https://bit.ly/2Z6A7Dd.
17Multi-Modal Transportation Planning
Victoria Transport Policy Institute
FDOT (2002), Quality/Level of Service Handbook, Florida Department of Transportation
(www.dot.state.fl.us); at www.dot.state.fl.us/planning/systems/sm/los.
FHWA and FTA (2007), The Transportation Planning Process Key Issues: A Briefing Book for
Transportation Decisionmakers, Officials, and Staff, FHWA-HEP-07-039, FHWA and FTA
(www.planning.dot.gov); at www.planning.dot.gov/documents/briefingbook/bbook.htm.
Ma i G e la a d Sele a Re ld Mea i g M l i dal M bili i h he
Highway Capacity Manual 2010 and o he Ne A al i T l TR News 280, Transportation
Research Board (www.trb.org); at https://bit.ly/37YicCC.
Jessica Y. Guo and Sasanka Ganda a a A Ec ic E al a i Of Heal h-Promotive
B il E i e Cha ge Preventive Medicine, Vol. 50, Supplement 1, January, pp. S44-S49;
at www.activelivingresearch.org/resourcesearch/journalspecialissues.
Chris A. Hale (2011), New Approaches To Strategic Urban Transport Assessment, Australian
Planner, Vol. 48/3, 173-182; abstract at http://dx.doi.org/10.1080/07293682.2011.592505.
Susan Handy (2020), What California Gains from Reducing Car Dependence, National Center for
Sustainable Transportation (https://ncst.ucdavis.edu); at https://bit.ly/2Z8NvGO.
T dd Li a Ge e a ed T affic I lica i f Ta Pla i g ITE Journal, Vol.
71, No. 4, (www.ite.org), April, pp. 38-47; at www.vtpi.org/gentraf.pdf.
Todd Litman (2006), Evaluating Accessibility for Transportation Planning, Victoria Transport
Policy Institute (www.vtpi.org); at www.vtpi.org/access.pdf.
Todd Litman (2007), Guide to Calculating Mobility Management Benefits, Victoria Transport
Policy Institute (www.vtpi.org); at www.vtpi.org/tdmben.pdf.
Todd Litman (2008), Comprehensive Transport Planning: Best Practices For Evaluating All
Options And Impacts, VTPI (www.vtpi.org); at www.vtpi.org/comprehensive.pdf.
Todd Litman (2009), Land Use Impacts on Transportation: How Land Use Factors Affect Travel
Behavior, VTPI (www.vtpi.org); at www.vtpi.org/landtravel.pdf.
Todd Litman (2012), Toward More Comprehensive and Multi-modal Transport Evaluation, VTPI
(www.vtpi.org); at www.vtpi.org/comp_evaluation.pdf.
Jeremy Mattson (2020), Measuring the Economic Benefits of Rural and Small Urban Transit
Services in Greater Minnesota, Upper Great Plains Transportation Institute North Dakota State
University; at www.dot.state.mn.us/research/reports/2020/202010.pdf.
J.S. Miller (2006), Multimodal Statewide Transportation Planning: A Survey of State Practices,
VTRC 06-R13, Virginia DOT (www.virginiadot.org); at https://bit.ly/2NpoeCP.
MWCG (2006), Transportation Models & Forecasts, Metropolitan Washington Council of
Governments (www.mwcog.org/transportation/activities/models).
18Multi-Modal Transportation Planning
Victoria Transport Policy Institute
Measuring Walking (www.measuring-walking.org) describes internationally standardised
monitoring methods of walking and public space.
NYDOT (2009), New York City Street Design Manual, New York Department of Transportation
(www.nyc.gov/html/dot) at www.nyc.gov/html/dot/html/about/streetdesignmanual.shtml.
PennDOT (2007), The Transportation and Land Use Toolkit, PUB 616 (3-07), Pennsylvania Dept.
of Transportation; at (ftp://ftp.dot.state.pa.us/public/PubsForms/Publications/PUB%20616.pdf).
PSRC (2008), Transportation 2040 (long-range transport plan) and Transportation Improvement
Program, Puget Sound Regional Council (http://psrc.org/projects/tip/index.htm).
Marc Schlossberg, Asha Weinstein Agrawal, Katja Irvin and Vanessa Louise Bekkouche (2008),
H Fa B Which R e and Why? Spatial Analysis of Pede ia P efe e ce Mi e a
Transportation Institute (www.transweb.sjsu.edu); at
http://transweb.sjsu.edu/mtiportal/research/publications/documents/06-06/MTI-06-06.pdf.
Sam Swartz (2012), Steps to a Walkable Community: A Guide for Citizens, Planners, and
Engineers, America Walks (www.americawalks.org/walksteps).
B ad S ade Pe f a ce Me ic f Pla P jec a d Pla e ITE Journal
(www.ite.org), Vol. 82/1, pp. 31-32.
Transportation for Communities - Advancing Projects through Partnerships
(www.transportationforcommunities.com) is an integrated website that provides guidance for
transport planning and investment decisions, particularly within the U.S. transportation
development system.
TRB (2010), Highway Capacity Manual, Transportation Research Board (www.trb.org); at
http://sjnavarro.files.wordpress.com/2008/08/highway_capacital_manual.pdf.
Kristine M. Williams, Tia Claridge and Alexandria Carroll (2016), Multimodal Transportation
Planning Curriculum for Urban Planning Programs, Transportation Research and Education
Center (TREC); at
http://pdxscholar.library.pdx.edu/cgi/viewcontent.cgi?article=1113&context=trec_reports.
WSDOT (2006), Washington State Transportation Plan, Washington State Department of
Transportation (www.wsdot.wa.gov/planning/wtp).
Rhonda Young, Jennifer Barnes, G. Scott Rutherford (2002), Multimodal Investment Choice
Analysis; Volume I: Phase I, Washington State Transportation Center (TRAC); funded by the U.S.
Federal Highway Administration.
www.vtpi.org/multimodal_planning.pdf
19You can also read