A Deep Neural Network for Estimating Low-Density Lipoprotein Cholesterol From Electronic Health Records: Real-Time Routine Clinical Application ...
←
→
Page content transcription
If your browser does not render page correctly, please read the page content below
JMIR MEDICAL INFORMATICS                                                                                                                  Hwang et al

     Original Paper

     A Deep Neural Network for Estimating Low-Density Lipoprotein
     Cholesterol From Electronic Health Records: Real-Time Routine
     Clinical Application

     Sangwon Hwang1, PhD; Chanwoo Gwon2, MS; Dong Min Seo3, BS; Jooyoung Cho4, MD, PhD; Jang-Young Kim5,
     MD, PhD; Young Uh4, MD, PhD
     1
      Artificial Intelligence Bigdata Medical Center, Yonsei University Wonju College of Medicine, Wonju, Republic of Korea
     2
      Wonju Industry-Academic Cooperation Foundation, Yonsei University Mirae Campus, Wonju, Republic of Korea
     3
      Department of Medical Information, Yonsei University Wonju College of Medicine, Wonju, Republic of Korea
     4
      Department of Laboratory Medicine, Yonsei University Wonju College of Medicine, Wonju, Republic of Korea
     5
      Department of Internal Medicine, Yonsei University Wonju College of Medicine, Wonju, Republic of Korea

     Corresponding Author:
     Young Uh, MD, PhD
     Department of Laboratory Medicine
     Yonsei University Wonju College of Medicine
     20, Ilsan- ro, Wonju, Gangwon-do
     Wonju, 26426
     Republic of Korea
     Phone: 82 33 741 1592
     Fax: 82 33 731 0506
     Email: u931018@yonsei.ac.kr

     Abstract
     Background: Previously, we constructed a deep neural network (DNN) model to estimate low-density lipoprotein cholesterol
     (LDL-C).
     Objective: To routinely provide estimated LDL-C levels, we applied the aforementioned DNN model to an electronic health
     record (EHR) system in real time (deep LDL-EHR).
     Methods: The Korea National Health and Nutrition Examination Survey and the Wonju Severance Christian Hospital (WSCH)
     datasets were used as training and testing datasets, respectively. We measured our proposed model’s performance by using 5
     indices, including bias, root mean-square error, P10-P30, concordance, and correlation coefficient. For transfer learning (TL),
     we pretrained the DNN model using a training dataset and fine-tuned it using 30% of the testing dataset.
     Results: Based on 5 accuracy criteria, deep LDL-EHR generated inaccurate results compared with other methods for LDL-C
     estimation. By comparing the training and testing datasets, we found an overfitting problem. We then revised the DNN model
     using the TL algorithms and randomly selected subdata from the WSCH dataset. Therefore, the revised model (DNN+TL)
     exhibited the best performance among all methods.
     Conclusions: Our DNN+TL is expected to be suitable for routine real-time clinical application for LDL-C estimation in a
     clinical laboratory.

     (JMIR Med Inform 2021;9(8):e29331) doi: 10.2196/29331

     KEYWORDS
     low-density lipoprotein cholesterol; deep neural network; transfer learning; real-time clinical application

                                                                               reference measurement procedure for LDL-C is
     Introduction                                                              ultracentrifugation [2]. However, owing to the difficulty in
     Low-density lipoprotein cholesterol (LDL-C) is a major marker             applying this in a clinical setting, LDL-C levels have mostly
     of cardiovascular disease (CVD) because of its role in the                been estimated by other means [3-6].
     pathophysiology of atherosclerosis [1]. The contemporary
     https://medinform.jmir.org/2021/8/e29331                                                              JMIR Med Inform 2021 | vol. 9 | iss. 8 | e29331 | p. 1
                                                                                                                     (page number not for citation purposes)
XSL• FO
RenderX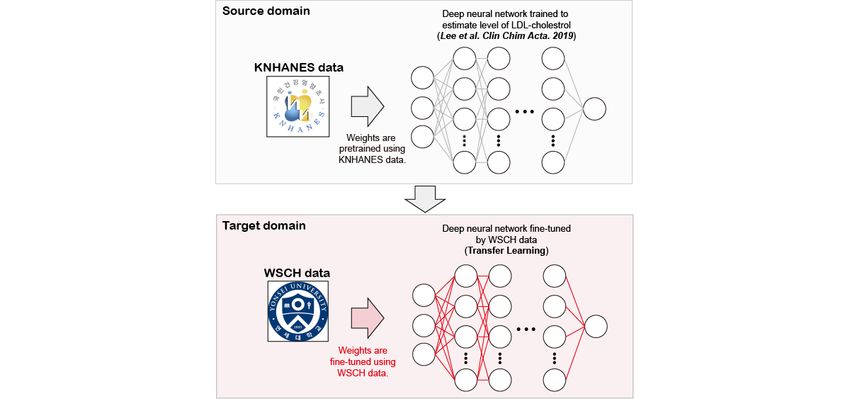
JMIR MEDICAL INFORMATICS                                                                                                            Hwang et al

     Friedewald et al [3] observed that most plasma samples are          application server is present, it is easy to apply and upgrade
     comprised of chylomicrons and that most triglycerides (TGs)         without rebuilding the system.
     in plasma are present in very low-density lipoprotein cholesterol
                                                                         Transfer learning (TL) is a method of transferring knowledge
     (VLDL-C) at a ratio of 5:1, while the chylomicrons are
                                                                         from a previously trained task to a new but related one [10]. In
     undetectable. This observation led to the 1972 Friedewald (FW)
                                                                         a clinical setting, it is enormously difficult to collect real patient
     equation, which is used to estimate LDL-C [3]. Martin et al [4]
                                                                         data and preprocess them to analyzable forms (structured data).
     showed in 2014 that VLDL-C levels estimated by simply
                                                                         Moreover, for these analyses, a great deal of effort is needed to
     dividing the TG level by 5 may inaccurately predict LDL-C
                                                                         resolve ethical issues and receive board approval for data
     levels, specifically in hypertriglyceridemia. They divided
                                                                         collection. The difficulty of preparing an analyzable dataset
     subjects according to the levels of TG and non–high-density
                                                                         presents an enormous obstacle for training because it typically
     lipoprotein cholesterol (non-HDL-C), yielding 180 groups
                                                                         requires an enormous dataset to train numerous perceptrons [7].
     (clusters) [4]. For those, 180 equations were established and
                                                                         However, TL adopts a pretrained model learned from publicly
     integrated into the novel estimation method. More recently,
                                                                         available or large-scale datasets. Hence, it is considered to be
     Sampson et al [5] used the interaction between TG and
                                                                         a powerful method when it comes to small-scale dataset training
     non-HDL-C and a correction factor (TG2) to estimate LDL-C,          requirements.
     resulting in the National Institutes of Health (NIH) method.
                                                                         Over the past decade, enormous volumes of medical data have
     Deep learning techniques, specifically deep neural networks         been stored in electronic health records (EHRs) (ie, electronic
     (DNNs), provide multilayer stacks of simple networks (eg,           medical records [EMRs]) from which many studies have
     perceptrons or modules) with nonlinear functions applied            compiled patient information for secondary use for health care
     between each layer [7]. The numerous perceptrons and the            tasks and medical decisions (eg, disease prediction). Shickel et
     nonlinearity between them allow researchers to represent            al [11] reviewed the current research that applied deep learning
     complex real data in a way that solves a variety of challenging     to EHRs. Although there have been many studies that
     tasks such as classification and regression. We previously          constructed models using data obtained from EHR data, very
     established a deep learning model to estimate LDL-C, including      few were found to have performed real-time clinical applications
     180 perceptrons [6], motivated by the model of Martin et al [4].    of the established model [12]. This study aimed to remedy this
     This yielded accurate results for LDL-C estimation.                 by applying previously constructed models to an EHR system.
     Additionally, DNNs are easy to apply in clinical settings and       Hence, we performed the following 3 tasks for this study. First,
     hospital databases. Several studies have adopted linear             we applied the DNN model from Lee et al [6] to the Wonju
     regression to estimate LDL-C using fewer than 5 trained weights     Severance Christian Hospital (WSCH) EHR system to generate
     (parameters) [8,9]. With such a low number, it is possible to       real-time results for estimated LDL-C (deep LDL-EHR; Figure
     adapt the linear model–based LDL estimator to a hospital            1). Second, we measured performance based on several accuracy
     database without having to rebuild the system. With the DNN         indices for the estimated LDL-C levels provided by the real-time
     proposed by Lee et al [6], approximately 4600 trained weights       application of our DNN model (deep LDL-EHR) and compared
     were established as a matrix. Although it had many weights, it      them to those of other LDL estimation methods. Third, we
     was applicable to clinical settings and hospital databases using    revised the DNN model by using TL, a multitask learning
     matrix calculation. Moreover, if the independent DNN                algorithm (Figure 2).

     https://medinform.jmir.org/2021/8/e29331                                                        JMIR Med Inform 2021 | vol. 9 | iss. 8 | e29331 | p. 2
                                                                                                               (page number not for citation purposes)
XSL• FO
RenderX
JMIR MEDICAL INFORMATICS Hwang et al
Figure 1. Overall workflow of deep LDL-EHR: Steps 3, 7, and 8 provide input- or output-value transfers between 2 platforms; the (Tomcat)a web
server was established using Apache Tomcat [13] on a JAVA server page and servlet application; the (Flask)b web server was established using the
Flask framework [14], a lightweight web application framework based on TensorFlow and Keras in Python. DNN: deep neural network; EMR: electronic
medical record; HDL-C: high-density lipoprotein cholesterol; LDL-C: low-density lipoprotein cholesterol; TC: total cholesterol; TG: triglyceride.
https://medinform.jmir.org/2021/8/e29331 JMIR Med Inform 2021 | vol. 9 | iss. 8 | e29331 | p. 3
(page number not for citation purposes)
XSL• FO
RenderXJMIR MEDICAL INFORMATICS Hwang et al
Figure 2. Transfer learning: For the task in the source domain, the deep neural network (DNN) model has the same structure and data as those previously
trained by Lee et al [6], while ours is trained and saved on the DNN application server. For the task in the target domain, the DNN model saved in the
DNN application server is loaded and retrained (fine-tuned) using Wonju Severance Christian Hospital (WSCH) data (30% randomly selected subjects)
on a local computer. KNHANES: Korea National Health and Nutrition Examination Survey; LDL: low-density lipoprotein.
receives data from the EMR system and transfers estimated
Methods LDL-C values back to the EMR system. It is also comprised of
Application of Our DNN Model in a Clinical an application that calculates LDL-C values using the data
received from the EMR system, a TensorFlow [18] framework
Laboratory
that provides various Python application programming interfaces
Experts in various fields (ie, clinical pathologists, database (APIs) that execute high-performance DNN analysis, a Keras
administrators, cardiologists, and computer scientists) have [19] neural network library installed atop a Microsoft cognitive
collaborated to construct a deep LDL-EHR model that we are toolkit, TensorFlow, and Theano, which provides high-level
using to provide LDL-C estimations for hospital patients. The easy-to-use APIs for creating neural networks. Although the 2
application of our DNN model (ie, the deep LDL-EHR) in a libraries are technically separate, TensorFlow and Keras are
clinical laboratory consists of 2 main subsystems: the EMR and typically used in a unified manner.
a DNN application server. The EMR system is responsible for
receiving and storing patient medical data (eg, levels of total Note that the optimization of weights or parameters is performed
cholesterol [TC], HDL-C, and TG) and transferring them to the on a local computer and is saved in the form of a matrix; the
DNN application server. The following core components are DNN application server processes only the matrix operations
part of the EMR system: a user interface that receives data from using previously trained weights in the local computer.
users and stores them in the EMR database; a web server that Data Collection
hosts the application that permits users to see laboratory results
From July 2020 to December 2020, we obtained 11,125
and estimates via a web browser; a database that stores all data,
estimated LDL results from a real-time system. Because these
including laboratory markers (input data) and results estimated
results were obtained from inpatients and outpatients from all
by deep learning; and a physical server that runs these software
departments (eg, cardiology, gastroenterology, endocrinology,
components. The web service was developed using JAVA Server
oncology, and health check-up centers) in real time, we could
Pages (JSP) and a servlet application [15], and the user interface
not trace whether examinations were performed before or after
is based on the hypertext markup language, cascade style sheets,
fasting. The TC, TG, HDL-C, and LDL-C data were analyzed
and JavaScript [16]. The web server was established in Apache
using the modular Diagnostic de Performance Énergétique
Tomcat [13] based on JSP and servlets. We used a Sybase
system (Roche Diagnostics, Basel, Switzerland).
relational database management system for its construction [17].
We collected 2009-2015 Korea National Health and Nutrition
The DNN application server hosts the DNN application, which
Examination Survey (KNHANES) datasets to replicate the DNN
is built upon a Python environment running separately from the
model of Lee et al [6] Note that results in Multimedia Appendix
EMR system. It is responsible for performing the estimation of
1 refer to the DNN model of Lee et al [6], and those in Figure 4
LDL-C values based on the received data (TC, HDL-C, TG)
refer to the replicated DNN model. Subjects missing TC,
from the EMR system and for transferring the estimated values
HDL-C, TG, and LDL-C data were excluded. Therefore, data
of LDL-C back to the EMR system (Figure 1). This application
for 15,074 subjects were analyzed for this study, nearly the same
server is comprised of several core components, including a
as the number used in the previous study [6]. All participants
flask-based web server [14] built using the flask framework (ie,
were tested for lipid profiles after at least 12 hours of fasting.
a lightweight web application framework on Python), which
https://medinform.jmir.org/2021/8/e29331 JMIR Med Inform 2021 | vol. 9 | iss. 8 | e29331 | p. 4
(page number not for citation purposes)
XSL• FO
RenderXJMIR MEDICAL INFORMATICS Hwang et al
Lipid profiles (ie, TC, HDL-C, TG, and LDL-C) were measured
using the Hitachi 7600 analyzer (Hitachi, Tokyo, Japan).
Other LDL-C Estimation Methods
In studies that provided the estimation method for LDL-C [4,5],
There have been numerous studies on the estimation of LDL-C, concordance has been used to examine the classification
and they largely used linear regression methods [20,21]. Among accuracy between mLDL-C and eLDL-C. In detail, both
them, we empirically selected some representative methods, mLDL-C and eLDL-C values are categorized as 6 subgroups
including FW, Novel, and NIH methods [3-5]. The FW method based on the National Cholesterol Education Program (NCEP)
estimates LDL-C by subtracting levels of HDL-C and TG/5 Adult Treatment III guideline cutoffs that other studies used
from TC. The Novel method integrates clustering and linear [24,25]. Concordance was measured as follows:
regression, initially arranging a sample into one of 180
subgroups previously determined by TG and non-HDL-C levels.
Afterward, a case of 180 linear regression equations is applied
to the sample. The NIH method uses TC, HDL-C, TG, and their where A are samples with mLDL-C within a specific range and
combinations, including the square of TG (TG2) and a B are samples with eLDL-C in the same interval as mLDL-C.
multiplication value between TG and non-HDL-C. The source
Several methods of correlation have been used to measure the
code for these equations is available at our GitHub homepage
degree of consistency between true and estimated values (ie,
[22].
mLDL-C and eLDL-C) [5,23]. Specifically, we used Pearson
DNN and TL correlation coefficient, a normalized measurement of the
The DNN model included 6 hidden layers with 30 hidden nodes covariance of 2 lists of values (ie, mLDL-C and eLDL-C)
in each. We used a rectified linear unit as an activation function divided by the product of their standard deviation.
to implement nonlinearity between the hidden layers. The details Jacob and Speed [26] suggested that the selected features and
of this model are described in the study by Lee et al [6]. their predictive performances should be examined based on a
We used TL [10] to upgrade this DNN model [6]. TL includes random sampling perspective for generalization. In other words,
a source domain that is typically a large-scale dataset alongside the samples selected for the training model (ie, DNN+TL)
a small-scale target domain that contains more specific data greatly affect its performance. Therefore, we performed the
compared with those of the source domain [10]. As described following tasks considering the random sampling perspective.
in Figure 2, from the source task (ie, KNHANES dataset), we In step 1, we made a pair of random sample datasets, including
extracted the desired information (ie, trained weights). From training and testing, which were randomly divided at a ratio of
the target task (ie, subset of the WSCH dataset), we retrained 0.3 and 0.7, respectively. In step 2, we established a DNN+TL
(fine-tuned) the DNN. The source code for the DNN+TL is model using the randomly selected training set and measured
available at our GitHub homepage [22]. the t value and RMSE of the DNN+TL model for the testing
set. We also measured the t value and RMSE of other models
Performance Measurement (ie, FW, Novel, NIH, and DNN) for the testing set. In step 3,
To assess and compare the accuracy of each LDL-C estimation we iterated Steps 1 to 2 at 1000 times, and 2 matrices consisting
method, we measured the following 5 indices: bias (estimated of 5 columns (5 LDL-C estimation methods) and 1000 rows (#
LDL-C [eLDL-C] – measured LDL-C [mLDL-C]), root mean of iterations) were generated, including the t value and RMSE.
square error (RMSE), P10 to P30, concordance, and correlation We compared 2 indices (ie, t value and RMSE) among the 5
coefficient. methods based on one-way analysis of variance and performed
multiple comparisons using the Bonferroni post hoc test.
Jeong et al [23] implemented the one-sample t test to compare
the average bias between true and estimated values from a Variance Importance
regression task. Motivated by this, we used the one-sample t We implemented permutation importance [27] and Shapley
test to measure the degree of average bias of each estimation addictive explanations (SHAP) [28] to identify the contribution
method differing from zero. of each feature (ie, TC, HDL-C, and TL) to the final output of
Numerous studies have implemented RMSE to measure the the DNN model. Permutation importance is a heuristic method
degree of accuracy for LDL-C estimation methods [4-6,23]. used to measure normalized feature importance by measuring
Hence, we decided to use the RMSE for the estimation the decrease in a model’s performance when a feature is
accuracies of each method as follows. permuted [27]. SHAP is an addictive feature attribution method
used to determine feature importance by measuring a weighted
average value of all possible differences between 2 sets of
outputs that are resulted from models with and without the
P30 has been implemented to measure the clinical accuracy of feature [28]. The permutation importance was measured using
estimation methods for glomerular filtration rate [23]. This study the permutation_importance function in the sklearn package
used P10 and P30, and we expanded these indices as Pn (n = [29], and the SHAP was calculated using the DeepExplainer
10, 15, 20, 25, and 30), measured as the ratio of samples from function in the SHAP package [28].
which LDL-C was estimated using each method within mLDL-C
± n% divided by all samples.
https://medinform.jmir.org/2021/8/e29331 JMIR Med Inform 2021 | vol. 9 | iss. 8 | e29331 | p. 5
(page number not for citation purposes)
XSL• FO
RenderXJMIR MEDICAL INFORMATICS Hwang et al
Statistics most from zero. The eLDL-C levels using the DNN application
Statistical analyses were performed using the R programming system had, from among the 4 methods, the second most biased
language (v.3.6.4). For a comparison of continuous variables distribution from zero among the difference values between
based on 2 groups, we used the t test and the Mann Whitney U eLDL-C and mLDL-C (Multimedia Appendix 1). When
test. For categorical variables, we used the Chi-squared test, comparing the RMSE of each method, the FW method resulted
and a P value ofJMIR MEDICAL INFORMATICS Hwang et al
We compared the lipid profiles of the KNHANES dataset with this limitation, we adopted the TL method [10]. Using the
those of the WSCH dataset (Table 1). All 4 variables differed 2009-2015 KNHANES datasets, we trained the DNN model
significantly between the 2 datasets. We concluded that using the same structure and hyperparameters as those of the
differential characteristics between the training set (KNHANES) model proposed by Lee et al [6], yielding a pretrained DNN
and the testing set (WSCH) triggered inaccurate results from model. Next, we randomly selected 30% of the WSCH dataset,
the DNN application system. In other words, an overfitting which was used to fine-tune the pretrained DNN model (Figure
problem existed in the deep LDL-EHR model. To overcome 2).
Table 1. General characteristics of and comparisons between the Korea National Health and Nutrition Examination Survey (KNHANES) and Wonju
Severance Christian Hospital (WSCH) datasets.
Variable KNHANES (n=15,074) WSCH (n=11,125) P value
Age (years), mean (SD) 45.5 (18.2) 59.4 (15.5)JMIR MEDICAL INFORMATICS Hwang et al
previous DNN model [6] to represent the characteristics of the (Figure 6).
WSCH dataset by importantly considering the TG variable
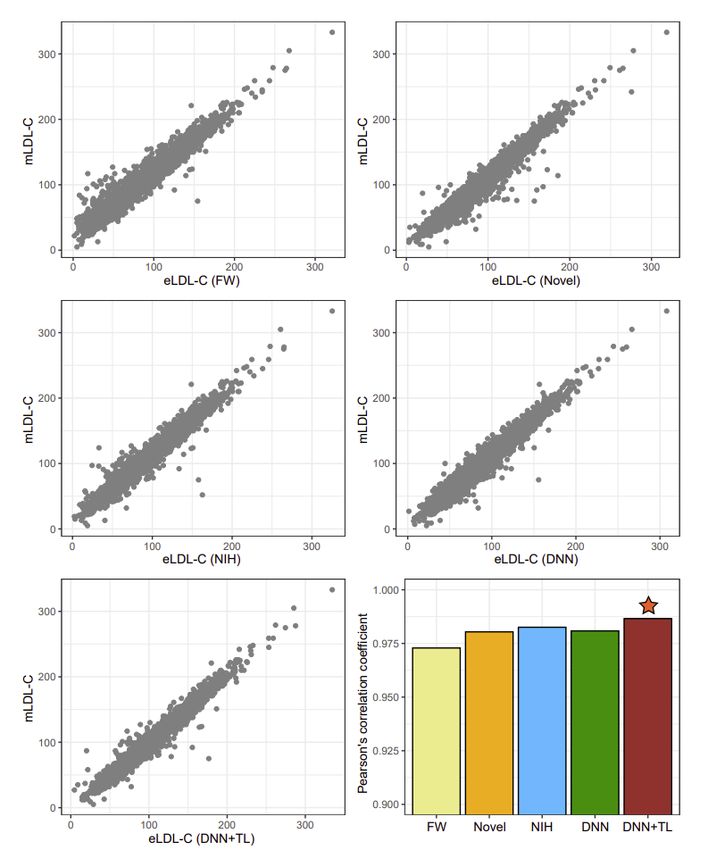
Figure 4. Correlation plots and coefficients between measured low-density lipoprotein cholesterol (mLDL-C) and estimated LDL-C (eLDL-C) calculated
by 5 methods. The points on the scatterplots indicate the individual samples. A star indicates the highest Pearson correlation coefficient. DNN: deep
neural network; FW: Friedewald method; NIH: National Institutes of Health; TF: transfer learning.
https://medinform.jmir.org/2021/8/e29331 JMIR Med Inform 2021 | vol. 9 | iss. 8 | e29331 | p. 8
(page number not for citation purposes)
XSL• FO
RenderXJMIR MEDICAL INFORMATICS Hwang et al
Figure 5. Comparison of performance based on a random sample perspective. A one-sample t test was used. DNN: deep neural network; FW: Friedewald
method; NIH: National Institutes of Health; TL: transfer learning.
Figure 6. Variance importance based on permutation importance and Shapley addictive explanations (SHAP). DNN: deep neural network; HDL-C:
high-density lipoprotein cholesterol; TC: total cholesterol; TG: triglyceride; TL: transfer learning.
data-specific characteristics. Therefore, the DNN+TL method
Discussion resulted in the most accurate results of all methods.
Principal Findings Approximately 15,000 subjects (KNHANES) were used to
We applied the DNN model for LDL-C estimation from EHR construct the DNN, and about 3300 WSCH LDL-C results were
(deep LDL-EMR) data to generate real-time results. However, used for fine-tuning it. Martin et al [4] assigned approximately
we found that our original deep LDL-EMR generated inaccurate 900,000 subjects to develop the Novel method. Meeusen et al
results compared with other LDL estimation methods. We [25] enrolled 23,055 individuals from the Mayo Clinic and
hypothesized that these inaccuracies may have been caused by externally validated the Novel method. In 2020, Sampson et al
the batch effect between the 2 different datasets. We therefore [5] used approximately 9000 LDL-C test results to develop the
adopted a TL method to fine-tune the DNN model using local NIH method while internally and externally validating it through
approximately 9000 LDL-C results and those of another 4
https://medinform.jmir.org/2021/8/e29331 JMIR Med Inform 2021 | vol. 9 | iss. 8 | e29331 | p. 9
(page number not for citation purposes)
XSL• FO
RenderXJMIR MEDICAL INFORMATICS Hwang et al
databases. Our DNN model was established using approximately NCEP requirements and proposed accurate LDL-C results with
18,000 LDL-C results obtained from 2 different institutions, a coefficient of variation less than 4% and a bias less than 4%.
and validation was established using approximately 77,000 Moreover, the homogenous method seems to have better
LDL-C results, which was comparable to the validation in other classified subjects into NCEP criteria than the FW method [30].
studies. The homogenous method does not require the preliminary
lipoprotein fractionation step (eg, ultracentrifugation). In other
In the study by Martin et al [4] (the Novel method), the median
words, it is easy to use and often provides improved precision;
TG distribution was 115 (IQR 82-166). Research by Meeusen
therefore, it has gained rapid acceptance worldwide [31].
et al [25] resulted in a median TG distribution of 131 (IQR
However, for high-risk CVD patients or groups, future studies
89-196). In a study by Sampson et al [5] (NIH method), the
should analyze both beta-quantifications and direct methods to
median TG distribution was 149 (IQR 98-253). Our derivation
provide more accurate and generalized estimates for decreasing
dataset (KNHANES) had a median TG of 120 (IQR 76-211),
CVD-related mortality.
and our validation dataset had a median TG of 114 (IQR
83-163). Although data from the Novel method had a TG In future studies, we plan to update the trained weights in the
distribution more similar to our validation dataset than the TG LDL-EHR model with optimized parameters using TL. Another
distribution from the NIH method, the performances obtained study is needed to evaluate the performance of an updated
from these methods were almost identical. However, we found version of the LDL-EHR (DNN+TL) model for the newly
that our deep LDL-EHR model generated extremely accurate selected samples. Furthermore, as suggested by other studies
results for the derivation set and comparably inaccurate results [6,32], it is crucial to develop an LDL-C estimation method that
for the testing dataset. In other words, an overfitting problem considers demographic, medical, anthropometric, and laboratory
occurred in our deep LDL-EHR model. Therefore, we adopted phenotypes, such as age, obesity, chronic disease, and liver
a TL method to fine-tune (overall retainment with little change profiles.
in trained parameters) the deep LDL-EHR (DNN+TL) model,
yielding the best performance among all the methods.
Conclusion
We applied a real-time deep learning model to estimate LDL-C
Limitations and Future Work using EHR system data. However, we encountered several
The most important limitation of the present study is the unforeseen problems. When applying the DNN model to real
referenced homogenous method used to measure LDL-C. patients, our tool could not outperform the other LDL-C
Representative methods for estimating LDL-C [3-5] use the estimation methods (ie, Novel and NIH). We overcame this by
heterogeneous method of ultracentrifugation (eg, upgrading our DNN using a TL algorithm (DNN+TL), resulting
beta-quantification) [30,31]. Besides, we implemented the in superior LDL-C estimation performance compared with the
homogeneous precipitation-based (direct) method as the other methods. Our study suggests that the revised version of
reference for establishing an LDL-C regression model. Nauck our deep LDL-EHR (DNN+TL) may contribute to future
et al [30] suggested that the homogenous method satisfied the accurate estimations for LDL-C in real clinical settings.
Acknowledgments
This research was supported by a grant from the Korea Health Technology R&D Project through the Korea Health Industry
Development Institute, funded by the Ministry of Health & Welfare, Republic of Korea (grant number: HI19C1035).
Conflicts of Interest
None declared.
Multimedia Appendix 1
Performances of four LDL estimation methods.
[PDF File (Adobe PDF File), 369 KB-Multimedia Appendix 1]
Multimedia Appendix 2
The distribution of TG:VLDL-C in relation to TG.
[PDF File (Adobe PDF File), 288 KB-Multimedia Appendix 2]
References
1. Ference B, Ginsberg H, Graham I, Ray K, Packard C, Bruckert E, et al. Low-density lipoproteins cause atherosclerotic
cardiovascular disease. 1. Evidence from genetic, epidemiologic, and clinical studies. A consensus statement from the
European Atherosclerosis Society Consensus Panel. Eur Heart J 2017 Aug 21;38(32):2459-2472 [FREE Full text] [doi:
10.1093/eurheartj/ehx144] [Medline: 28444290]
https://medinform.jmir.org/2021/8/e29331 JMIR Med Inform 2021 | vol. 9 | iss. 8 | e29331 | p. 10
(page number not for citation purposes)
XSL• FO
RenderXJMIR MEDICAL INFORMATICS Hwang et al
2. Miller W, Myers G, Sakurabayashi I, Bachmann L, Caudill S, Dziekonski A, et al. Seven direct methods for measuring
HDL and LDL cholesterol compared with ultracentrifugation reference measurement procedures. Clin Chem 2010
Jun;56(6):977-986 [FREE Full text] [doi: 10.1373/clinchem.2009.142810] [Medline: 20378768]
3. Friedewald W, Levy R, Fredrickson DS. Estimation of the concentration of low-density lipoprotein cholesterol in plasma,
without use of the preparative ultracentrifuge. Clin Chem 1972 Jun;18(6):499-502. [Medline: 4337382]
4. Martin SS, Blaha MJ, Elshazly MB, Toth PP, Kwiterovich PO, Blumenthal RS, et al. Comparison of a novel method vs
the Friedewald equation for estimating low-density lipoprotein cholesterol levels from the standard lipid profile. JAMA
2013 Nov 20;310(19):2061-2068 [FREE Full text] [doi: 10.1001/jama.2013.280532] [Medline: 24240933]
5. Sampson M, Ling C, Sun Q, Harb R, Ashmaig M, Warnick R, et al. A New Equation for Calculation of Low-Density
Lipoprotein Cholesterol in Patients With Normolipidemia and/or Hypertriglyceridemia. JAMA Cardiol 2020 May
01;5(5):540-548 [FREE Full text] [doi: 10.1001/jamacardio.2020.0013] [Medline: 32101259]
6. Lee T, Kim J, Uh Y, Lee H. Deep neural network for estimating low density lipoprotein cholesterol. Clin Chim Acta 2019
Feb;489:35-40. [doi: 10.1016/j.cca.2018.11.022] [Medline: 30448282]
7. LeCun Y, Bengio Y, Hinton G. Deep learning. Nature 2015 May 28;521(7553):436-444. [doi: 10.1038/nature14539]
[Medline: 26017442]
8. Chen Y, Zhang X, Pan B, Jin X, Yao H, Chen B, et al. A modified formula for calculating low-density lipoprotein cholesterol
values. Lipids Health Dis 2010 May 21;9:52 [FREE Full text] [doi: 10.1186/1476-511X-9-52] [Medline: 20487572]
9. de Cordova CMM, de Cordova MM. A new accurate, simple formula for LDL-cholesterol estimation based on directly
measured blood lipids from a large cohort. Ann Clin Biochem 2013 Jan 29;50(Pt 1):13-19. [doi: 10.1258/acb.2012.011259]
[Medline: 23108766]
10. Pan SJ, Yang Q. A Survey on Transfer Learning. IEEE Trans. Knowl. Data Eng 2010 Oct;22(10):1345-1359. [doi:
10.1109/tkde.2009.191]
11. Shickel B, Tighe PJ, Bihorac A, Rashidi P. Deep EHR: A Survey of Recent Advances in Deep Learning Techniques for
Electronic Health Record (EHR) Analysis. IEEE J Biomed Health Inform 2018 Sep;22(5):1589-1604 [FREE Full text]
[doi: 10.1109/JBHI.2017.2767063] [Medline: 29989977]
12. Kim YY, Oh SJ, Chun YS, Lee WK, Park HK. Gene expression assay and Watson for Oncology for optimization of
treatment in ER-positive, HER2-negative breast cancer. PLoS One 2018 Jul 6;13(7):e0200100 [FREE Full text] [doi:
10.1371/journal.pone.0200100] [Medline: 29979736]
13. Vukotic A, Goodwill J. Apache Tomcat 7. Cham, Switzerland: Springer Publishing Company; 2011.
14. Ronacher A. Flask: web development, one drop at a time. URL: https://flask-doc.readthedocs.io/en/latest/ [accessed
2021-07-23]
15. Wolf D, Henley AJ. Java EE Web Application Primer: Building Bullhorn: A Messaging App with JSP, Servlets, JavaScript,
Bootstrap and Oracle. New York, NY: Apress; 2017.
16. McGrath M. HTML, CSS & JavaScript in easy steps. Leamington Spa, UK: In Easy Steps Limited; 2020.
17. Hadjigeorgiou C. RDBMS vs NoSQL: Performance and scaling comparison. University of Edinburgh. 2013. URL: https:/
/static.epcc.ed.ac.uk/dissertations/hpc-msc/2012-2013/
RDBMS%20vs%20NoSQL%20-%20Performance%20and%20Scaling%20Comparison.pdf [accessed 2021-07-23]
18. Abadi M, Barham P, Chen J, Chen Z, Davis A, Dean J, et al. TensorFlow: A System for Large-Scale Machine Learning.
2016 Presented at: 12th USENIX Symposium on Operating Systems Design and Implementation (OSDI ’16); November
2-4, 2016; Savannah, GA.
19. Manaswi NK. Understanding and Working with Keras. In: Deep Learning with Applications Using Python. Berkeley, CA:
Apress; 2018:31-43.
20. Wadhwa N, Krishnaswamy R. Comparison of LDL-Cholesterol Estimate using Various Formulae with Directly Measured
LDL-Cholesterol in Indian Population. J Clin Diagn Res 2016 Dec;10(12):BC11-BC13 [FREE Full text] [doi:
10.7860/JCDR/2016/22272.9018] [Medline: 28208843]
21. Piani F, Cicero AF, Ventura F, Dormi A, Fogacci F, Patrono D, BLIP Study Group. Evaluation of twelve formulas for
LDL-C estimation in a large, blinded, random Italian population. Int J Cardiol 2021 May 01;330:221-227. [doi:
10.1016/j.ijcard.2021.02.009] [Medline: 33581176]
22. WCH-AI-LAB: DNN-TL. GitHub. URL: https://github.com/WCH-AI-LAB/DNN-TL [accessed 2021-07-25]
23. Jeong T, Cho E, Lee W, Chun S, Hong K, Min W. Accuracy Assessment of Five Equations Used for Estimating the
Glomerular Filtration Rate in Korean Adults. Ann Lab Med 2017 Sep 01;37(5):371-380 [FREE Full text] [doi:
10.3343/alm.2017.37.5.371] [Medline: 28643485]
24. National Cholesterol Education Program (NCEP) Expert Panel on Detection‚ Evaluation‚Treatment of High Blood Cholesterol
in Adults (Adult Treatment Panel III). Third Report of the National Cholesterol Education Program (NCEP) Expert Panel
on Detection, Evaluation, and Treatment of High Blood Cholesterol in Adults (Adult Treatment Panel III) final report.
Circulation 2002 Dec 17;106(25):3143-3421. [Medline: 12485966]
25. Meeusen J, Lueke A, Jaffe A, Saenger AK. Validation of a proposed novel equation for estimating LDL cholesterol. Clin
Chem 2014 Dec;60(12):1519-1523. [doi: 10.1373/clinchem.2014.227710] [Medline: 25336719]
https://medinform.jmir.org/2021/8/e29331 JMIR Med Inform 2021 | vol. 9 | iss. 8 | e29331 | p. 11
(page number not for citation purposes)
XSL• FO
RenderXJMIR MEDICAL INFORMATICS Hwang et al
26. Jacob L, Speed TP. The healthy ageing gene expression signature for Alzheimer's disease diagnosis: a random sampling
perspective. Genome Biol 2018 Jul 25;19(1):97 [FREE Full text] [doi: 10.1186/s13059-018-1481-6] [Medline: 30045771]
27. Altmann A, Toloşi L, Sander O, Lengauer T. Permutation importance: a corrected feature importance measure. Bioinformatics
2010 May 15;26(10):1340-1347. [doi: 10.1093/bioinformatics/btq134] [Medline: 20385727]
28. Lundberg S, Lee SI. A unified approach to interpreting model predictions. Cornell University. URL: https://arxiv.org/abs/
1705.07874 [accessed 2021-07-23]
29. Pedregosa F, Varoquaux G, Gramfort A, Michel V, Thirion B, Grisel O, et al. Scikit-learn: Machine Learning in Python.
Journal of Machine Learning Research 2011;12:2825-2830.
30. Nauck M, Warnick GR, Rifai N. Methods for measurement of LDL-cholesterol: a critical assessment of direct measurement
by homogeneous assays versus calculation. Clin Chem 2002 Feb;48(2):236-254. [Medline: 11805004]
31. Warnick GR, Kimberly MM, Waymack PP, Leary ET, Myers GL. Standardization of Measurements for Cholesterol,
Triglycerides, and Major Lipoproteins. Laboratory Medicine 2008 Jul 17;39(8):481-490. [doi: 10.1309/6ul9rhjh1jffu4py]
32. Chakraborty M, Tudu B. Comparison of ANN models to predict LDL level in Diabetes Mellitus type 2. InInternational
Conference on Systems in Medicine and Biology; 2011 Presented at: International Conference on Systems in Medicine
and Biology; December 16-18, 2010; Kharagpur, India. [doi: 10.1109/icsmb.2010.5735410]
Abbreviations
API: application programming interface
CVD: cardiovascular disease
DNN: deep neural network
EHR: electronic health record
eLDL-C: estimated low-density lipoprotein cholesterol
EMR: electronic medical record
HDL-C: high-density lipoprotein cholesterol
JSP: JAVA Server Pages
KNHANES: Korea National Health and Nutrition Examination Survey
LDL-C: low-density lipoprotein cholesterol
mLDL-C: measured low-density lipoprotein cholesterol
NCEP: National Cholesterol Education Program
NIH: National Institutes of Health
RMSE: root mean square error
SHAP: Shapley addictive explanations
TC: total cholesterol
TG: triglyceride
TL: transfer learning
VLDL-C: very low-density lipoprotein cholesterol
WSCH: Wonju Severance Christian Hospital
Edited by G Eysenbach; submitted 02.04.21; peer-reviewed by T Lee, Z Ren, H Li, PP Zhao; comments to author 23.04.21; revised
version received 18.06.21; accepted 05.07.21; published 03.08.21
Please cite as:
Hwang S, Gwon C, Seo DM, Cho J, Kim JY, Uh Y
A Deep Neural Network for Estimating Low-Density Lipoprotein Cholesterol From Electronic Health Records: Real-Time Routine
Clinical Application
JMIR Med Inform 2021;9(8):e29331
URL: https://medinform.jmir.org/2021/8/e29331
doi: 10.2196/29331
PMID:
©Sangwon Hwang, Chanwoo Gwon, Dong Min Seo, Jooyoung Cho, Jang-Young Kim, Young Uh. Originally published in JMIR
Medical Informatics (https://medinform.jmir.org), 03.08.2021. This is an open-access article distributed under the terms of the
Creative Commons Attribution License (https://creativecommons.org/licenses/by/4.0/), which permits unrestricted use, distribution,
and reproduction in any medium, provided the original work, first published in JMIR Medical Informatics, is properly cited. The
complete bibliographic information, a link to the original publication on https://medinform.jmir.org/, as well as this copyright
and license information must be included.
https://medinform.jmir.org/2021/8/e29331 JMIR Med Inform 2021 | vol. 9 | iss. 8 | e29331 | p. 12
(page number not for citation purposes)
XSL• FO
RenderXYou can also read