A newly reconciled dataset for identifying sea level rise and variability in Dublin Bay
←
→
Page content transcription
If your browser does not render page correctly, please read the page content below

Ocean Sci., 18, 511–522, 2022
https://doi.org/10.5194/os-18-511-2022
© Author(s) 2022. This work is distributed under
the Creative Commons Attribution 4.0 License.

A newly reconciled dataset for identifying sea level
rise and variability in Dublin Bay
Amin Shoari Nejad1,2 , Andrew C. Parnell1,2 , Alice Greene2 , Peter Thorne2 , Brian P. Kelleher3 , Robert J. N. Devoy4 ,
and Gerard McCarthy2
1 Hamilton  Institute, Insight Centre for Data Analytics, Maynooth University, Kildare, Ireland
2 ICARUS,   Department of Geography, Maynooth University, Maynooth, Ireland
3 School of Chemical Sciences, Dublin City University, Dublin 9, Ireland
4 Department of Geography, University College Cork, Cork, Ireland

Correspondence: Amin Shoari Nejad (amin.shoarinejad.2020@mumail.ie)

Received: 21 September 2021 – Discussion started: 11 October 2021
Revised: 12 March 2022 – Accepted: 18 March 2022 – Published: 22 April 2022

Abstract. We provide an updated sea level dataset for Dublin        Irish Sea coast. Dublin also has the Republic of Ireland’s
for the period 1938–2016 at yearly resolution. Using a newly        longest tide gauge record (from 1938 onwards): the publicly
collated sea level record for Dublin Port, as well as two           available record for Dublin Port (also called Dublin North
nearby tide gauges at Arklow and Howth Harbour, we per-             Wall). Understanding changes in mean sea level in Dublin is
form data quality checks and calibration of the Dublin Port         key for the protection of Ireland’s largest city and, from a na-
record by adjusting the biased high water level measurements        tional perspective, for understanding long-term sea level rise
that affect the overall calculation of mean sea level (MSL).        (SLR) in Ireland (DCC, 2005).
To correct these MSL values, we use a novel Bayesian lin-              The sea level around Ireland rose rapidly after the last
ear regression that includes the mean low water values as           glacial maximum 20 000 years ago, cutting Ireland off as an
a predictor in the model. We validate the re-created MSL            island 16 000 years ago (Edwards and Craven, 2017). Re-
dataset and show its consistency with other nearby tide gauge       gionally, sea levels in Ireland had stabilised by the 20th cen-
datasets. Using our new corrected dataset, we estimate a rate       tury, after which sea levels began to rise again due to an-
of sea level rise of 1.1 mm yr−1 during 1953–2016 (95 %             thropogenically induced warming (Masson-Delmotte et al.,
credible interval from 0.6 to 1.6 mm yr−1 ), and a rate of          2021). The importance of climate warming and SLR in Ire-
7 mm yr−1 during 1997–2016 (95 % credible interval from             land has been emphasised by a number of authors: Devoy
5 to 8.8 mm yr−1 ). The overall sea level rise is in line with      (2008) discussed the risks of extreme climatic events and the
expected trends, but large multidecadal variability has led to      ways in which Ireland should be prepared for them, while
higher rates of rise in recent years.                               Camaro Garcia et al. (2021) state that satellite observations,
                                                                    which are associated with the open ocean rate, show sea lev-
                                                                    els rising around Ireland at a rate of 2–3 mm yr−1 , in line
                                                                    with global averages for the early 21st century. However, the
1   Introduction                                                    raw tide gauge record at Dublin Port shows a rate of sea level
                                                                    rise of 0.3 mm yr−1 from 1938 to 2000 (DCC, 2005) – much
The global mean sea level (MSL) is rising due to anthro-            lower than the global average.
pogenic climate change (Devoy, 2015; Masson-Delmotte                   A number of authors have investigated trends in the Dublin
et al., 2021). Understanding regional sea level trends is cru-      Port tide gauge data prior to the year 2000 and have found
cial for local and regional adaptation and the development of       similarly low rates of change. Carter (1982) investigated the
effective climate action plans. In Ireland, Dublin is the largest   Dublin Port record using tide gauge measurements, and re-
city, with a population of approximately 1.42 million (CSO,         ported a rising trend of 0.6 mm yr−1 before 1961 and a falling
2019), and is situated at the mouth of the river Liffey on the

Published by Copernicus Publications on behalf of the European Geosciences Union.
512                                           A. Shoari Nejad et al.: A newly reconciled dataset for identifying sea level rise

trend of −0.3 mm yr−1 from then until 1980. Woodworth                    digitised as part of this study. Quality control measures
et al. (1991, 1999) estimated trends of 0.17 mm yr−1 (± 0.35)            for the digitisation included automatic comparison and
from 1938 to 1988, and 0.23 mm yr−1 from 1938 to 1996.                   checking of the calculated and recorded mean levels.
   In stark contrast to these low rates of SLR, the recently             Comparison of the overlapping Port Authority datasets
published climate change action plan for 2019–2024 by                    showed a mean difference of ≤ 1 mm during the 15
Dublin City Council (DCC, 2017) reports an SLR of 6–                     overlapping years (1987–2001). Data are reported rel-
7 mm yr−1 between the years 2000 and 2016. This rate is                  ative to LAT.
approximately double that of the global mean sea level rise
                                                                     3. High-frequency (10 min) data supplied by the Perma-
(Nerem et al., 2018) and is particularly surprising given that
                                                                        nent Service for Mean Sea Level (PSMSL, 2020; Hol-
the earlier rates of rise in Dublin were much lower than the
                                                                        gate et al., 2013) for the period 2002–2009. These data
global mean sea level rise over similar periods (Dangendorf
                                                                        were provided to the PSMSL by the harbourmaster in
et al., 2017).
                                                                        Dublin Port following a change in responsible authority
   The goal of this paper is to further investigate the sea level
                                                                        in 2001 (hereafter the harbourmaster dataset). The data
trend in Dublin Port through careful assembly and quality
                                                                        have a low vertical resolution of 0.1 m and are reported
control of the available data and by comparing those data
                                                                        relative to LAT.
with sea level records collected from nearby tide gauges. We
find that the datums of Dublin’s available sea level measure-        4. High-frequency (5 min) data for the period 2007–2018
ments are not aligned with those of nearby tide gauges and              from the Irish National Tide Gauge Network (NTGN),
thus need further consideration. In addition, we find prob-             which is maintained by the Irish Marine Institute (here-
lems with the mean high water measurements, which indi-                 after the NTGN dataset) (IMI, 2019). Data are available
cate a drift over time. We use a Bayesian multivariate lin-             relative to Ordnance Datum Malin (ODM) and LAT. All
ear regression to adjust for the drift and, after removing at-          NTGN data are defined relative to ODM and LAT.
mospheric factors, we find that the sea level record, at least
for the 21st century, matches other local tide gauges to a far       5. High water levels for the period 1968–2015. These were
higher degree. This allows us to estimate more reliable mea-            digitised as part of an unpublished MSc thesis of Al-
surements of sea level rise for the urban area of Dublin Port.          ice Greene (hereafter the Greene dataset) and are pub-
   The rest of this paper is organised as follows. Section 2 ex-        lished here for the first time. The Greene dataset for the
plains how the sea level dataset for Dublin Port is reconciled          period 1968–1982 was transcribed from photographs of
from various sources. Section 3 discusses the quality check             tidal charts from which the high water values can be
and calibration procedures done on the reconciled dataset.              read. During 1983–2003, the data were recorded in the
Section 4 discusses SLR rates at Dublin Port. Finally, some             format of hard-copy tidal charts. The hard copies con-
issues and suggestions pertaining to SLR analysis at Dublin             sisted of three large A3 books. The remaining data from
Port and the important findings of this study are discussed             2003–2013 from which high waters could be derived
and summarised in Sect. 5.                                              were in digital format.
                                                                       With particular reference to the Greene dataset, prior to
                                                                    the availability of digital data in 2003, the high water val-
2     Data collation for Dublin Port                                ues for each day were extracted from the tidal charts. This
                                                                    was completed by the generation of tables for each year, with
We compiled mean high and low water, mean tide level and,
                                                                    two available cells for each day. These values were read off
where available, mean sea level for Dublin Port from 1938 to
                                                                    and input into the designated cell. The data from the period
2018 from the following sources:
                                                                    1968–1976 were converted from feet and inches to metres.
    1. Annual high and low water from Woodworth et al.              To locate the two high tides, for each day, the highest value
       (1991); PSMSL (2020) for the period 1938–2001 from           was extracted. The second high tide occurred between 12 and
       annual tabulations made by the Dublin Port Authority         13 h before or after the highest value; therefore this value was
       (hereafter the Port Authority annual dataset). Mean tide     extracted using the time component of the dataset. In the case
       level (MTL) was calculated by averaging the mean high        where the time window went into the next calendar day, only
       and low waters. Data from 1938 to 1977 are relative          a single high tide was recorded for that day. A summary of
       to Port Datum, which is 0.436 m above the Ordnance           the datasets is shown in Table 1.
       Survey Datum Dublin (Poolbeg Datum), and data from              Difficulties in merging the Dublin Port datasets arose from
       1978 are relative to the lowest astronomical tide (LAT)      differing datum definitions. For both Port Authority datasets,
       which is 20 cm above Poolbeg Datum.                          the tabulated annual and monthly data are relative to the same
                                                                    datum. These data have the same source and therefore agree-
    2. Monthly values of mean high water (MHW) and mean             ment is expected. Three years of overlap exist between the
       low water (MLW) for the period of 1987–2001 (here-           harbourmaster dataset and the NTGN dataset from 2007–
       after the Port Authority monthly dataset), which were        2009. The harbourmaster dataset is relative to LAT datum;

Ocean Sci., 18, 511–522, 2022                                                           https://doi.org/10.5194/os-18-511-2022
A. Shoari Nejad et al.: A newly reconciled dataset for identifying sea level rise                                                     513

Table 1. Details of the datasets collated to form a complete sea level record for Dublin Port.

    Dataset name       Duration       Sampling frequency      Variables              Datum           Provider
    Port Authority     1938–2001      Annual                  MLW-MTL-MHW            LAT             Woodworth et al. (1991), PSMSL
    Port Authority     1987–2001      Monthly                 MLW-MTL-MHW            LAT             Woodworth et al. (1991), PSMSL
    Harbourmaster      2002–2009      10 min                  All calculable         LAT             PSMSL
    NTGN               2007–2018      5 min                   All calculable         ODM and LAT     Marine Institute
    Greene             1968–2015      Twice daily             MHW                    LAT             This study

the NTGN data are relative to ODM, with a value of 2.599 m                   Figure 3 and Table 3 demonstrate that rates of SLR in
between these datums. There is found to be a systematic un-               MSL and MHW are significantly higher in Dublin Port than
derestimation of 0.044 m in the MHW and MLW values in                     in Arklow or Howth Harbour. A possible cause is the mal-
the harbourmaster dataset, presumably due to its lower verti-             function of the Dublin Port tide gauge in measuring the high
cal resolution of 0.1 m, determined from the overlap with the             water levels, due to drift. A Druck pressure transducer was
NTGN data.                                                                used at Dublin Port (Murphy et al., 2003), and this has the
   While no overlaps exist between the harbourmaster dataset              potential to exhibit drift proportional to the height of the wa-
and the Port Authority dataset, the Greene dataset overlaps               ter column. Accuracies of pressure sensors are reported to
the Port Authority, harbourmaster and NTGN datasets. Fig-                 be proportional to full water column depth. While drift need
ure 1 shows monthly MHW from the Port Authority, har-                     not necessarily be proportional to full water column depth,
bourmaster, NTGN and Greene datasets, each expressed with                 this is a possibility that is supported by further analysis (see
respect to LAT (note that our monthly data are limited to                 next section). Table 4 provides the details of the tide gauges
1968 onward). There is a high level of agreement between                  installed at Dublin Port from 1938 to the present.
the data, indicative of consistent datums. We find a residual                From Fig. 3, we can see that the MLW values at Dublin
0.008 m difference between the Greene dataset and the other               port are highly similar to those from nearby gauges, so we
two datasets (Port Authority monthly dataset and the NTGN                 use these as a baseline to correct the MSL values. To do this,
dataset). We thus add 8 mm to the Greene dataset as the final             we create a regression model that estimates MSL given MLW
datum adjustment.                                                         from older Dublin Port measurements. We then use the pre-
                                                                          dictions from this model to estimate MSL at Dublin Port for
                                                                          the more recent period.
3   Reconciliation of Dublin Port against nearby tide                        To find the period of time over which to train the re-
    gauges                                                                gression, we use a change point model (Carlin et al., 1992)
                                                                          that takes the absolute difference between MSL values of
We now use our newly merged dataset (hereafter the merged
                                                                          Dublin Port and Newlyn in the UK as the inputs. Details of
Dublin Port dataset) including monthly MLW, MTL, MSL
                                                                          the change point model are discussed in the Appendix. The
and MHW measurements. In order to check the reliability of
                                                                          model suggests that there is a change point in the agreement
the merged Dublin Port dataset, we compare with two differ-
                                                                          between Dublin and Newlyn in 1976. Furthermore, Fig. 4
ent nearby tide gauges (maximum distance 60 km) at Howth
                                                                          shows the comparison of MSL data from Dublin Port (not
Harbour and Arklow, and two other tide gauges at Newlyn in
                                                                          yet corrected for the bias demonstrated in Fig. 3) with that of
the UK and Brest in France. The Arklow and Howth Harbour
                                                                          Newlyn and Brest in France. These two are selected due to
datasets are derived from bubbler gauges. The Newlyn and
                                                                          the relative completeness and integrity of their records and
Brest data are gauges with a long history of use in sea level
                                                                          their proximity to Dublin. According to the figure, there is
studies (Bradshaw et al., 2016; Wöppelmann et al., 2006).
                                                                          strong agreement between stations for MSL in the period
Figure 2 shows the locations of the tide gauges. Table 2 pro-
                                                                          1938–1976. After 1976, the level of agreement deteriorates,
vides the details of the datasets.
                                                                          which is consistent with the change point model result. Note
   For the Arklow and Howth Harbour datasets, we first ag-
                                                                          that this does not necessarily mean that the weaker agree-
gregate the values up to daily and monthly level for MLW,
                                                                          ment post-1976 is related to data quality. However, based on
MSL and MHW. During our pre-processing, we compared
                                                                          these observations, we do not have any evidence supporting
MLW, MSL and MHW at Dublin Port with those at Arklow
                                                                          the quality of data from 1976 onwards, and so we limited our
and Howth Harbour. We noticed that the other sites exhibited
                                                                          modelling approach to data from the preceding period.
low levels of agreement with Dublin Port after 2017, so we
                                                                             We correct the bias in the MSL values at Dublin Port using
restricted our analysis to use only data up to the end of 2016.
                                                                          a Bayesian multivariate linear regression. Our model consists
                                                                          of an intercept, a term proportional to annual MLW, a fixed
                                                                          effect on annual MLWs, a harmonic function with a period

https://doi.org/10.5194/os-18-511-2022                                                                  Ocean Sci., 18, 511–522, 2022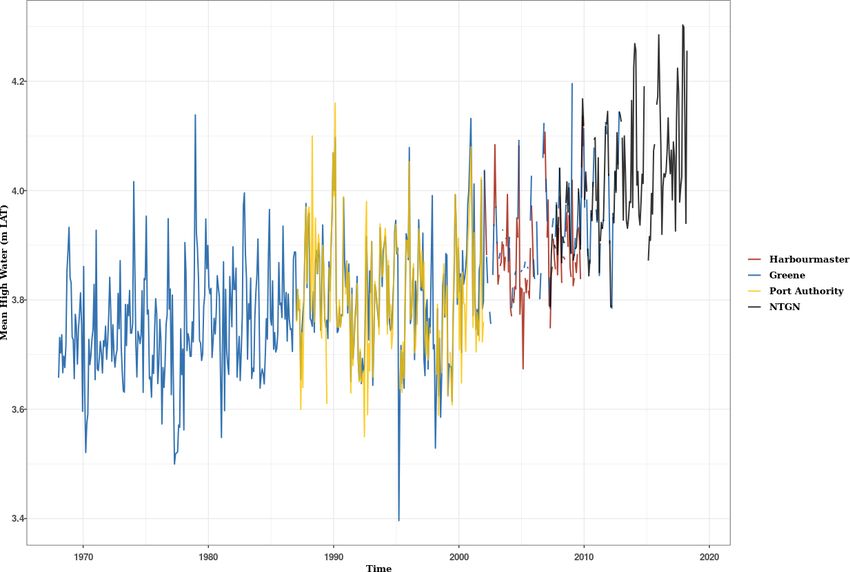
514                                                 A. Shoari Nejad et al.: A newly reconciled dataset for identifying sea level rise

Figure 1. Monthly MHW in Dublin from the Port Authority, Greene, harbourmaster and NTGN datasets. A high level of agreement is found
between the records, indicating consistent datum definition, with only a small adjustment of 0.008 m to the Greene dataset required for
complete reconciliation.

Table 2. Details of the four datasets used for comparison with Dublin Port.

                              Dataset                Duration          Sampling frequency           Provider
                              Arklow                 2003–2018         15 min                       Office of Public Works
                              Howth Harbour          2007–2018         6 min                        Marine Institute
                              Brest                  1938–2016         Annual                       PSMSL
                              Newlyn                 1938–2016         Annual                       PSMSL

                            PSMSL provides both monthly and annual data. We use only annual data that matches our data resolution.

                                                                                                    2π          2π
of 18.6 years to model the lunar nodal cycle, and a period of                     with ω1 =              , ω2 =     ,
4.4 years to account for the 8.85-year cycle of lunar perigee                                      18.61        4.4
(Haigh et al., 2011; Woodworth, 2012). The two latter terms                       where (MSL)t is the MSL in year t, µt is the mean, σ 2 is the
will primarily contribute to the astronomical tidal component                     residual variance, β0 is the intercept, β1 is the MLW coeffi-
of MLW. The model formulation is as follows:                                      cient, β2 and β3 are the amplitudes of the cosine and sine
                                                                                  functions of the 18.6-year lunar nodal modulation respec-
                                                                                tively, and β4 and β5 are the amplitudes of the cosine and
(MSL)t ∼ Normal µt , σ 2                                                          sine functions of the 4.4-year modulation respectively.
                                                                                     We fitted the model using the JAGS software (Plummer
µt = β0 + β1 (MLW)t + β2 cos (ω1 t) + β3 sin (ω1 t)                               et al., 2003) and R (R Core Team, 2022), and used three
   + β4 cos (ω2 t) + β5 sin (ω2 t)                                                Markov chain Monte Carlo chains (2000 iterations per chain

Ocean Sci., 18, 511–522, 2022                                                                                 https://doi.org/10.5194/os-18-511-2022
A. Shoari Nejad et al.: A newly reconciled dataset for identifying sea level rise                                                515

Figure 2. Locations referred to in this study: Dublin Port, Howth Harbour, Arklow, Brest and Newlyn.

Table 3. Differences between rates of SLR in MLW, MSL and MHW for Dublin Port and those for Arklow or Howth Harbour. Large values
with small standard errors indicate a significantly higher rate at Dublin Port.

                       Locations                       MLW (mm yr−1 )       MSL (mm yr−1 )     MHW (mm yr−1 )
                       Dublin Port – Arklow                   0.6 (±2.8)          6.9 (±2.6)            14 (±2.7)
                       Dublin Port – Howth Harbour            1.5 (±4.0)          3.8 (±3.9)           5.8 (±4.2)

with 1000 as burn-in, and a thinning value of 1). Conver-              new Dublin Port data so are an independent validation of our
gence was assessed using the R-hat diagnostic (Brooks and              approach. The larger adjustment in Fig. 5 after 2001 seems
Gelman, 1998; Gelman and Rubin, 1992). All R-hat values                to support the discrepancies shown in Fig. 3 for the higher
associated with β and σ were close to 1, so the model was              water levels and provides further justification for our change
assumed to be sampling from the posterior distribution. The            point calibration approach.
new estimated MSL and the original values, together with the
yearly MSL values of Arklow and Howth Harbour, are shown
in Fig. 5. This figure demonstrates that the newly modelled            4   Rates of sea level rise at Dublin Port and nearby
Dublin Port yearly MSL data are changed only slightly be-                  gauges
tween 1938 and 2001. After 2001, we can see a clear gap
                                                                       We now use the corrected data from Dublin Port to calcu-
between the old (red) and new (blue) versions, with the new
                                                                       late rates of sea level rise. We use the yearly MSL data from
corrected data exhibiting superior agreement with the Ark-
                                                                       Brest and Newlyn for comparison. The MSL data from Brest
low and Howth Harbour records. We note again here that
                                                                       is missing between 1944 and 1952, so we decided to limit
these adjacent records were not used in the creation of the
                                                                       our SLR rate estimations to 1953–2016, during which the

https://doi.org/10.5194/os-18-511-2022                                                                 Ocean Sci., 18, 511–522, 2022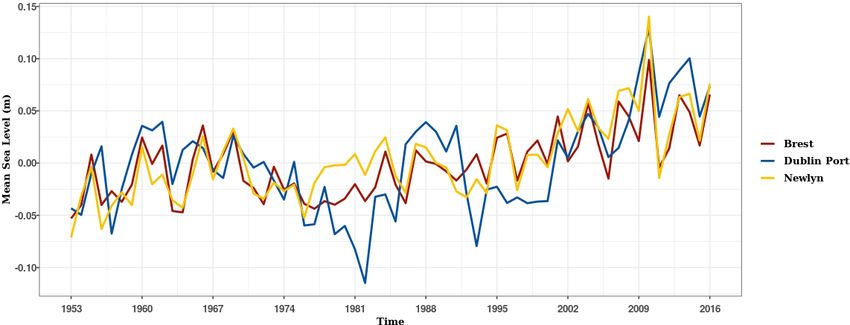
516                                              A. Shoari Nejad et al.: A newly reconciled dataset for identifying sea level rise

Figure 3. Comparison of MHW, MSL and MLW monthly values for Dublin Port against those for Arklow (a, c, e) and Howth Harbour (b,
d, f), with linear trends shown for each. The MLW linear trends for Dublin Port and Arklow are in good agreement, as are those for Dublin
Port and Howth Harbour. However, this is not the case with the linear trends for MSL and MHW when comparing Dublin Port to the two
other locations.

Table 4. Details of the tide gauges installed at Dublin Port.

                       Gauge type                     Start     End    Reference
                       Float gauge                    1938      2001   Original chart supplied by Dublin City Council
                                                                       indicates the float gauge in operation.
                       Druck pressure transducer      2001      2016   This sensor began to malfunction in 2017 and
                                                                       was replaced in 2018.
                       OTT bubbler                    2018      –      New sensor installed in 2018. Data not used in
                                                                       this study.

data for all three sites were complete. We first removed the                 To calculate the rates of SLR, as before, we use a Bayesian
inverse barometer and wind effects on sea level at each site              multivariate linear regression, including an intercept and a
following Frederikse et al. (2017) and Diabaté et al. (2021)              linear trend. The model is fitted in JAGS with the same set-
(we omitted this step in the previous section due to a lack of            tings and convergence requirements as previously described.
atmospheric data during 1938–1948). Atmospheric data are                  We write the model as
accessed via the RNCEP package (Kemp et al., 2012) in the
                                                                                                       2
R programming language, which accesses the National Cen-                  (MSL)t ∼ Normal µt , σ 0 t + σ 2
ters for Environmental Prediction (NCEP)/National Center
for Atmospheric Research (NCAR) and Department of En-                     µt = β0 + β1 t,
ergy Reanalysis I and II datasets (Kalnay et al., 1996; Kana-
mitsu et al., 2002). Figure 6 shows the atmospherically cor-              where (MSL)t is the MSL at time t, µt is the mean, σ 0 2t is the
rected MSL data from Dublin Port, Brest and Newlyn super-                 fixed variance at time t extracted from the posterior distribu-
imposed for comparison.                                                   tion of the calibration model to account for the uncertainty in
                                                                          modelling the MSL introduced in the previous section, σ 2 is
                                                                          the residual variance, β0 is the intercept and β1 is the rate in

Ocean Sci., 18, 511–522, 2022                                                                  https://doi.org/10.5194/os-18-511-2022
A. Shoari Nejad et al.: A newly reconciled dataset for identifying sea level rise 517
Figure 4. Yearly MSL values for Dublin Port, Newlyn and Brest. The green area shows our chosen time period, during which there is good
agreement between Dublin Port and the other sites.
mm yr−1 . We use the same approach (but without the fixed for earlier periods (i.e. pre-1953) are less than 1.1 mm yr−1
measurement error) for estimating the rates of rise at Brest (Carter, 1982; Woodworth et al., 1991) and are consistent
and Newlyn. with the findings here, and were lower because the decades
The estimated rates with their associated 95 % posterior of larger sea level rise and variability (1980s, 2000s) were
credible intervals are given in Table 5, which shows that, be- not included in the trend estimation. Elsewhere in Ireland,
tween 1953 and 2016, the rate of SLR at Dublin Port has Orford et al. (2006) investigated tide gauge records in Malin
a mean estimate of 1.1 mm yr−1 , consistent with the esti- Head (1958–1998) and Belfast harbour (1918–2002), where
mated rate of 0.9 mm yr−1 at Brest and that of 1.3 mm yr−1 at they reported substantial annual variation for both sites, with
Newlyn. However in more recent years, specifically between overall negative trends of −0.2 mm yr−1 for Belfast and
1997 and 2016, Dublin Port has experienced a greater SLR −0.16 mm yr−1 for Malin Head. Both Belfast and Malin
of 7 mm yr−1 , larger than the SLRs of 2.3 mm yr−1 at Brest Head, being in the north of the country, are in regions of up-
and 3.1 mm yr−1 at Newlyn. Figure 6 also suggests that sea lift due to glacial isostatic adjustment (GIA), which reduces
level in Dublin Port has experienced larger decadal fluctua- the relative sea level rise there. However, Dublin is in a region
tions and is not as secular as the sea level at the two other of neutral glacial isostatic uplift, so these long-term effects
locations. of post-glacial land motion should be negligible and hence
greater consistency of the local sea level rise rates with the
global figure is to be expected (Bradley et al., 2011).
5 Discussion and conclusions More surprising is the large decadal variability re-
vealed. This study has found a rate of sea level rise for
Taken over the full time period of observations, 1953–2016, Dublin of −2.9 mm yr−1 for the period 1975–1985, fol-
the estimated sea level rise of 1.1 mm yr−1 in Dublin is con- lowed by another negative sea level trend in the next decade
sistent with those in Brest and Newlyn, both of which are (−8.6 mm yr−1 during 1986–1996) and a rise of 7 mm yr−1
located on the western European coastline. The rates of rise
https://doi.org/10.5194/os-18-511-2022 Ocean Sci., 18, 511–522, 2022518 A. Shoari Nejad et al.: A newly reconciled dataset for identifying sea level rise
Figure 5. The uncorrected and corrected yearly MSL values of Dublin Port, with yearly MSL values of Arklow and Howth Harbour for
comparison. The newly corrected Dublin Port MSL values lie much closer to the neighbouring tide gauges. The faded lines in the background
show posterior samples from the model and an indication of model uncertainty.
Figure 6. New yearly MSL values of Dublin Port and yearly MSL values of Brest and Newlyn, with atmospheric effects removed, between
1953 and 2016.
for the period 1997–2016. Similar patterns of decadal vari- a full investigation of the causes of decadal variability in
ability in sea level to those in Dublin were also noted in Dublin sea level remains to be performed.
Belfast by Orford et al. (2015) and are linked to decadal vari- Comparisons of the MLW, MSL and MHW recordings at
ation of the North Atlantic Oscillation. This would seem a Dublin Port suggest a possible issue with the observation of
likely explanation for similar patterns in Dublin. However, high water levels. Our model recreated the MSL and showed
that there is good agreement between the observed MSL and
Ocean Sci., 18, 511–522, 2022 https://doi.org/10.5194/os-18-511-2022A. Shoari Nejad et al.: A newly reconciled dataset for identifying sea level rise 519
Table 5. Estimated rates of SLR at Dublin Port, Newlyn and Brest, with 95 % credible intervals for the time periods of interest.
Location 1953–2016 (mm yr−1 ) 1975–1985 (mm yr−1 ) 1986–1996 (mm yr−1 ) 1997–2016 (mm yr−1 )
Dublin Port 1.1 (0.6, 1.6) −2.9 (−9, 2.9) −8.6 (−13.4, −3.7) 7 (5.0, 8.8)
Newlyn 1.3 (1.0, 1.6) 3.9 (0.7, 6.9) 1.6 (−3.4, 6.8) 3.1 (0.7, 5.5)
Brest 0.9 (0.6, 1.2) 2.5 (0.0, 5.0) 3.1 (−0.2, 6.4) 2.3 (0.3, 4.3)
the modelled MSL for the period 1938–2001. However, after Appendix A
2001 there is considerable divergence. Our analysis shows
that the modelled MSL is more consistent with the data col- To identify the period of data to use in calibrating the Dublin
lected by the nearby tide gauges and also at the farther sites in Port MSL and MLW values (see Fig. 4), we use a linear re-
Newlyn and Brest. This suggests that the malfunction proba- gression change point model (Carlin et al., 1992). The model
bly started during or after the year 2002. We would consider we use can be formulated as follows:
the Howth Harbour sea level record, alongside the modelled
MSL data created in our study, as the more reliable dataset yt ∼ Normal µt , σ 2
for a future analysis of sea level in Dublin Bay compared to µt = α1 + α2 × u (t − tc ) ,
the data collected at Dublin Port.
Dublin City Council have recently increased the coastal where yt is the absolute difference between the measured
defences in Dublin, allowing for between 40 and 65 cm of mean sea levels at Dublin Port and Newlyn in year t (t =
mean sea level rise (O’Connell, 2019). Projections of sea 1, 2, . . ., T ). We assume yt to be normally distributed with
level rise for Dublin, based on UKCP18 (Fung et al., 2018), mean µt and variance σ 2 . The mean is set to α1 if t < tc and
depend heavily on greenhouse gas emissions trajectories. By α1 + α2 otherwise, and tc is the time of the change point. The
2100, the Dublin mean sea level is projected to rise by 0.6 m function u(t) is the unit step function. We used vague prior
at the 50th percentile (1.0 m at the 95th percentile) under an distributions for all parameters:
RCP8.5 scenario and by 0.3 m at the 50th percentile level
(0.6 m at the 95th percentile level) under an RCP2.6 sce- α1 ∼ Normal (0, 100)
nario. These projections do not simulate the decadal scale α2 ∼ Normal (0, 100)
variability reported here, similar to many other decadal cli-
tc ∼ Uniform (1938, 2016)
mate phenomena. Understanding the origin and duration of
the decadal fluctuations of mean sea level in Dublin is crucial σ 2 ∼ Uniform (0, 100)
for the preparation and defence of Ireland’s capital city in the
coming decades. Figure A1 shows the absolute difference between the
To sum up, we have collated multiple sources of tide gauge MSLs of Dublin Port and Newlyn. The vertical red line indi-
data for Dublin Port, and subsequently corrected them for cates the posterior mean of the change-point estimate tc .
bias in the MHW level. We have then shown that these cor-
rected MSL measurements agree with both Howth Harbour
and Arklow to a far higher degree than the raw data. A
longer-term comparison with Brest and Newlyn also indi-
cates overall agreement. There remains a difference during
the 1970s and the 1980s, where a large cyclic disparity in
Dublin contrasts with the other two records. Our final ad-
justed dataset estimated the rate of SLR at Dublin Port to
be 1.1 mm yr−1 between 1953 and 2016, and 7 mm yr−1 be-
tween 1997 and 2016.
The work we present here is part of a broader aim to im-
prove sea level records in Ireland through the multi-centre
Aigéin, Aeráid, agus athrú Atlantaigh (A4) project. A recent
example is that of the now corrected tide gauge record in
Cork City (Pugh et al., 2021). A deeper focus on the coastal
environs of Dublin is also under way through the Predict
Project funded by Science Foundation Ireland. We hope to
report elsewhere on further records that may provide a fuller
picture of SLR in Ireland.
https://doi.org/10.5194/os-18-511-2022 Ocean Sci., 18, 511–522, 2022520 A. Shoari Nejad et al.: A newly reconciled dataset for identifying sea level rise
Figure A1. The absolute difference in MSL between Dublin Port and Newlyn from 1938 to 2016. The mean posterior estimated change-point
time given by the model is indicated by the vertical red line at the year 1976.
Code availability. The codes used in this study are available on Disclaimer. Publisher’s note: Copernicus Publications remains
Github (https://github.com/Aminsn/Dublin-Bay-SLR, last access: neutral with regard to jurisdictional claims in published maps and
20 April 2022). institutional affiliations.
Data availability. Dublin Port annual mean sea-level data (cor- Acknowledgements. Amin Shoari Nejad’s work was supported by
rected as a result of this study for measurement bias) from 1938 Science Foundation Ireland Investigator Award grant 16/IA/4520.
to 2016 plus historical datasets described in Table 1 are available Andrew Parnell’s work was supported by a Science Foundation Ire-
in CSV format from here: https://doi.org/10.5281/zenodo.6338475 land Career Development Award (17/CDA/4695), a research centre
(Shoari Nejad et al., 2021). Data from the Irish National Tide Gauge award (12/RC/2289-P2), and an investigator award (16/IA/4520).
Network, maintained by the OPW (Arklow) and the Marine Insti- Gerard McCarthy and Andrew Parnell were supported by the Ma-
tute (Dublin Port, Howth), are available from https://waterlevel.ie/ rine Institute and the Marine Research Programme 2014–2020
(OPW, 2021) and http://www.irishtides.ie (Marine Institute, 2021), through the A4 project (Grant-Aid Agreement no. PBA/18/CC/01).
respectively. The author has applied a CC BY public copyright licence to any
author accepted manuscript version arising from this submission.
Author contributions. ASN, ACP and GM originated the study. The
analysis was performed by ASN. AG and PT created the high water Financial support. This research has been supported by the Sci-
dataset. All authors contributed to the writing of the manuscript. ence Foundation Ireland (grant no. 16/IA/4520).
Competing interests. The contact author has declared that neither Review statement. This paper was edited by John M. Huthnance
they nor their co-authors have any competing interests. and reviewed by Philip Woodworth and Sarah Bradley.
Ocean Sci., 18, 511–522, 2022 https://doi.org/10.5194/os-18-511-2022A. Shoari Nejad et al.: A newly reconciled dataset for identifying sea level rise 521
References Fung, F., Palmer, M., Howard, T., Lowe, J., Maisey, P.,
and Mitchell, J.: UKCP18 Factsheet: Sea Level Rise and
Bradley, S., Milne, G., Shennan, I., and Edwards, R.: An improved Storm Surge, Tech. Rep., Met Office Hadley Centre, Ex-
glacial isostatic adjustment model for the British Isles, J. Quater- eter, https://www.metoffice.gov.uk/binaries/content/ (last access:
nary Sci., 26, 541–552, 2011. 20 April 2022), 2018.
Bradshaw, E., Woodworth, P., Hibbert, A., Bradley, L., Pugh, D., Gelman, A. and Rubin, D.: Inference from iterative simulation using
Fane, C., and Bingley, R.: A century of sea level measurements multiple sequences, Stat. Sci., 7, 457–472, 1992.
at Newlyn, Southwest England, Mar. Geod., 39, 115–140, 2016. Haigh, I. D., Eliot, M., and Pattiaratchi, C.: Global influences
Brooks, S. and Gelman, A.: General methods for monitoring con- of the 18.61 year nodal cycle and 8.85 year cycle of lunar
vergence of iterative simulations, J. Comput. Graph. Stat., 7, perigee on high tidal levels, J. Geophys. Res.-Ocean., 116, C6,
434–455, 1998. https://doi.org/10.1029/2010JC006645, 2011.
Camaro Garcia, W., Dwyer, N., Barrett, F., Berry, A., Cronin, M., Holgate, S., Matthews, A., Woodworth, P., Rickards, L., Tamisiea,
Cusack, C., Gallagher, S., Gault, J., Gill, M., Gleeson, E., Han- M., Bradshaw, E., Foden, P., Gordon, K., Jevrejeva, S., and Pugh,
ley, J., Kane, P., Lambkin, K., Lawlor, R., Lydon, K., Lyons, K., J.: New Data Systems and Products at the Permanent Service for
Martin, D., McCarthy, G., McGovern, E., Murphy, C., Nolan, G., Mean Sea Level, J. Coast. Res., 29, 493–504, 2013.
Nugent, C., O’Dwyer, B., Ovadnevaite, J., Quinlan, C., Saun- IMI: Irish Marine Institute website, https://erddap.marine.ie/erddap/
ders, M., Silke, J., Smith, G., Thomas, R., Walsh, S., West- (last access: 1 September 2021), 2019.
brook, G., Eoin, W., and Wilkes, R.: Climate Status Report Kalnay, E., Kanamitsu, M., Kistler, R., Collins, W., Deaven, D.,
for Ireland, Tech. Rep., EPA, https://www.epa.ie/publications/ Gandin, L., Iredell, M., Saha, S., White, G., Woollen, J., Zhu,
research/climate-change/Research_Report_386.pdf (last access: Y., Leetmaa, A., Reynolds, R., Chelliah, M., Ebisuzaki, W., Hig-
20 April 2022), 2021. gins, W., Janowiak, J., Mo, K., Ropelewski, C., Wang, J., Jenne,
Carlin, B. P., Gelfand, A. E., and Smith, A. F.: Hierarchical R., and Joseph, D.: The NCEP/NCAR 40-year reanalysis project,
Bayesian analysis of changepoint problems, J. Roy. Stat. Soc. Bull. Am. Meteorol. Soc., 77, 437–471, 1996.
Ser. C, 41, 389–405, 1992. Kanamitsu, M., Ebisuzaki, W., Woollen, J., Yang, S.-K., Hnilo, J.,
Carter, R.: Sea-level changes in Northern Ireland, P. Geologist. As- Fiorino, M., and Potter, G.: NCEP–DOE AMIP-II Reanalysis (R-
soc., 93, 7–23, 1982. 2), Bull. Am. Meteorol. Soc., 83, 1631–1643, 2002.
CSO: Central Statistics Office: Population and Migration Estimates Kemp, M. U., Emiel van Loon, E., Shamoun-Baranes, J., and
April 2020, https://www.cso.ie/en/csolatestnews/pressreleases/ Bouten, W.: RNCEP: global weather and climate data at your
(last access: 8 September 2021), 2019. fingertips, Method. Ecol. Evol., 3, 65–70, 2012.
Dangendorf, S., Marcos, M., Wöppelmann, G., Conrad, C., Fred- Marine Institute: Tidal Observations, Marine Institute [data set],
erikse, T., and Riva, R.: Reassessment of 20th century global available at: http://www.marine.ie/Home/site-area/data-services/
mean sea level rise, P. Natl. Acad. Sci. USA, 114, 5946–5951, real-time-observations/tidal-observations, last access: 11 De-
2017. cember 2021.
DCC: Dublin City Council: Dublin Coastal Flooding Protec- Masson-Delmotte, V., Zhai, P., Pirani, A., Connors, S. L., Péan,
tion Project, Report No. 9M2793., Tech. Rep., Report for C., Berger, S., Caud, N., Chen, Y., Goldfarb, L., Gomis,
Dublin City Council, drafted by: Owen Mc Manus, Ian Cooke, M. I., Huang, M., Leitzell, K., Lonnoy, E., Matthews, J.,
John Greenyer, https://www.fingal.ie/sites/default/ (last access: Maycock, T. K., Waterfield, T., Yelekçi, O., Yu, R., et al.
20 April 2022), 2005. (Eds.): IPCC, 2021: Summary for Policymakers, in: Climate
DCC: Dublin city council: Climate change action plan, Change 2021: The Physical Science Basis, Contribution of
https://www.dublincity.ie/residential/environment/ (last ac- Working Group I to the Sixth Assessment Report of the In-
cess: 10 April 2022), 2017. tergovernmental Panel on Climate Change, Tech. Rep., Cam-
Devoy, R.: Coastal vulnerability and the implications of sea-level bridge University Press, https://www.ipcc.ch/report/ar6/wg1/
rise for Ireland, J. Coast. Res., 24, 325–341, 2008. downloads/report/IPCC_AR6_WGI_Full_Report.pdf (last ac-
Devoy, R. J.: Sea-level rise: causes, impacts, and scenarios for cess: 20 April 2022), 2021.
change, in: Coastal and Marine Hazards, Risks, and Disasters, Murphy, J., Sutton, G., O’Mahony, C., and Woodworth, P.: Scop-
Elsevier, 197–241, https://doi.org/10.1016/B978-0-12-396483- ing Study to Assess the Status of Irelands Tide Gauge In-
0.00008-X, 2015. frastructure and Outline Current and Future Requirements,
Diabaté, S. T., Swingedouw, D., Hirschi, J. J.-M., Duchez, A., Tech. Rep., https://www.psmsl.org/train_and_info/ (last access:
Leadbitter, P. J., Haigh, I. D., and McCarthy, G. D.: West- 20 April 2022), 2003.
ern boundary circulation and coastal sea-level variability in Nerem, R., Beckley, B., Fasullo, J., Hamlington, B., Masters, D.,
Northern Hemisphere oceans, Ocean Sci., 17, 1449–1471, and Mitchum, G.: Climate change driven accelerated sea level
https://doi.org/10.5194/os-17-1449-2021, 2021. rise detected in the altimeter era, P. Natl. Acad. Sci. USA, 115,
Edwards, R. and Craven, K.: Relative Sea-Level Change Around the 2022–2025, 2018.
Irish Coast, in: Advances in Irish Quaternary Studies, 181–215, O’Connell, G.: Interview on Pat Kenny New-
edited by: Coxon, P., McCarron, S., and Mitchell, F., Atlantis stalk: Is Catastrophic Dublin flooding inevitable?,
Press, https://doi.org/10.2991/978-94-6239-219-9, 2017. https://www.newstalk.com/podcasts/ (last access: 1 Septem-
Frederikse, T., Simon, K., Katsman, C. A., and Riva, R.: The sea- ber 2021), 2019.
level budget along the Northwest Atlantic coast: GIA, mass OPW: GPRS Stations, OPW [data set], avaiable at: https://
changes, and large-scale ocean dynamics, J. Geophys. Res.- waterlevel.ie/, last access: 11 December 2021.
Ocean., 122, 5486–5501, 2017.
https://doi.org/10.5194/os-18-511-2022 Ocean Sci., 18, 511–522, 2022522 A. Shoari Nejad et al.: A newly reconciled dataset for identifying sea level rise Orford, J. and Murdy, J.: Presence and possible cause of period- Shoari Nejad, A., McCarthy, G., Parnell, A. C., Thorne, P., icities in 20th-century extreme coastal surge: Belfast Harbour, Kelleher, B. P., Devoy, R. J. N., and Greene, A.: Dublin’s Northern Ireland, Glob. Planet. Change, 133, 254–262, 2015. Corrected Mean Sea Level (1938–2016), Zenodo [data set], Orford, J., Murdy, J., and Freel, R.: Developing constraints on the https://doi.org/10.5281/zenodo.6338475, 2021. relative sea-level curve for the northeast of Ireland from the mid- Woodworth, P., Shaw, S., and Blackman, D.: Secular trends in mean Holocene to the present day, Philos. T. R. Soc. A, 364, 857–866, tidal range around the British Isles and along the adjacent Euro- 2006. pean coastline, Geophys. J. Int., 104, 593–609, 1991. Plummer, M. et al.: JAGS: A program for analysis of Bayesian Woodworth, P., Tsimplis, M., Flather, R., and Shennan, I.: A review graphical models using Gibbs sampling, in: Proceedings of the of the trends observed in British Isles mean sea level data mea- 3rd international workshop on distributed statistical computing, sured by tide gauges, Geophys. J. Int., 136, 651–670, 1999. Vol. 124, 1–10, Vienna, Austria, 2003. Woodworth, P. L.: A note on the nodal tide in sea level records, J. PSMSL: Permanent Service for Mean Sea Level (PSMSL), Tide Coast. Res., 28, 316–323, 2012. Gauge Data, http://www.psmsl.org/data/obtaining (last access: Wöppelmann, G., Pouvreau, N., and Simon, B.: Brest sea level 21 January 2022), 2020. record: a time series construction back to the early eighteenth Pugh, D. T., Bridge, E., Edwards, R., Hogarth, P., Westbrook, G., century, Ocean Dynam., 56, 487–497, 2006. Woodworth, P. L., and McCarthy, G. D.: Mean sea level and tidal change in Ireland since 1842: a case study of Cork, Ocean Sci., 17, 1623–1637, https://doi.org/10.5194/os-17-1623-2021, 2021. R Core Team: R: A language and environment for statistical com- puting, R Foundation for Statistical Computing, Tech. Rep., Vi- enna, Austria, https://www.R-project.org/ (last access: 21 Jan- uary 2022), 2022. Ocean Sci., 18, 511–522, 2022 https://doi.org/10.5194/os-18-511-2022
You can also read