A NOVEL AUCTION SYSTEM FOR SELECTING ADVERTISEMENTS IN REAL-TIME BIDDING
←
→
Page content transcription
If your browser does not render page correctly, please read the page content below
A NOVEL AUCTION SYSTEM FOR SELECTING ADVERTISEMENTS
                                                         IN R EAL -T IME BIDDING

                                                                                      Luis Miralles-Pechuán
                                                                    School of Computing. Technological University Dublin, Ireland
                                                                                 luis.miralles@tudublin.ie
arXiv:2010.11981v1 [cs.GT] 22 Oct 2020

                                                                                        Fernando Jiménez
                                                                     Department of Information and Communication Engineering,
                                                                            University of Murcia, 30071 Murcia, Spain
                                                                                          fernan@um.es

                                                                                        José Manuel Garcı́a
                                                                     Department of Information and Communication Engineering,
                                                                            University of Murcia, 30071 Murcia, Spain
                                                                                         jmgarcia@um.es

                                                                                            October 26, 2020

                                                                                              A BSTRACT

                                                  Real-Time Bidding is a new Internet advertising system that has become very popular in recent
                                                  years. This system works like a global auction where advertisers bid to display their impressions in
                                                  the publishers’ ad slots. The most popular system to select which advertiser wins each auction is
                                                  the Generalized second-price auction in which the advertiser that offers the most wins the bet and is
                                                  charged with the price of the second largest bet. In this paper, we propose an alternative betting sys-
                                                  tem with a new approach that not only considers the economic aspect but also other relevant factors
                                                  for the functioning of the advertising system. The factors that we consider are, among others, the
                                                  benefit that can be given to each advertiser, the probability of conversion from the advertisement,
                                                  the probability that the visit is fraudulent, how balanced are the networks participating in RTB and
                                                  if the advertisers are not paying over the market price. In addition, we propose a methodology based
                                                  on genetic algorithms to optimize the selection of each advertiser. We also conducted some experi-
                                                  ments to compare the performance of the proposed model with the famous Generalized Second-Price
                                                  method. We think that this new approach, which considers more relevant aspects besides the price,
                                                  offers greater benefits for RTB networks in the medium and long-term.

                                         Keywords Advertising Exchange System · Online Advertising Networks · Genetic Algorithms · Real-Time Bidding ·
                                         Advertising revenue system calculation · Generalized Second-price

                                         1   Introduction

                                         Each time, more companies announce their products on the Internet since it is an effective channel to reach potential
                                         customers. This channel is very appropriate for selling intangible products such as hotel reservations, flight tickets,
                                         company shares or medical insurances anywhere in the world [?, 1].
                                         There are some good reasons that explain why online advertising has seen such enormous growth. For instance, online
                                         campaigns advertisers are able to segment Internet users based on different features such as access time, city, age
A PREPRINT - O CTOBER 26, 2020
or gender. This means that advertisers can target their campaigns more assertively by selecting the right user profile
depending on the advertised product 1 .
Another advantage is that advertisers are able to know in real time their campaigns’ performance, which allows them
to adjust their campaigns’ settings to make them more effective each time [3].
Additionally, online campaigns are available for any budget size, from small businesses and freelancers which spend
a few dollars a day to international companies that invest millions of dollars weekly.
In the first Internet advertising model, advertisers contacted directly with publishers in order to display their banners.
With the passage of time, and as more advertisers and more publishers wanted to participate, this system of managing
to advertise became a bit obsolete. Here it was where a new advertising model called Advertising Network (AN)
was born. The AN acts as an intermediary between advertisers and publishers, simplifying the process of launching
campaigns on the Internet. The advertiser buys a number of impressions and the ANs displays that number of impres-
sions on the pages of the publishers in exchange for a commission. Maximizing publishers’ spaces while improving
the performance of advertisers’ campaigns are the main objectives of the ANs. These advantages led to the creation
of numerous ANs. However, as time passed, and that, in spite of the increased demand for online campaigns, the
number of ANs has been decreasing because large networks captured large market shares [4]. The small ANs found
themselves in a difficult situation because they lacked an effective system for online fraud detection and because they
received a low number of visits, which made them unable to offer targeted campaigns to advertisers.
In addition, for advertisers, it is tedious to have to choose between the numerous ANs and evaluate their performance.
For these reasons, currently, most advertisers have opted for large ANs because they offer more profitable campaigns
[5]. In the same way, most publishers partner with large ANs because they obtain higher incomes and receive prompt
payments. Having more advertisers and publishers make large ANs earn consistently higher revenues, which in turn
allows them to offer more and better services to both advertisers and publishers. Large ANs can easily invest in
promoting their platform and in recruiting new advertisers and publishers.
In this context, the smaller ANs decided to join, giving rise to a new advertising model called Real-Time Bidding. This
new system networks can exchange visits to make a better match between users and the ads that are shown. Through
RTB, small ANs can exchange adverts with each other in order to become more competitive. RTB consists of a large
global market where publishers auction ad slots each time a user accesses to their web pages [6].
Advertisers participate in the auction and the Generalized Second-Price (GSP) system is usually used to select the
advertiser. In the system, the advertisement of the advertiser who makes the highest bet is selected and the price of the
second highest bet is paid. Some studies show that this system is more favourable for publishers because they do not
update the price constantly as in other systems [7, 8]. However, maximizing economic performance in the short term
does not guarantee that in the short-medium term it will be better.
In this paper, we propose an alternative payment model to GSP which takes into account not only the economic
performance in the short term but also considers many other variables in order to guarantee that all involved parties
(advertisers, publishers and specially ANs) will make reasonable profits.
The presented work is in line with that of Balseiro [9], in which he considers not only maximizing revenues but also
the ad quality. The achievements of this paper consist of developing a RTB platform that evaluates when ranking an
advert, all the indispensable requirements to make possible an adequate advertising ecosystem performance.
We consider our work to be of great interest due to the fact that it is the first article in RTB aimed at improving system
performance by improving the ad selection system. The betting model presented takes into account many factors that
are key to the proper development of the RTB advertising system.
The idea presented in this article can be adapted by the RTB networks, adding or removing some of the variables,
making this model more beneficial for advertisers, improving their experience advertising and, therefore, attracting
new advertisers that increase the volume of business of these platforms.
The rest of the paper is organized as follows. In Section 2, some related studies about RTB and bidding methods
are presented. Section 3 explains the proposed method in general terms and illustrates the structure and each of the
modules that compose the RTB platform, especially the ad selector module (ASM). Then, the main objectives for the
proper functioning of the RTB platform, the rules to prevent online fraud and the penalties to ensure that the common
objectives are met, are defined. Lastly, a methodology to optimize the weights of the ad selection function through a
GA. In Section 4 our experiments are described and a brief analysis of the results obtained are drafted. In Section 5,
the conclusions from our paper and some possible lines of research for future work are presented.
1
This technique is known as microtargeting and it significantly improves advertisers’ profitability by setting up the campaigns
parameter [2].
2A PREPRINT - O CTOBER 26, 2020
2 Discussion of related works
2.1 Origin and structure of the Real-time bidding networks
By working independently, most ANs waste those visits that do not match any of each individual advertiser’s require-
ments. On the contrary, when the ANs share information about the users as well as when they exchange adverts, they
increase the performance.
For example, if a user has left a product in a virtual store but has not yet paid for it, displaying virtual adverts will
significantly increase the likelihood that the purchase will end. If such a user, visits a new page that belongs to the
same advertising platform, they will be able to continue displaying ads in the virtual store2 .
That is why in Internet advertising in recent years a new advertising model has been created that works as a large global
market called RTB where many advertising networks exchange information to increase their performance [10]. On the
other hand, RTB not only improves ANs’ economic performance but also can improve fraud detection, since networks
are able to share information about fraudulent techniques applied by both advertisers and publishers. Moreover, ANs
can also share information about other faced threats such as click-bots3 and click-farms4 [13].
Although the first RTB platforms were created in 2005, the number of advertisers and publishers has skyrocketed [14].
Evidence of this growth is the company DSP Fikisu that aims to have a total of 32 billion impressions per day in 2017
[15].
RTB can be thought of as a global auction mechanism where advertisers compete with each other to display their ad-
verts [14]. In this great market, advertisers make an offer for displaying their adverts on the websites of the publishers.
If an advertiser wins the bid, its advert is displayed instantaneously. In the real-time auctions, the whole process of
auction, acquisition and ad display, takes place in the time a user loads a website (less than 100 milliseconds) [14, 16].
RTB platforms consist mainly of four modules: Demand-Side Platform (DSP), Supply-Side Platform (SSP), Ad Ex-
change (ADX) and Data Exchange (DX), where each module is responsible for a series of very limited tasks [14, 16].
To understand in a general way the role played by each of the models we made the following description: The multiple
ANs are grouped into a single module called ADX with their respective advertisers and publishers [10]. These net-
works exchange user information through a module called DSP that improves the match between the ad and the user by
significantly increasing the performance of the set of networks. The DSP is responsible for supplying advertisers with
impressions that guarantee good performance for their campaigns. For this purpose, it uses algorithms that calculate
the CTR of each impression. The main purpose of the DSP model is to offer a price in each auction that is carried out.
On the other hand, the SSP tries to maximize the economic performance by managing the ad slots of the publishers in
the most efficient way possible. This module distributes the information of each impression among as many networks
as possible and selects the one that offers the higher price.
2.2 Online campaigns optimization
The increase in the volume of advertising in Internet and the amount of data that can be collected from users has made
this area very interesting from the point of view of research. Many of the techniques developed in Data Science have
been successfully applied to this type of advertising.
For example, some studies encourage ANs to apply the well-known machine learning techniques to online auctions
[17]. These models predict in a precise manner the acceptance of a user given an advert so that the probability of
purchase increases considerably. In similar studies, adverts are ranked by the probability of being clicked, in such a
way that the top-ranked adverts are likelier to be displayed [7, 18].
In this line, new methodologies have arisen to improve auctions performance through the optimization of the user and
website parameters so that the most interesting adverts are displayed. To this end, a simulation using GA and CTR
estimation models takes place [19].
Supervised models and deep learning models are frequently applied for optimization in many situations related to
online campaigns [20]. For example, some publishers want to charge a fee regardless of whether users click or not
2
For a better understanding, we can imagine that all the pages belonging to the same advertising platform work as a single
domain ( quote large article RTB).
3
Click-bots are malicious programs that are typically installed on the user’s computer and generate clicks automatically to hurt
the advertising ecosystem [11].
4
The clicks-farms are groups of people who are trained to generate clicks on adverts in a given campaign in order to harm the
owner [12].
3A PREPRINT - O CTOBER 26, 2020
on the advert, while some advertisers only want to pay if a click is generated. This problem can be solved using an
intermediate role called “arbitrageurs”, and its success depends on how accurate the CTR estimations are [21].
Finally, an interesting approach related to the presented paper consists of focusing on optimizing advertisers’ satisfac-
tion rather than only considering economic performance. This is the premise that advertisers are more willing to do
future investments in a particular advertising channel if they obtained a good performance.
The Ad selection process can be seen as a combined optimization problem treated as a stochastic control problem.
Policies for online advert allocation have been developed based on placement quality and advertisers’ CPC bids [9]. In
this respect, the studies of Balseiro [9] should be emphasized, since he makes a deep analysis of the balance that must
exist between both economic performance by selecting the most profitable advert, and the quality of service offered to
advertisers.
2.3 Real-time bidding optimization approaches
Generally, when we talk about optimizing RTB, we think about optimizing advertisers’ campaigns through the price
offered for each impression. This has been a recurring topic in the literature related to RTB.
To not extend too much we will give two examples. First, Manxing Du, et al. [22] increase the number of clicks
of campaigns with low budget by applying a methodology based on Constrained Markov Decision Process, where
the state is the estimated CTR, the action is the bid price and the reward is whether or not a click is generated.
Second, Kuang-Chih, Lee et al. [23] have another proposal to improve the RTB campaigns by selecting high-quality
impressions. The idea they propose is that because conversions occur rarely and when they occur there is a delay
in time, the most convenient is to spend the budget little by little to reach an audience as wide as possible. Along
with this, each time an impression is displayed, its performance is evaluated to take into account in the future the
impressions that improve the performance of the campaign.
In order to calculate the optimal price, the RTB methodologies are based on the predictions of models that estimate
the CTR. So some research focuses on improving the accuracy of the models, which automatically improve the per-
formance of betting strategies [24].
It is also possible to improve the performance of the RTB systems by optimizing the SSP module, that is, trying to
maximize publishers’ profits. In this sense, Shuai Yuan et al. [25] focus on fixing the reserve price or the floor price,
which is the price below which the publisher is not willing to sell. Increasing this price means that, in some cases, the
winners, instead of having to pay the price of the second highest bet, they have to pay the reserve price. In addition, in
other cases, it will make some advertisers automatically raise their bets to get impressions. It is important not to raise
the price too high since it could trigger the number of impressions that remain unsold.
Since Google introduced its Pay-per-click system in 2002, several studies have emerged in relation to online advertis-
ing payment methods. In the well-known Generalized Second-price (GSP) system, the highest bid wins the auction
and the bidder pays a price equal to the second highest amount bidden [7, 18]. Even the GSP is not a verifiable auction
system it continues to be one of the most implemented auction mechanism.
In this research, we propose to optimize the function to select an advertisement based not only on the economic aspect
but we take into account a set of objectives such as the satisfaction of the publishers and the reduction of fraud (for
more details see section 3) for the advertising ecosystem to work properly.
3 Our novel Advertising Exchange System
The proposed AdX system implements an Advert Selection Function (ASF) that evaluates the necessary objectives
for a proper system functioning. The objectives of our system are advertisers’ impression percentage, spam advertis-
ers, campaigns profitability, advertising network balance, publishers’ click-fraud, and income maximization. These
objectives are described in detail in subsection 3.2. It seems of most importance to us to develop a system aimed at
the satisfaction of all the roles involved in online advertising rather than a system only focused on the selection of the
most cost-effective advert.
In order to implement our AdX system, one variable will be used to represent each objective and one weight will be
used to model each objective’s importance in the advert selection formula, as expressed in equation 3. The weights
are optimized through a genetic algorithm (GA) according to the system’s performance. The GA uses the system’s
performance, expressed in economic terms, as the fitness value. The fitness value is calculated by subtracting the total
penalizations (P en1 , ..., P en5 ) from the total income derived from the system. Our methodology is able to find the
best values for the weights, given any configuration.
4A PREPRINT - O CTOBER 26, 2020
Figure 1: Advertising Exchange System structure. The AdX consists basically of the AES and all the ANs that take
part in the exchange of adverts.
The best weights are those that maximize the income while minimizing the sum of all the penalties. Penalties are
economic sanctions that are applied when a goal is not met. The less an objective is met the higher the associated
penalty will be.
The value of these weights can be calculated offline and then the system configuration can be updated periodically.
Our methodology is able to find the optimal weights using a GA from the definition of the objectives, the penalties,
and the rules in order to prevent online fraud.
As it is shown in Figure 1, in our proposed system, all ANs exchange adverts among themselves through the Adver-
tising Exchange System (AES).
The most important AES processes are: selecting the best advert from among all the candidates, keeping the fraud
detection system updated and managing collections and payments from advertisers and publishers [26, 27].
3.1 Advertising Exchange System
In order to develop the AdX, we propose the AES shown in Figure 2. The designed AdX uses the CPC payment
model5 . It is composed of four interconnected and interdependent modules: the CTR estimation module, the Fraud
Detection module, the ASM and the database. Each module is designed for a different purpose and all of them are
needed to make the advertising exchange possible.
The most important module is the Advert Selector. The other three modules (CTR estimation, Fraud detection and
Database module) provide the necessary information so that the Advert Selector can choose the advert with the highest
performance.
3.1.1 Module 1: CTR estimation
The CTR of an advert is calculated as the ratio between the number of clicks and the number of impressions. But in the
case of a single visit, the CTR can be computed as the probability that a user generates a click on the advert displayed
on a website. This probability is expressed as a real number lying within the range [0,1]. Accurately estimating the
CTR of an advert is one of the biggest challenges of online advertising [29].
Bearing in mind that we implement the CPC payment method in this system, the ANs need to give priority to the most
profitable adverts in order to maximize their income.
Machine Learning has been applied with great success in classification problems such as image and sound recognition
[30], digital forensics [31] or CTR estimation [32]. In the case of CTR estimation, the dataset for machine learning
methods contains data fields with users’ features and websites’ features such as advert size, advert position or category
5
The CPC is the most widespread payment model and using several payment systems would greatly complicate the problem
[28].
5A PREPRINT - O CTOBER 26, 2020
Figure 2: Advertising Exchange System structure. The AES is the cornerstone of our system since it performs all the
necessary functions for an appropriate advert exchange.
of the page. The output of the model is “1” when the user generates a click and “0” when the user does not generate a
click. We should clarify that, rather than predicting the class model, what is predicted is the probability that the output
belongs to the class “1” in the [0,1] range.
3.1.2 Module 2: Fraud Detection
The Fraud Detection module informs about the probability of an advert being spam and the probability of a click
being fraudulent. The Fraud Detection module is designed to measure the probability of an advert being spam and the
probability of a click on the advert of a publisher’s website being fraudulent.
The probability of fraud in both cases can be expressed as a real number within the range [0,1], r ∈ R, r ∈ [0, 1]. As
we have mentioned previously, calculating the probability of fraud is a highly complex process. Therefore, it becomes
very difficult to determine when a person is committing fraud from a single click or from a single advert impression.
To assess whether an advertiser or a publisher is cheating, it is necessary to evaluate a large enough set of clicks or
advert impressions6 .
Moreover, the models that determine the probability of fraud would have to take into account the historical publishers’
clicks and advertisers’ impressions. In the case of spam adverts, some information regarding advertisers should also
be considered, such as the duration of the advertisers’ campaigns, the type of products he/she advertises, the adverts’
CTR or the users’ behavior when the advert is displayed [34].
In the case of click-fraud, some publisher’s features should be examined [35]. Furthermore, data about the users who
visited the page need to be collected. Some important factors involved in detecting click-fraud are IP distribution,
most visiting hours, publisher’s CTR, countries and cities with more visits to the page, the type of users who obtain
access7 and users’ behavior before and after generating a click [37]. The probability P of an advert or a publisher’s
click Adi being fraudulent can be expressed as P (Adi |f raud) = α, and P (Adi |not f raud) = 1 − P (Adi |f raud).
3.1.3 Module 3: Database for algorithm execution
The database records all the necessary information to carry out all the processes involved in online advertising. The
database stores all the required information about advertisers, publishers, and ANs to allow the ASM to work optimally.
The most important data stored in the database consists of information related to the advertisers’ payments and the
publishers’ charges.
In addition, information about any fraud committed and information used by the ASF such as the advert CTR and the
advert CPC fixed by each advertiser is also stored in the database. In the same way, whenever a user makes a visit to
a page, an advert is displayed and the database is updated. The value of the probability that the click is fraudulent and
that the advertisement is spam is also updated.
6
This is the case of Google, which does not give a payment to publishers until they reach a sufficient number of clicks that
allows determining with great precision whether the publisher is fraudulent [33].
7
The access to a website can be direct, through a link on another page or through a search engine [36].
6A PREPRINT - O CTOBER 26, 2020
3.1.4 Module 4: Advertiser selection module
Whenever a user accesses a publisher’s website a selection from among all adverts takes place. All adverts belonging
to a different category from that of the publisher’s website that is being accessed are discarded. Those adverts which
are not discarded are called candidates. Then, only one advert from among all the candidates is selected, that is, the
one that possesses the maximum Ad Rank value. To select the best advert we apply the z(Advert) function, which
assigns a real value in the range [0,1] to all candidate adverts. The Ad Rank is explained in detail in subsection 3.2.4.
The z(Advert) function includes weights which are assigned in proportion to the importance of each objective. The
Ad Rank is calculated considering all the AdX objectives. As can be seen in Figure 2, this module takes into ac-
count both the CTR and the likelihood of advertisers and publishers being fraudulent. It also consults and updates the
database where information about advertisers’ campaigns, AN balance, publishers’ account status and ANs’ perfor-
mance is stored.
3.2 Development of the Advertisement Exchange System
To develop the AdX we followed the following steps. First, we defined the necessary objectives in order to ensure the
proper functioning of the publicity ecosystem. To ensure that objectives are met, we defined one economic penalty for
each objective, in such a way that the more the objectives remain unmet, the greater the penalties sum will be.
In addition, we created a set of rules in order to prevent the AdX from fraudulent activities. We established a metric
expressed in economic terms in order to measure the AdX performance. Finally, we developed Algorithm 2 for the
ASF and we defined a methodology to find the optimal configuration of weights using a GA.
3.2.1 Definition of the objectives for the AdX
Several objectives should be met in order to have a successful AdX [38] where the optimization of some objectives
may lead to the detriment of others. For example, the AdX should generate profits to the publishers as high as possible.
But, at the same time, the AdX should not charge advertisers a price so high that their campaigns become unprofitable.
The objectives of the algorithm comprising all adverts adi belonging to advertisers advi ∈ Adv, and all publishers
pubi ∈ P ub of the ANi , where ANi ∈ AdX, are:
• (O1) Advertisers’ impression percentage: All advertisers need to display a reasonable amount of adverts
so that all of them are satisfied. If the algorithm focuses just on maximizing the income of the AdX, then
some advertisers may be left with no impressions. Thus, we should guarantee an equitable distribution of the
advert impression number where advertisers paying a higher price have the advantage that their adverts are
more frequently displayed.
• (O2) Spam advertisers: Many advertisers display adverts on the Internet with malicious intent. These
adverts are known as spam8 . Spam advertisers are very detrimental to the online advertising ecosystem and
so, we should calculate the probability that an advert is spam. We expect to reduce as much as possible the
instances in which they are displayed. In case of implementing the system, we should also have a team in
charge of verifying if an advertiser is trying to mislead users whenever the system alerts that an advertiser
may be cheating.
• (O3) Campaigns profitability: Some inexperienced advertisers may pay for their campaigns a price above
the prevailing market price. It is not advisable to take advantage of this kind of advertisers by charging them
a higher price. Our AdX should make profitable campaigns for all kinds of advertisers. Hence, we need to
ensure that in our AdX, the advert prices are similar to those in the market, that is P rizead w P ricemkt .
• (O4) Advertising network balance: Through collaboration, all ANs should make it possible for other ANs
to display adverts in other ANs. If we want all ANs to participate in the AdX then the number of adverts
received by each ANs should be similar to the number of adverts delivered, that is, Advrec − Advdel w 0.
• (O5) Publishers’ click-fraud: Fraud committed by publishers is known as click-fraud and it can become very
harmful to advertising campaigns. These fraudulent clicks are not generated by a genuine user interested in
the product9 . Due to click-fraud, advertisers end up paying for clicks that do not bring any benefit. This
8
Spam adverts sometimes redirect users to sites infected with a virus. They also make false products offers with a price below
the market in order to cheat users to obtain confidential data such as bank account codes, email passwords or personal information.
In other cases, spam advertisers run a script to install malware or a Trojan program on users’ computers [39].
9
They are performed with the intent of increasing the publishers’ revenues or of harming the online platform. Many publishers
may click on their own adverts or tell their friends to do so. There are also clicks made by click-bots which goal is to harm the
advertising ecosystem [13, 40].
7A PREPRINT - O CTOBER 26, 2020
increases the likelihood that advertisers shift to another ANs offering more profitable campaigns. Thus, we
should avoid displaying in the AdX spam adverts.
• (O6) Income maximization: This is the most important goal, but we place it in the last position because each
of the previous objectives has an associated penalty for it except this one. The Advert Selector algorithm
should look for the most profitable adverts in order to distribute the highest amount of revenue possible
among all publishers. The income value represents the money collected from the advertisers. Publishers
should obtain reasonable economic returns so that they are discouraged from moving to other platforms and
encouraged to recruit new advertisers.
3.2.2 Economic penalties for the AdX
To ensure that the objectives are met we define an economic penalty P eni and a coefficient Xi associated with each
penalty, for each of the first five objectives Obji , where i = 1, ..., 5. In such a way that each penalty is applied
whenever its corresponding AdX objective is not met. The rationale behind these penalties is that those participants
(ANs, advertisers, and publishers) who are not satisfied with the AdX usually leave the platform, which translates into
economic losses. The Xi coefficients allow us to increase or diminish the economic penalization that is applied when
a goal is not met.
The five penalties we have defined are:
• (P1) Impression advert percentage: We must apply a penalty for each advertiser that fails to display a
sufficient number of adverts. P1 can be expressed as “For each advertiser whose average ratio of advert
impressions lies below 25%, we will subtract X1 times the average proceeds of the advertisers in these ANs
from the total Income”.
• (P2) Spam advertisers: We can define P2 as: “For each click from a spam advertiser we will deduct X2
times the money generated by these clicks from the total Incomes”.
• (P3) Campaign profitability: We want to avoid any abuse against inexperienced advertisers who may be
made to pay a price above the market price. P3 can be expressed as “For each advertiser who pays a price
25% above the market price for his/her campaign, we will deduct X3 times the money generated by that
advertiser from the total Income”.
• (P4) Advertising network balance: When an AN is not satisfied, it may stop working with the platform.
Therefore, P4 is expressed as “For each AN that receives 25% fewer adverts than the number of adverts it
delivers, we will reduce X4 times the incomes of that AN to the total Incomes”.
• (P5) Publishers’ click-fraud: As mentioned previously, click-fraud makes advertisers’ campaigns fail. To
avoid this, we created the following penalty P5: “For each fraudulent click from a publisher, we will deduct
X5 times the value of this click from total Income”.
3.2.3 Online Fraud AdX Actions
We should highlight that in our present study, fraud is not just considered as an economic issue but also as an ethical
issue. Therefore, we must define a set of policies and rules oriented towards respecting their interests.
AdX Policies: Any publisher who wants to participate in the business must accept several AdX policies aimed at
reducing fraud to the greatest extent possible, so that the advertising habitat may be protected. These policies seek to
expel publishers before they receive any payment if the system’s expert group determines that fraud was intentionally
committed. Additionally, we could consider imposing fines on advertisers who use the platform to deliver spam adverts
and to all those publishers who use black-hat techniques in order to increase their income.
AdX Rules: In addition to the AdX policies, we defined a set of rules focusing on preventing fraud. These rules set
clear-cut criteria for expelling from the AdX those publishers, advertisers or ANs who commit fraud. The difference
between the rules and the penalties is that infringement of rules leads to expulsion from the AdX platform while
penalties are used to undermine the performance when objectives have not been met. In order to make the algorithm
more efficient, we only check the rules that lead to expulsion for each N visits, where N = 1, 000.
The rules that we define are:
• (R1) Fraudulent advertisers: To dissuade advertisers from trying to display spam adverts we defined the
following rule: “If an advertiser commits fraud on more than 20% of his/her adverts and the number of
adverts is greater than 200 then he/she will be expelled”
8A PREPRINT - O CTOBER 26, 2020
• (R2) Fraudulent publishers: We expel those publishers whose malicious clicks amount to a certain percent-
age above a predetermined threshold µ. Hence, we defined the following rule: “If a publisher commits fraud
on more than 20% of his/her clicks and the number of clicks is higher than a specific threshold, in our case
30, then the publisher will be expelled”.
• (R3) Fraudulent ANs: To discourage ANs from allowing their publishers and advertisers to commit fraud
so as to win more money, we defined the following rule: “If 20% or more of the members of an AN are
fraudulent advertisers or fraudulent publishers, and the number of visits is greater than V, where V = 2, 000,
then the AN will be expelled from the platform”.
3.2.4 Advert Selector Module
In order to optimize the performance of the algorithm tasked with selecting an advert, we should define a function to
evaluate all the objectives defined above according to the pre-established economic metric. Since the system has six
objectives, the ASF also has six variables. Each variable is normalized and can be expressed as a real number within
the range [0,1].
The weights assigned to each variable are represented by θi , in such a way that they satisfy the equation 1. These
weights do not have to be updated for each visit because this would lead to a very high computational cost. The values
of these weights can be recalculated offline every few days. In addition, to ensure that the values of the weights are
reliable, they must be calculated over a sufficiently large number of visits, since a small number of visits might not
represent well the overall advert network behavior.
The weights’ optimal value for a network may vary depending on multiple factors such as the number of advertisers,
the number of publishers, the number of ANs, the average click-fraud and the spam adverts within the AdX.
6
X
θi = 1 (1)
i=1
To determine the best advert to be displayed on each user visit we assign to each advert the Ad Rank value.
The Ad Rank is recalculated for each candidate advert each time a user visits a publisher’s website applying the
z(Advert) function as expressed in equation 3.
Ad Rank ← z(Advert) (2)
z(Advert) = (θ1 × AN Satisf action) + (θ2 × Advertiser Satisf action)
+(θ3 × Spam Adverts) + (θ4 × Campaign Cost) (3)
+(θ5 × F raud P ublisher) + (θ6 × Ad V alue)
We now describe each of the variables representing the objectives of the AdX system:
1. AN Satisfaction: It expresses the satisfaction of the members of the network represented by the ratio be-
tween adverts received and adverts delivered. We should give priority to the advertisers from the unbalanced
networks. The closer the value of this variable is to “1”, the more dissatisfied are the members of the net-
work. Hence, we should try to help those networks that are most dissatisfied. The values of the variables are
normalized to the range [0,1] using equation 4 to give priority to unbalanced ANs.
Received V isits
AN Satisf action = 1 − (4)
(Received V isits + Delivered V isits)
2. Advertiser Satisfaction: As expressed in equation 5, this variable measures the satisfaction of an advertiser
according to the number of impressions each advertiser obtains. The closer to “1” the value of the variable is,
the more discontent the advertiser will be. Therefore, we must give priority to those advertisers by displaying
their adverts.
P otential V isits
Advertiser Satisf action = × Ad V alue (5)
(P otential V isits + Received V isits)
3. Spam Adverts: This variable represents the probability that an advert is of spam type. The likelier an advert
is to be spam, the closer to zero the value of this variable will be. Therefore, spam ads are less likely to be
shown.
9A PREPRINT - O CTOBER 26, 2020
4. Campaign Cost: The price of a campaign must be similar to the general market price. If an advertiser pays
a price above the market price, the value of this variable will get closer to zero, as expressed in equation 6.
Advertiser P rice
Campaign Cost = (6)
(Advertiser P rice + Real P rice)
5. Fraud Publisher: It represents the probability that a click is fraudulent. The likelier the publisher is to be
fraudulent, the closer to zero its value will be.
6. Ad Value: It represents the price the advertiser is willing to pay and it is calculated by equation 7. The closer
to “1”, the greater the price the advertiser is willing to pay will be. To normalize the value of this variable we
divide the price the advertiser is willing to pay by the maximum value of the category.
CP C Advertiser
Ad V alue = CT R × (7)
M ax(Category CP C Advertiser)
3.2.5 Measuring the Advertising Exchange System performance
In order to measure the AdX performance, we have established a metric expressed in economic terms. As expressed
in equation 8, the AdX performance is given by the difference between all the AdX incomes and the sum of all the
penalties. The algorithm tries to maximize the AdX incomes, but at the same time it tries to achieve all the objectives
in order to minimize the AdX penalty value so that the AdX performance value will be as high as possible.
AdX P erf ormance = AdX Incomes – AdX P enalties (8)
The AdX Incomes represents the money collected from all advertisers from displaying their adverts, which is equal
to the sum of the value of all clicks, as expressed in equation 9.
N
X
AdX Incomes = Click P rice (j) (9)
j=1
AdX P enalties is the sum total of all penalties, as expressed in equation 10, and it represents the financial penalty
derived from not fulfilling the AdX objectives.
5
X
AdX P enalties = P enalty (i) (10)
i=1
3.2.6 Mathematical system description
Let us define a set of ANs as AN s =< AN 1 , AN 2 , ..., AN n >, with n number of ANs where each AN n has a list
of advertisers Adj such that ∃Adj ∈ AN n , a set of publishers such that ∃P bk ∈ AN n and a set of visits such that
∃v l ∈ AN n .
Each Adj is defined by a set of adverts Adj =< a1 , ..., am >, where Adj ⊆ A and (ai ∈ Adj ∧ ai ∈
/ Adm ), and A is
the set comprising all the adverts. Finally, V is the set of visits ∀vi ∈ V ; ∀AN s.
The selected advert ai is the advert belonging to the
n advert set0 A =< a1 , ..., am >oand also ai ∈ Adj which leads
0 0
to the maximum income I, that is, select A = ai | ai ∈ A ∧ A ⊆ A ∴ ai ∈ A . We must maximize the total
"N #
X
ai ai
Incomes Ik and minimize the sum of all penalties Pk for all adverts ai from ANk , that is, M ax (I k − P k )
k=1
where N is the number of ANs, ANk with k =< 1, ..., N >, for an advert ai ∈ Adj and a ANk this system is subject
to:
• F raud (ai ) > 0 : There is fraud on the part of the advertiser.
• F raud (pi ) > 0 : There is fraud on the part of the publisher, where pi ∈ P and P is the set of publishers.
• CT R aki = CT R aki × ϕj and ϕj represents the number of categories of ai with ϕj ≤ p where p is the number
of categories Cj and j =< 1, ..., p > ∧ϕ ∈ R.
10A PREPRINT - O CTOBER 26, 2020
Figure 3: Weight codification using individuals of a GA.
• CT R aki = zai (x1 , x2 , . . . , xw ) where X = (x| xw ) is an advertiser feature ai .
• I aki = [(Click × CT R aki ) × P rice Click
ai
] × tc ai − (ep ai × M ai ) where tc is the total number of clicks on
the advert, ep is the Income received by the publisher per click, M is the number of samples for the adverts
and Pz is the corresponding penalty, and:
6
X
I aki = θi
i=1
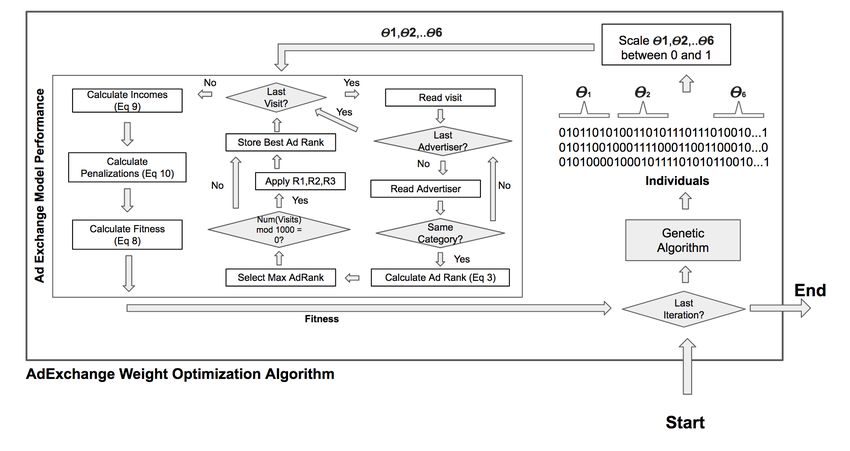
4 Calculating the optimal value of the weights using a Genetic Algorithm
Each variable of the ASF represents one criterion and it is multiplied by a weight such that the sum total of all the
weights equals “1”, as expressed in equation 1. To obtain the optimal value for all weights, we applied optimization
techniques based on GAs.
Each time a visit occurs on a publisher’s site within the AdX, the ASM selects only one advert from among the
candidates. Algorithm 2 is in charge of taking into account all the objectives and updating the variables used by the
ASF.
The optimal weight configuration is the combination that generates the highest AdX performance according to the
established metric. Algorithm 2 returns the AdX performance for a given weight configuration. We can think of
Figure 4 as a small module that returns the performance of the system (fitness of a GA function) according to the
weights that are introduced as inputs. In order to find out the best weight configuration we apply a GA with the
following components.
4.1 Representation and initial population
As genotype, we use a binary fixed length representation. As it can be seen in Figure 3, we used a length of 48 bits
to represent each weight. Therefore, each weight can be represented with a value between 0 and 248 − 1, which is a
very high precision. Each individual I of the population is formed by the six weights and it is represented by a string
of (6 × 48 bits = 288 bits) binary digits. The initial population is obtained at random with a uniform distribution.
The size of the population is 100 in order to obtain diversity and an appropriate time of convergence [41]. The number
of generations is 100 (Number of iterations in the stop criteria). Genetic algorithms have been used in optimization
problems in various domains i.e. optimizing COVID-19 pandemic government actions [42, 43] .Therefore, the number
of evaluations for the function goal is 10,000 (100 individuals × 100 generations = 100, 000 evaluations). In some
experiments, this number of assessments has been appropriate for the stabilization of the algorithm [41].
4.2 Handling constraints
The genotype used to represent solutions does not satisfy the constraint that all weights add up to “1”. However, an
individual genotype IG is a string of random binary digits can be converted in six integer numbers, which is called
individual phenotype IP , where each integer is in the range [0, 248 − 1].
Once the individual IG has been decoded into the individual IP , it can be easily transformed into a new array, called
repaired individual IR, that satisfies the constraint (all numbers are in the range [0,1] and add up to one) applying
Algorithm 1.
The repaired individual IR should be calculated as a prior step to the evaluation of the individual. In this way, the
constraint is always satisfied without the need to design specialized operators for solution initialization, crossover or
mutation.
11A PREPRINT - O CTOBER 26, 2020
Algorithm 1 Repair algorithm.
Input: Individual IP
Output: Repaired individual IR
Sum ← 0
for i = 1 to 6 do
sum = sum + IP [i];
end for
for i = 1 to 6 do
IR[i] = IP [i]/sum;
end for
return IR
4.3 Fitness function
To calculate the fitness of each individual of the population I, the following steps are performed:
• Obtaining the repaired individual IR (array of 6 real numbers in [0,1] that satisfies the constraint) of the
individual IP .
• Calculating the fitness value using equation 11.
N
X 5
X
F itness(IR) = Click P rice IR (j) − P enalty IR (i) (11)
j=1 i=1
4.4 Genetic Algorithm parameter configuration
We use “Double-point” for the crossover operator, that is, we select two points among which the genes of the indi-
viduals are interchanged. The parameter “Elitism percentage” is set to 5%. The parent selection method used is the
“roulette wheel” (proportional selection and stochastic sampling with replacement). The replacement used method
is “Generational replacement” in which a completely new population is generated with new children from existing
parents via crossover and mutation.
We applied similar parameters to the simple design GA proposed in Goldberg et al. [41]. The main reason is that our
GA entails a high selective pressure (in comparison with other techniques of selection and generation replacement are
a binary tournament or replacing steady-state) that takes a reasonable convergence time for our available computing
capacity [44].
Since we used a binary simple representation and the constraint management does not require specialized operators,
we consider to be appropriate the crossing and the uniform mutation operators proposed in Goldberg et al. [41].
To find the best combination values, the mutation probability, and the crossover probability are tested in the first
configuration, which uses 10 ANs, with values from 0.1 to 1 with increments of 0.1. Therefore, we try 100 different
combinations as expressed in Table 2. To calculate the best combination we chose the best average configuration after
executing the algorithm 10 times. Once the best combination is selected, we run the algorithm 30 times and then we
calculated the average of the fitness function. The time required for each execution to take place is of approximately
14 minutes and 25 seconds.
4.5 Justification for the chosen values of the coefficients, penalties and rules
Click-fraud, spam adverts, and unsatisfied advertisers are factors that hurt the advertising ecosystem. However, deter-
mining the exact value of their negative impact on the AdX is a very complex task. Even these values were calculated,
we still cannot ensure that they will be optimal for a long time because the scenario could change quickly.
Therefore, finding the optimal configuration for all thresholds is out of the scope of our work and, for this reason,
these values have been configured manually. However, we can briefly explain why we have configured the followings
variables: 1) the coefficients (X1 , ..., X5 ) associated with each penalty, 2) the thresholds above which penalties are
applied and 3) the conditions of each rule to expel a role from the platform.
12A PREPRINT - O CTOBER 26, 2020
Algorithm 2 Advertising exchange system algorithm.
P6
Input: ( i=1 θi = 1 : values), Data: Advertisers, publishers, ANs and users
Output: F itness
1: for all visi ∈ V is do . For all visits
2: for all advi ∈ Adv do . For all advertisers
3: if (Category (V isit) = Category (Advert)) then . Advert value calculation Function
4: Ad V alue ← F ((θ1 × AN Satis) + (θ2 × Adv. Satis) + (θ3 × Spam Adverts)
+ (θ4 × Camp Cost) + (θ5 × F raud P ublisher) + (θ6 × Ad V alue))
5: end if
6: if (Ad V alue > M ax) then . Selects the best advertiser among all possibles
7: M ax ← Ad V alue
8: Selected Ad ← Adj
9: end if
10: end for
11: if (N um (V isits) mod 1000 = 0) then . For each 1000 visits update parameters
12: peni ∈ P en, advi ∈ Adv, ani ∈ AN s ← UpdateParameters() . Updates all roles parameters
13: Apply Rule 1(pubi ∈ P ub, Advj ) . It checks if there are cheats publishers and ejects them
14: Apply Rule 2(advi ∈ Adv, Advj ) . It checks if there are cheats advertisers and ejects them
15: Apply Rule 3(ANi ∈ AN s, Advj ) . It checks if there are cheats ANs and ejects them
16: end if
17: end for
18: Calculate the value of the variables: Incomes, P en1 , P en2 , P en3 , P en4 , P en5
19: F itness ← Incomes − (P en1 + P en2 + P en3 + P en4 + P en5 )
20: Return F itness
Figure 4: Advert exchange weight optimization algorithm using genetic algorithms.
13A PREPRINT - O CTOBER 26, 2020
The thresholds of the penalties P en1 , P en3 and P en4 , representing the satisfaction degree, are configured to approx-
imately 0.25%.
Penalties P en2 and P en5 refer to click-fraud and spam adverts, respectively. In penalties P en2 and P en5 , 1/2 times
the revenue obtained by the fraudulent clicks and the spam adverts is subtracted to the total income.
With regards to the thresholds of the rules, we decided to expel from the AdX system all those ANs, publishers or
advertisers committing more than 20% of fraud. In order to decide if a party involved in the system has committed
fraud, it is necessary to analyze a large enough set of clicks or adverts.
In order to do this, we define the followings conditions. For publishers, the number of fraudulent clicks must be
greater than 30. For advertisers, the number of adverts must be greater than 200. For ANs, the number of visits must
be greater than 2,000. If instead of analyzing 150,000 visits, we analyze 10 million, the threshold values will have to
be higher.
5 Experiments and results
To prove that our system is valuable, we compared in experiment I the performance of the GA system with the
extended GSP method. After applying the GSP method, we applied the penalties defined in our system. Finally, the
aim of experiment II is to demonstrate that our GA is capable of adjusting the values of its weights to the new system
configuration.
5.1 Preparation of the experiments
Our system takes into account many parameters to select an advert such as spam adverts, CTR, fraudulent publishers,
the bid price and so on. There are some data sets covering one of the considered aspects, but they are far from what
we need. For this reason, to perform the experiments, both the visits and the configuration of each of the advertisers
of all ANs have been simulated.
In this work, we launched an experiment that would help us to understand the importance of each variable when
the value of the penalty remains constant. To find the optimum values of the weights, we applied a GA. The GA is
implemented in the environment Visual Studio C# version 12.0.31101.00 Update 4, on a computer with the following
features: Intel®Core i5-2400 CPU@3.10 GHz with 16 Gb RAM, with the operating system Windows 7 Pro, Service
Pack 1, 64 bit.
We have used the Genetic Algorithm Framework (GAF) package for C#10 to implement the GA. The GAF package
was designed to be the simplest way to implement a GA in C#. It includes good documentation and a variety of
functions for crossover, mutation and selection operators. In addition, it allows the customization of the operator
functions by the developer.
For achieving a deep evaluation of our proposed GA, we run the experiments I and II. We developed an environment
of AdX with the following configurations. The percentage of an advert of being spam is randomly set within the range
from 13% to 16%. The percentage of the publisher being fraudulent is randomly set with values in the range from 17%
to 20%. The price the advertiser is willing to pay and the advert’s real value are randomly set with values between 0.2
and 1.2 dollars. In the same way, the CTR value of an advert is randomly set in the range [0,1].
We used in experiments I the following number of ANs: 10, 20, 30, 40 and 50. Therefore, five different configurations
are tested where each AN has 10 advertisers, 100 publishers and 150,000 user visits. Finally, each publisher’s page
may belong to one of the 20 different categories and an advert can only be displayed in the pages with the same
category.
In the first experiment, we compared the system performance both for the cases when ANs collaborate with each
other and when they operate independently, by applying the famous GSP auction method [46, 47]. We conducted five
configurations for the collaborative system and five for the independent system.
The GSP selects the advert with a higher price and the advertiser is charged with the value of the second priciest advert.
Our system is focused on a collaborative AdX, so it would make no sense to apply the penalties when ANs operate
independently. Therefore, we will not use the GA since there are no weights to be optimized in the ASF.
In this experiment, we have compared the profits obtained in the independent and in the collaborative AdXs using the
GSP methods. The average values of 30 executions are shown in Table 1. The sum total of all income when ANs
10
The GAF is a .net/Mono assembly, freely available via NuGet, that allows implementing GA in the environment of program-
ming C# using only a few lines of code [45].
14A PREPRINT - O CTOBER 26, 2020
Figure 5: Experiment I: Obtained profits by the Independent and the Collaborative systems using five configurations.
operate independently is 375,886.80$ and 810,454.93$ when they collaborate with each other. This is an increase of a
215.61%.
When ANs work independently, the AdX displays only those adverts that belong to the AN which the user is visiting.
However, when ANs collaborate with each other, adverts from any AN can be displayed.
If the AdX can choose an advertiser out of several networks instead of from only one, the results will be much better.
As can be seen in Figure 5, the obtained profit when ANs collaborate is much higher than when they do not.
Table 1: Results of the GA and the GSP systems.
Nº of ANs 10 20 30 40 50
Independent 25,149.36 50,039.76 75,402.54 100,097.97 125,197.18
Collaborative 55,811.83 110,588.53 164,773.42 216,562.86 262,718.30
5.2 Experiment I
In the second experiment, we configured the GA with the following settings. We set the coefficient value associated
with each penalty as follows x1 = x2 = x3 = x4 = x5 = 0.5. Assigning to all weights the same value allows us to
see more clearly the relative importance of each objective.
These values are calculated by using the average value of ten different experiments for each probability combination.
As shown in Table 2, the best probability combination consists of a crossover probability of 0.7 and a mutation
probability of 0.2. Once we calculated the best combination, we executed the algorithm 30 times and we calculated
the average. The results are shown in Table 3.
The optimal values of the weights in the first configuration, which uses 10 ANs, for the best fitness function are shown
in Figure 7. We have ordered the variables in descending order according to their importance.
15A PREPRINT - O CTOBER 26, 2020
Crossover prob.
0.1 0.2 0.3 0.4 0.5 0.6 0.7 0.8 0.9 1
0.1 9,920.4 9,971.5 9,711.7 9,997.3 9,783.6 9,763.8 10,018.1 9,893.0 9,750.1 9,898.5
0.2 5,016.2 9,538.9 9,761.9 9,753.2 9,737.0 10,012.7 10,032.3 9,532.8 9,775.0 9,785.7
Mutation prob.
0.3 9,509.8 9,757.2 9,810.6 9,630.8 9,804.0 9,808.1 9,493.8 9,803.0 9,693.1 9,606.2
0.4 9,761.3 9,819.3 9,756.6 9,920.3 9,687.9 9,547.6 9,844.0 9,443.6 9,549.6 9,755.2
0.5 9,828.0 9,561.0 9,625.4 9,454.0 9,633.1 9,710.0 9,743.5 9,873.1 9,365.4 9,629.7
0.6 9,717.2 9,813.5 9,310.7 9,730.9 9,430.4 9,929.8 9,761.7 9,525.6 9,436.9 9,671.4
0.7 9,507.1 9,604.4 9,569.9 9,691.2 9,565.6 9,490.1 9,532.3 9,878.3 9,297.7 9,255.0
0.8 9,932.8 9,776.1 9,212.0 9,417.7 9,513.3 9,724.2 9,738.0 9,312.8 9,410.1 9,825.9
0.9 9,681.5 9,383.4 9,490.5 9,732.4 9,708.5 9,691.3 9,755.8 9,454.7 9,534.1 9,532.3
1 9,609.7 9,479.9 9,788.1 9,716.4 9,630.7 9,609.4 9,977.5 9,383.0 9,893.3 9,947.2
Table 2: Fitness value for Crossover and Mutation probability for all possible crossover and mutation probability value
combinations with 0.1 increments ranging from 0.1 to 1. These values are the average value of 10 executions.
Table 3: Average of the GA and the GSP systems for the five configurations.
Nº of ANs 10 20 30 40 50
GA 10,146.59 19,188.95 30,861.78 41,587.55 50,167.97
GSP -26,727.29 -41,331.81 -63,645.60 -100,379.85 -124,853.94
As shown in Figure 6 and in Table 3, the performance of the GSP system is worse than the performance of our GA
system.
This is because the GSP system does not take into account any objective defined for the AdX, but only the economic
performance, and therefore the penalizations are very high. This makes us think that our system is interesting for those
networks that want all their involved parties to be satisfied and want an ecosystem with little fraud.
As can be observed, weights θ4 and θ1 are the most important. We have to keep in mind that the metric used in the
fitness function is defined in economic terms. The weight θ4 is associated with Campaign Cost and it indicates if an
advertiser’s campaign was priced above the market price. If those advertisers who are willing to pay more money for
an advert were to leave the platform, the income would fall dramatically.
On the other hand, θ1 regulates the N etwork Satisf action variable which describes the network satisfaction with
respect to the number of visits received and delivered. If a network leaves the AdX, all publishers and all advertisers
who belong to this network will be lost, and so the costs would be very large.
Figure 6: Experiment I: Comparison between GSP system and our GA system.
16You can also read