A typology of smallholder livestock production systems reflecting the impact of the development of a local milk collection industry: Case study of ...
←
→
Page content transcription
If your browser does not render page correctly, please read the page content below
Habanabakize et al. Pastoralism: Research, Policy and Practice                (2022) 12:22
https://doi.org/10.1186/s13570-022-00234-8
                                                                                                                  Pastoralism: Research, Policy
                                                                                                                                  and Practice

 RESEARCH                                                                                                                                            Open Access

A typology of smallholder livestock
production systems reflecting the impact of
the development of a local milk collection
industry: Case study of Fatick region, Senegal
Ernest Habanabakize1, Koki Ba2, Christian Corniaux3,4, Patrick Cortbaoui1 and Elsa Vasseur1*

  Abstract
  Senegal is a country where millions of livelihoods directly depend on smallholder livestock production activities.
  Unfortunately, these farmers now face the effects of a changing climate and associated societal responses. In addition,
  the lack of understanding of the specific farmers’ problems in their respective production systems by assuming
  homogeneity has led to inappropriate planning of interventions and inefficient utilization of resources. The variations in
  individual farming systems and local contexts require to understand each system separately to inform decision-makers
  and relevant stakeholders about specific entries of intervention for farmers based on customized needs. Using a Fatick
  region case study, different statistical clustering techniques were adopted to develop a livestock typology that reflects
  the above realities. This typology confirmed the co-existence of three livestock production cluster systems with
  differences and similarities in their production targets and quantities, market access, animal breeds, and the livestock
  management system of the animals. The studied region represented a new format of smallholder livestock
  development, where the implementation of a dairy processor and its milk collection centre created a new dynamic in
  production activities. Farmers confirmed that the extension services and a consistent market opportunity provided by
  the dairy processor increased local productivity and offered an alternative source of income but they have also
  reiterated concerns like the dairy processor’s low milk buying prices which need to be addressed. To harness the
  growth and the regional opportunities, there is a need to establish robust and continuous collaboration structures
  between the Government, agro-industries, and producers. These public-private partnerships will help producers lower
  the cost of inputs and services and increase productivity while boosting local dairy production.
  Keywords: Extension services, Milk collection centre, Market opportunities, Farmer clusters

Introduction                                                                            (ANSD 2016). Livestock farming contributes to house-
Senegal is one of the countries in the Sahel region whose                               hold food and nutrition security and occupies nearly
economy is mainly based on the agricultural sector.                                     60% of agricultural households (ANSD 2016), giving it
Livestock farming is practised by 29.5% of Senegalese                                   vital economic and social importance. Consequently,
households (Beye et al. 2019). In 2016, the herd in                                     livestock farming holds an appreciable place in the Sene-
Senegal was estimated to include about 3,541 million                                    galese economy with a contribution of 27.4% to the GDP
cattle, 6,678 million sheep, and 5,704 million goats                                    of the primary sector and 4.2% to the national GDP
                                                                                        (ANSD 2016). It is one of the fastest growing segments
                                                                                        of the agricultural economy, fueled by rising incomes
* Correspondence: elsa.vasseur@mcgill.ca
1
 Faculty of Agriculture and Environmental Sciences, McGill University, 21,111           and technological and structural developments (Diallo
Lakeshore Road, Sainte-Anne-de-Bellevue, QC H9X 3V9, Canada                             2015). Fatick is one of the regions in Senegal where
Full list of author information is available at the end of the article

                                        © The Author(s). 2022 Open Access This article is licensed under a Creative Commons Attribution 4.0 International License,
                                        which permits use, sharing, adaptation, distribution and reproduction in any medium or format, as long as you give
                                        appropriate credit to the original author(s) and the source, provide a link to the Creative Commons licence, and indicate if
                                        changes were made. The images or other third party material in this article are included in the article's Creative Commons
                                        licence, unless indicated otherwise in a credit line to the material. If material is not included in the article's Creative Commons
                                        licence and your intended use is not permitted by statutory regulation or exceeds the permitted use, you will need to obtain
                                        permission directly from the copyright holder. To view a copy of this licence, visit http://creativecommons.org/licenses/by/4.0/.
Habanabakize et al. Pastoralism: Research, Policy and Practice   (2022) 12:22                                            Page 2 of 14

livestock farming is particularly important. Unfortu-                   the development of the milk industry are one of the best
nately, according to recent data from the National                      motivation for farmers to diversify and invest in dairying
Agency of Statistics and Demographics, Fatick region re-                as they offer a safe and profitable market outlet; however,
mains amongst the poorest in the country with a 67.8%                   the success of these initiatives demand the active partici-
poverty index (ANSD 2019), calling for urgent interven-                 pation of farmers, and they require public investment or
tion from the Government and partners. There have                       a public-private partnership (Lemaire et al. 2019; Henrik-
been efforts from the government to enhance milk pro-                   sen 2009). In 2018, 110 producers delivered milk to the
duction in the region, including the support of the im-                 dairy, though more than 500 producers have been identi-
plementation of a milk collection centre by a dairy                     fied in the Fatick milk collection basin (Kirene 2019). In
processor, Kirene Dairy. The latter is part of Kirene                   the same year, the dairy processor collected its highest
group, an agro-industrial company created in 2001 in                    volume of milk in January (6,435 L) and its lowest vol-
Diass (Thiès region), 40 km south-east of Dakar. While                  ume in July (3,189 L) (Kirene 2019). The present study
originally specialized in the manufacture of mineral                    was conducted in the Fatick milk collection basin, where
water, it launched the production of UHT sterilized milk                all the existing production systems in the region are rep-
in 2005. Its processing capacity is 10,000 L of milk per                resented. Previous research studies in the region have fo-
day. Since 2014, Kirene Dairy has also established a milk               cused on the characteristics, challenges, and
collection centre in Fatick region to facilitate milk col-              opportunities of pastoralists who have traditionally been
lection activities. For the rest of the manuscript, Kirene              predominant in Senegal and in the study area (Manoli
Dairy will be referred to as the “dairy processor” in order             et al. 2014; Adriansen 2008; Turner et al. 2016; Kitchell
to reflect their role and not just the name.                            et al. 2014; Boesen et al. 2014; Salmon et al. 2018). Very
   Livestock farming systems in sub-Saharan Africa and                  few studies have looked at the new dynamism of small-
generally in humid tropics exist across a wide range of                 holder livestock production systems in Senegal (Corniaux
cultures and landscapes, and over time, these differences               et al. 2012; Napoléone et al. 2015), and no single study
in drivers and in farm features lead to temporal and                    has explored this new aspect in Fatick region. In the same
spatial variability between and within farming systems.                 vein, a review of the literature (Robinson et al. 2011; Otte
The contextual differences in social, institutional, and                and Chilonda 2002; Ruthenberg et al. 1980; Dugué et al.
biophysical realms result in different responses of                     2004, Dassou et al. 2017) suggests few attempts to create
farmers and communities between and within areas.                       specific typologies of livestock production systems at a
Traditionally, farmers in West Africa own cattle for vari-              national level. Our study will propose a typology and
ous purposes including milk, meat, draft animal power,                  tailor-made recommendations considering these recent
milk and meat transformation activities, belongingness                  changes in Fatick region across the different livestock
to specific ethnic groups, and so forth (Somda et al.                   production systems, which will eventually help in effect-
2004). As such, the farming systems are highly heteroge-                ive and efficient planning and implementation of projects
neous in many characteristics such as farming house-                    in livestock production system development.
holds’ land access, cropping, livestock breeds and assets,                 Despite the invaluable contribution of the livestock
off-farm activities, socio-cultural traits, access to mar-              sector to the economies of both Senegal and Fatick re-
kets, and livelihood orientations amongst other things                  gion, recent years have shown a decline in production
(Chatellier 2019; Camara 2013; Buhl and Homewood                        activities as the sector is confronted with many
2000; Somda et al. 2004). The existing farming system                   challenges. Feed scarcity, prolonged drought, soil
variability is challenging to fully comprehend, leading to              salinization, natural resource degradation, water scarcity,
partial representation of reality and inefficient interven-             and associated societal problems are the most common
tions in project planning and implementation.                           challenges to livestock producers in Fatick region (Dieng
   The milk collection efforts by the dairy processors have             et al. 2014; Zougmoré et al. 2016). The pressure and
brought about a new dynamic for livestock development                   consequences of these problems are not felt the same
through the specialization and intensification of milk                  way across different production systems, and thus, to
production amongst farmers in Fatick. Indeed, the dairy                 overcome these challenges, it is key to understand each
processor has put in place a milk collection centre                     livestock production system separately and propose tar-
equipped with the required infrastructures (tanks, basic                geted solutions based on the differences, opportunities,
quality test tools, moto-bicycles, etc.) to facilitate the              and challenges presented by each system. There is no
milk collection in many areas of Fatick region. Further-                doubt that the needs and urgencies for farmers vary in
more, it has also established a model whereby producers                 their respective production systems, and therefore, cus-
are subsidized with a package of inputs including animal                tomized interventions tailored to specific needs and po-
feed, veterinary services, and training on animal hus-                  tentials presented by each farming system would foster
bandry practices. The presence of dairy processors and                  efficient utilization of resources, help in avoiding
Habanabakize et al. Pastoralism: Research, Policy and Practice   (2022) 12:22                                          Page 3 of 14

duplication of efforts, and respond to direct farmers’                  settlements including 9 communes and 927 official vil-
need and the production system as a whole. Recognizing                  lages. It is bounded to the east by the Kaolack region, to
and understanding variability within and amongst farms                  the west and north-west by the Thies region, to the
and across localities is the first step in the design of pol-           north by the Diourbel region, and to the south by the
icies to help poor farmers and a key one with regard to                 Saloum arm of the sea that bathes Foundiougne. Fatick
the adoptability and performance of new technologies                    covers an area of 6,685 km2 and has a population of
proposed to improve agricultural production (Tittonell                  761,713 inhabitants with a population density of 114 in-
et al. 2010) and that is where typology comes into play.                habitants/km2 (ANSD 2019). The climate is of the
Furthermore, this insight would help policy-makers and                  Sahelo-Sudanese tropical type characterized by 2 sea-
other relevant stakeholders to create solutions that are                sons: a rainy season from mid-June to October (rainfall
economically viable (by targeting the right people with                 ranging from 400 to 600 mm/year), a dry season from
the right inputs) and positively change the livelihoods of              mid-October to mid-June, and a cool period from No-
producers, while minimizing the impact to resources                     vember to January (ANSD 2016). Agriculture employs
depended on for survival.                                               more than 90% of the working population and is the
  The objective of this study is to develop a typology                  mainstay of regional economic activity. Livestock activ-
that will characterize the current livestock production                 ities are practised by 70% of the population (ANSD
systems in Fatick, while highlighting the new dynamic of                2019). The production systems in Fatick largely include
smallholder animal production from the establishment                    traditional methods of agriculture and types of livestock;
of a local dairy industry in the region. This study departs             transhumance is increasingly practised by rural agro-
from two hypotheses: (i) there is a broad range of small-               pastoralists, due to the extension of agricultural areas,
holder livestock producers that may be clustered in sub-                the shrinking of grazing areas, and the progression of
groups sharing common traits (e.g. size of the herd, type               salty land (Robinson et al. 2011). The total number of
of management practices, etc.), challenges (e.g. access to              departmental livestock, all species combined, was esti-
markets, animal feed price, access to water and land,                   mated in 2018 at 104,741 cattle, 156,234 sheep, 170,052
etc.), and opportunities (e.g. closeness to markets and                 goats, 119,845 pigs, 18,786 horses, 10,077 donkeys, and
other extension services, productive species, locally                   1,092,037 family poultry (ANSD 2019). Unfortunately,
adapted species, etc.); (ii) since 2015, the establishment              Fatick region remains amongst the poorest in the coun-
of a dairy processor and its milk collection centre has                 try with a poverty index of 67.8%, compared to 46.7%
brought a new dynamic which could enhance small-                        nationally (ANSD 2019). Difficult access to fodder re-
holder livestock production activities in the area (e.g.                sources, water, prolonged droughts, and the reduction of
possibilities of veterinary and other extension services,               pastoral areas due to salinization and encroachment re-
milk collection industry, market, diversification of live-              main the major challenges for livestock smallholders
stock products including milk, milk products, etc.). This               (Zougmoré et al. 2016; Dieng et al. 2014). Despite these
study adopts a data-driven approach whereby routine                     constraints, livestock production still represents the
husbandry practices of farmers were recorded during in-                 mainstay of the livelihood of smallholder farmers in
terviews and analysed to propose a typology that reflects               Fatick and it represents a big share of the region’s econ-
the current dynamics of livestock production systems in                 omy. Furthermore, the recent initiatives and efforts of
the studied area. This will serve to show the differences,              developing the milk collection industry and markets
similarities, opportunities, and constraints faced by                   have an impact on the future of the livestock production
farmers in their respective production clusters across the              systems in Fatick; all of the above make the study zone
study area and hence propose recommendations. The                       an interesting case study to explore and understand how
developed typology will also serve as a point of entry                  the production systems have changed and what the
during intervention planning and provide a focalized                    whole dynamic means to the livestock farmers.
scheme for decision-makers and other stakeholders,
based on customized needs for each type of farmer.                      Data collection and handling
                                                                        From the Regional Livestock Department database, 100
Methodology                                                             farmers from across the region were randomly selected
Brief description of the study area                                     for interviews and visits were scheduled for every se-
Fatick region corresponds to a part of the former king-                 lected interviewee. The researchers used random sam-
dom of Sine. It is located in the western centre of the                 pling and the sample was stratified to ensure the
country between 13° 35 and 14° 00 N latitude and 16° 00                 inclusion of farmers who still deliver milk, those who
and 17° 00 W longitude (Ndiaye 2006). The region has                    have never delivered, and those who stopped delivering
three departments (Fatick, Foundiougne, Gossas), 10 dis-                milk to the collection centre. Typology is one of the
tricts, 35 rural communities, and 2,097 human                           tools that are most often used to capture the variability
Habanabakize et al. Pastoralism: Research, Policy and Practice (2022) 12:22 Page 4 of 14
of farming systems (Alvarez et al. 2014). Typology is and Mbour. They are divided between two urban
thus that process of artificially stratifying farms into sub- communes (Fatick and Diakhao) and seven rural com-
sets or groups that are relatively homogenous according munes (Fissel, Diarrère, Patar, Niakhar, Tattaguine,
to specific criteria, e.g. have broadly similar resource Diouroup, and Mbélacadiao). A semi-structured quali-
bases, enterprise patterns, livelihoods, and constraints tative research method was adopted, wherein the
(Kuivanen et al. 2016). In research for development pro- farmers were interviewed to describe their daily farm-
jects, typologies are useful to derive the best-fit farm ad- ing experience. The survey questionnaire was de-
justments, improved policies and innovations in order to signed to capture biophysical (e.g. land size, crops,
meet the specific project goals and farmers’ needs. First, herd size, etc.), socio-economic (included characteris-
in order to capture the farming system diversity and to tics of the household head (name, age, gender, and
respond to the research question, the researchers made marital status), sources of income, land use patterns,
sure to include all 9 sub-regions of Fatick for interviews use of/access to inputs, food security, livestock sys-
to ensure the representations of all the existing farming tem, links and distances to nearby markets, and pro-
systems (agro-pastoralists, transhumant, and milk spe- duction orientation, etc.), and managerial aspects (e.g.
cialized producers; Table 1). It is very important to reproduction techniques, feeding, animal housing, nu-
understand that livestock producers in Senegal and spe- trient input use, transhumance, etc.). Like noted by
cifically in the studied region are ethnically named after other researchers, that survey approach allows to cap-
their traditional livestock production occupation. For ex- ture all the components of the farm and their interac-
ample, “Peuls” (Fulani in other countries of West Africa) tions within the farming system they are located in
are known to be pastoralists by vocation, while “Serer” (Alvarez et al. 2014). Farm visits allowed some add-
are agro-pastoralists but these are ethnic appellations itional checks, for instance on field area cultivated,
and they cannot be used as such to represent farming tools owned, livestock kept (breeds, number, etc.),
system types. Second, in order to capture different and crops grown amongst other things. Prior to con-
farmer’s situations as it relates to the dynamic brought ducting the research, the project went through both
in the area by the dairy processor, the researchers also internal and external ethical approval processes.
ensured the inclusion of farmers who still deliver milk, In previous literature, smallholder farms have been
those who have never delivered, and those who stopped characterized by demographic data, herd structure
delivering milk to the collection centre (Table 1). Add- and size, facilities and machinery, feeding manage-
itional interviews were conducted with 3 technical per- ment, reproductive and milking production, health
sons at the milk collection centre who oversee the management, supply of inputs, area under cultiva-
liaison between producers and the dairy processor (i.e. tion, usage of fertilizer, and usage of concentrates,
they support milk collection, record keeping, technical markets, prices, and income from livestock activities,
aspects, etc.). The additional information provided by etc. (Lowder et al. 2016; Muriuki and Thorpe 2001;
these local experts and technicians provides context- Herrero et al. 2014; Swai et al. 2014). Based on pre-
ual elements to our results specifically regarding the cedent and the context of livestock farmers in the
dynamic of the milk collection industry in Fatick re- studied area, we designed a survey questionnaire to
gion and will be used in our manuscript to support collect information on production activities at differ-
the discussion. Data collection took place from De- ent levels. Variables in the questionnaire were both
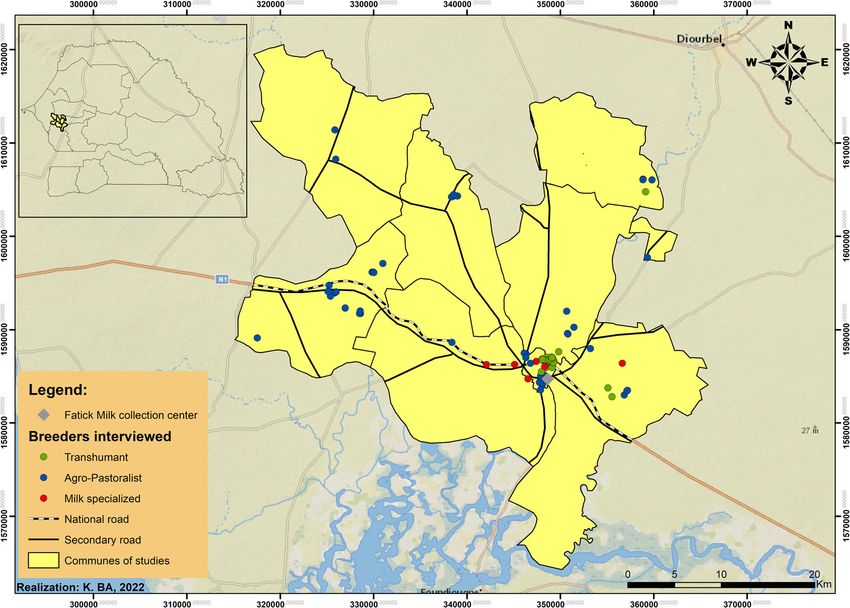
cember 2019 to January 2020. Figure 1 and Table 1 categorical and quantitative in nature and included
respectively show the eight communes where the sur- land use, surface area, use of concentrates and fertil-
vey was conducted, and the categories of producers izers, herd size, income, prices, production capacity,
interviewed. These communes cover an area of reproduction, production diversity, weather adapta-
1,341.75 km2 and straddle the departments of Fatick tion, diseases, feeding, and markets. Missing data
Table 1 Sample description
Category of livestock farmers Milk delivery to the dairy processor Number of interviewees
Agro-pastoralist Delivering 21
Not delivering 30
Transhumant Delivering 21
Not delivering 20
Milk specialized Delivering 8
Not delivering 0Habanabakize et al. Pastoralism: Research, Policy and Practice (2022) 12:22 Page 5 of 14 Fig. 1 Location of interviewees by category of livestock farmers and local milk collection centre in the area of Fatick region, Senegal occurred in questions that were not required to be Statistical analysis answered because of answers given on previous All statistical analyses were carried out using the R soft- questions (for example, if farmers answered “no” for ware (R Core Team 2019). Multiple factor analysis selling milk, they were not asked at how much they sold (MFA), followed by hierarchical and k-means clustering milk or which quantities, etc.). This was considered a methods, was used in this study. The MFA methodology non-applicable condition and missing data in these is appropriate to analyse survey data in which there is cases were imputed as “non-applicable”. For categorical only one categorical answer by respondent per question answers, non-applicable was considered its own cat- and questions are organized into groups based on the egory. For quantitative answers, missing data due to theme they cover (Abdi et al. 2013). However, in our non-applicable condition were found in purchase of study, we had both categorical and quantitative (i.e. nu- fodder or crop residues (mean ± SD: 119,238.1 ± merical) answers. Therefore, an extension of the MFA, 173,486.3 CFA), distance to markets (3.59 ± 6.54 km), which was developed to accommodate both types of an- veterinary cost (21,053.2 ± 18,470.4 CAF), total food swers (Chavent et al. 2017a), was used in this study. The cost (505,872.9 ± 1271691.9 CFA), forage production MFA was carried out using the function MFAmix from cost (111,300.0 ± 150,474.8 CFA), and income all crop the R package PCAmixdata (Chavent et al. 2017b). activities (368,736.9 ± 734,893.2 CFA). For these cases, The factor loads were extracted from the MFA and the variables were first binned into three levels based used to cluster farmers using the function HCPC from on mean, standard deviation (below average, average, the R package FactoMineR (Le et al. 2008), which was and above average), and the missing data was imputed adapted to work on the MFA output from the R package as “non-applicable”. The average level was considered PCAmixdata (Chavent et al. 2017b). First, hierarchical to be within the range of mean ± 0.5 times the standard clustering using Ward’s minimum variance method was deviation, whereas the below- and above-average levels conducted to establish the number of clusters, which were lower and greater than this range, respectively. was defined based on inertia gain, and medoids (Borcard
Habanabakize et al. Pastoralism: Research, Policy and Practice       (2022) 12:22                                                         Page 6 of 14

et al. 2018). Both of these parameters were then used in                     best descriptor for each identified cluster. The sub-set of
the k-means clustering algorithm (Balijepally et al. 2011)                   farmers found in the intersection of clusters and the out-
using the Euclidean distance. This two-step clustering                       liers within the same cluster (example: SN-SOP 54 from
approach ensures the reliability and consistency of the                      cluster 1, SN-SOP 84 from cluster 2, etc.; Fig. 2) sug-
cluster solution (Balijepally et al. 2011; Borcard et al.                    gested similarities in practice amongst farmers from dif-
2018).                                                                       ferent clusters at one end and differences amongst
   Chi-squared (α < 0.05) and one-way ANOVA (α <                             farmers within the same cluster at the other end. In
0.05) tests were used to evaluate the association between                    other words, clusters represent farmers with the most
clusters and categorical and quantitative variables, re-                     similar practices. Being in the same cluster did not mean
spectively. A total of 43 variables were found to be sta-                    that practices are 100% identical amongst producers,
tistically different between clusters. Therefore, the v-test                 and being in different clusters did not mean producers
was used to rank the statistically significant variables                     have no similarity in practice.
based on their relevance in describing each cluster. The                        Cluster 1 was comprised of farmers that used more
v-test indicates the extent to which a variable within                       hours for grazing compared to the overall average grazing
each cluster differs from the overall average, in which                      hours across producers (cluster 1 vs overall, mean ± SD:
higher values are associated with greater extent and,                        10.1 ± 2.99 vs 7.55 ± 4.10 h; Table 2). The farms in this
therefore, greater relevance (Husson et al. 2017). In this                   cluster displayed the lowest milk production per farm
study, we selected the top five categorical and numerical                    compared to the overall average (3.75 ± 3.30 vs 8.22 ±
variables with the greatest absolute v-test value to de-                     7.94 L). The quantity of milk sold by farmers in cluster 1
scribe each cluster. This kind of methods allows captur-                     was 5 times below the overall average (1.3 ± 2.05 vs 5.26 ±
ing the complexity of farming systems by considering, at                     7.20 L), while the average price per litre was below the
the same time, numerous farm dimensions and then                             general average (122.06 ± 179.54 vs 289.00 ± 203.81 CFA).
highlighting the ones that explain more the farm diver-                      The lack of responses to market-related questions was
sity (Alvarez et al. 2014).                                                  due to the majority of farmers in this group not selling
                                                                             milk. In fact, cluster 1 had 88% of all the farmers who
Results                                                                      were not selling milk (Table 3). Furthermore, the average
Result descriptions                                                          rate of cattle infections (number of infected animals per
A multiple factor analysis of the data showed the exist-                     farm per year) in this cluster was higher compared to the
ence of 3 farm clusters (i.e. types) amongst the surveyed                    general average of the overall sample (5.4 ± 5.96 vs 3.25 ±
producers (Fig. 2). This analysis aimed at establishing a                    4.53). Farms in cluster 1 prioritize agriculture and use ani-
data-driven typology of the studied farms based on                           mal by-products to promote soil fertility with the use of
farmers’ everyday practices. Amongst the 43 most sig-                        crop residues and cultivated fodder for animal feeding.
nificant variables that described differences across farms,                  These farms had different species of animals, and their
10 variables with the highest v-test were retained as the                    practices were generally sedentary.

 Fig. 2 Biplot in the first two dimensions’ plane depicting the 3 clusters of farms. Each point represents a farm and each cluster is depicted by a
 different shape and colour. Labels indicated the anonymized farm ID
Habanabakize et al. Pastoralism: Research, Policy and Practice (2022) 12:22 Page 7 of 14
Table 2 Top 5 relevant quantitative variables that best describe the 40 farms from cluster 1. Overall sample = 100 farms
Variable v-test Cluster1 Overall2 p-value3
4
Milk selling price /L −5.52 150.6 ± 191.91 289.00 ± 203.81 < 0.001
Grazing hours in rainy season 5.00 10.1 ± 2.99 7.55 ± 4.10 < 0.001
Average litres of milk sold/day −4.48 1.3 ± 2.05 5.26 ± 7.20 < 0.001
Average litres of milk produced/farm/day −4.34 4.0 ± 3.32 8.22 ± 7.94 < 0.001
5
Number of infected cattle 3.87 5.4 ± 5.96 3.25 ± 4.53 < 0.001
1
Mean ± standard deviation on cluster
2
Mean ± standard deviation on overall data
3
Overall vs cluster (α < 0.05)
4
Average number of infected cattle/year (all diseases included)
5
Average market price regardless of buyer type
Cluster 2 was characterized by farms with land access cluster was almost double that of the overall average (15.6
below the general average (cluster 2 vs overall, mean ± ± 0.64 vs 8.2 ± 7.94 L; Table 5). Farmers in this cluster
SD: 2.5 ± 2.60 vs 5.2 ± 5.32 ha; Table 4) and thus also had had cows that produced more milk per day on average
a crop land area 3 times lower than the overall average than other farmers across the studied clusters (3.80 ± 2.33
(0.90 ± 2.33 vs 3.3 ± 4.84 ha; Table 4). In this cluster, vs 2.22 ± 2.27 L). In cluster 3, 67.86% of farms had one or
93.8% of farmers resort to transhumance during the dry more exotic or cross-bred cow in the herd (Table 7). The
season. Artificial insemination was low, as the money average amount of money paid per farmer in this cluster
spent per farmer for artificial insemination was half that of for artificial insemination services was higher than the
the overall average (5789.47 ± 11,783.48 CFA). The find- average amount of money paid by farmers in other clus-
ing that only 13.6% of producers in cluster 2 use fertilizers ters (27,803.57 ± 1,206.49 vs 16,715.00 ± 18,134.81 CFA).
and crop residues (Table 5) was in accordance with only A sub-set of producers in this group was mixing livestock
3.1% of farmers in this group combining agriculture and with agricultural activities. In cluster 3, 50% of producers
livestock. In cluster 2, 87.5% of farmers did not answer made income from crop activities and had a greater in-
these questions regarding crop diversity, suggesting that come from crop activities than the average made by
very few are participating in agricultural activities. This is farmers in other clusters. Farmers in this group provided
consistent with the finding that producers in this group less opportunity for cows to graze compared to the overall
had the lowest average area of crop plantations compared average (4.6 ± 4.10 vs 7.5 ± 4.10 h). That finding was con-
to the overall average, again suggesting that many of them gruent with the practice that 67.8% of producers in this
are not involved in agricultural activities. Farmers in this cluster mix grazing and indoor housing. In fact, this group
group sell milk at higher prices per litre compared to the of farmers shows low transhumance rates, as only 3.54%
overall average price of milk per litre across groups (393.4 of producers reported using transhumance as an option
± 157.84 vs 289.0 ± 203.81 CFA) during the dry season.
Cluster 3 was characterized by farmers that sell more
than 75% of all the milk they produce (cluster 3 vs overall, Discussion
average ± SD: 15.6 ± 0.64 vs 11.9 ± 10.26 L; Table 6). The The analyses of surveys conducted with farmers provided
average milk produced/day/farm by producers in this crucial information to discuss the opportunities and
Table 3 Top 5 relevant categorical variables that best describe the 40 farms from cluster 1. Overall sample n = 100 farms
Variable v-test Cla/Mod1 (%) Mod/Cla2 (%) Overall (%)3 p-value4
Type of buyers for farmer’s products: no answers 6.30 89.3 62.5 28 < 0.001
Farmers reducing concentrate use for environment protection: no −5.96 14.3 20.0 56 < 0.001
Distance to markets: no answers 5.80 76.3 72.5 38 < 0.001
Selling agreement with buyers: no answers 5.64 88.0 55.0 25 < 0.001
Farmers selling milk: no 5.64 88.0 55.0 25 < 0.001
1
Proportions of farms with that answer in cluster 1 out of the overall number of farms with the same answer (e.g. out of the 28 farms, 89.3% of them gave the
“no answer” response to the question “Type of buyers for farmer’s products”)
2
Proportions of farms in cluster 1 with that answer out of the number of farmers in cluster 1 (e.g. 62.5% of the 40 farms in this cluster gave “no answer” to the
question “type of buyers for farmer’s products”)
3
Proportions of farms with that answer out of the total number of surveyed farms (N=100)
4
Overall vs cluster (α < 0.05)Habanabakize et al. Pastoralism: Research, Policy and Practice (2022) 12:22 Page 8 of 14
Table 4 Top 5 relevant quantitative variables that best describe the 32 farms from cluster 2. Overall sample n = 100 farms
Variable v-test Cluster1 Overall2 p-value3
Total surface occupied by farmers’ home (ha) −4.21 1.3 ± 0.78 2.0 ± 1.13 < 0.001
Cost of artificial insemination (CFA4) −3.70 6875.0 ± 12546.79 16715.0 ± 18134.81 < 0.001
Total surface of land/farm (ha) −3.52 2.5 ± 2.60 5.2 ± 5.32 < 0.001
Milk selling price5/L 3.50 393.4 ± 157.84 289.0 ± 203.81 < 0.001
Crop land area (ha) −3.35 0.9 ± 2.33 3.3 ± 4.84 < 0.001
1
Mean ± standard deviation on cluster
2
Mean ± standard deviation on overall data
3
Overall vs cluster (α < 0.05)
4
West African currency
5
Average market price regardless of buyers
challenges encountered by farmers in their respective clus- on the use of industrial feeds and inorganic fertilizers.
ters. The impact of the implementation of a dairy proces- These are good practices that have proven to be effective
sor and its milk collection centre in Fatick on the dynamic not only in land conservation but also in GHG mitiga-
of smallholder livestock production activities has also been tions if used efficiently (Robinson et al. 2011). In con-
discussed in this section using the collected data and the trast, the results also showed that producers of this
contextual elements provided by the technical persons of cluster had the lowest milk production per farm, lowest
the milk collection centre. This section will also discuss access to markets, and higher rates of animal diseases
the challenges and opportunities presented by different compared to farmers from other clusters. Though there
farmer clusters and specific recommendations tied to the could be other factors associated with animal husbandry
need of each cluster will be proposed. practices that explain the lowered milk production, it is
worth noting that producers of this cluster are agro-
Cluster 1: Agro-pastoralists whose primary activity is pastoralists. While the primary vocation of these pro-
agriculture which can be associated with animal breeding ducers is agriculture, over the years, they have learnt to
in remote areas without proximity to services provided take advantage of the co-existence of livestock produc-
by a dairy processor and its milk collection centre tion and agriculture. In that regard, these producers are
The strengths of farmers in cluster 1 are found in their known to have small animal herds, and so the limited
mixed production systems. These are diverse production quantities of milk produced are mostly reserved for
systems with different animal species (cattle, small rumi- household consumption. Furthermore, the position of
nants, poultry, donkeys, and horses) and crops (subsist- these farms in deep remote rural areas devoid of infra-
ence crops, vegetables), which is an important aspect in structure (i.e. electricity, roads, and cooling facilities)
the context of smallholder income diversification. Fur- and far from services (i.e. extension advice, markets, and
thermore, mixed farming-livestock production systems veterinary care offered by the dairy processor or other
support the use of organic fertilizers and manure, use of service providers) may explain the low selling capability
crop residues to feed animals, and reduced overreliance and high rate of animal disease found in this cluster.
Table 5 Top 5 relevant categorical variables that best describe the 32 farms from cluster 2. Overall sample n = 100 farms
Variable v-test Cla/Mod1 (%) Mod/Cla2 (%) Overall (%)3 p-value4
Feeding systems: animals mostly in transhumance 8.12 75.6 96.9 41 < 0.001
Drought response: transhumance 7.73 75.0 93.8 40 < 0.001
Crop diversity5: no answers 7.21 75.7 87.5 37 < 0.001
Farmers applying combination of agriculture and livestock: yes -7.21 1.9 3.1 53 < 0.001
Use of fertilizers and crop residues: yes -6.90 7.8 15.6 64 < 0.001
1
Proportions of farms with that answer in cluster 2 out of the overall number of farms with the same answer (e.g. out of the 41 farms, 96.9% of them gave the
“animals mostly in transhumance” response to the question “Feeding systems”)
2
Proportions of farms in cluster 1 with that answer out of the number of farmers in cluster 2 (e.g. 96.9% of the 32 farms in this cluster gave “animals mostly in
transhumance” response to the question “Feeding systems”)
3
Proportions of farms with that answer out of the total number of surveyed farms (N = 100)
4
Overall vs cluster (α < 0.05)
5
Most producers in cluster 2 do not practise agriculture. “No answer” means that in most cases they had responded “no” to the previous question that asks
whether they do agriculture or notHabanabakize et al. Pastoralism: Research, Policy and Practice (2022) 12:22 Page 9 of 14
Table 6 Top 5 relevant quantitative variables that best describe the 28 farms from cluster 3. Overall sample n = 100 farms
Variable v-test Cluster1 Overal2 p-value3
Average milk production/farm/day (L) 5.73 15.6 ± 0.64 8.2 ± 7.94 < 0.001
Average litres of milk sold/day 5.71 11.9 ± 10.26 5.3 ± 7.20 < 0.001
Grazing hours rainy season −4.50 4.6 ± 4.10 7.5 ± 4.10 < 0.001
Average milk production/cow/day (L) 4.29 3.8 ± 2.33 2.2 ± 2.27 < 0.001
4
Cost of artificial insemination (CFA ) 3.79 27803.6 ± 1206.49 16715.0 ± 18134.81 < 0.001
1
Mean ± standard deviation on cluster
2
Mean ± standard deviation on overall data
3
Overall vs cluster (α < 0.05)
4
West African currency
Unsurprisingly, this has been a general trend amongst and could partially explain the low milk production
smallholder farmer settings in Senegal (Bernard et al. characterizing this cluster.
2008; Van den Broeck and Maertens 2017) and in the Despite the remoteness of producers in this clus-
region of West Africa (Atta et al. 2015; Bernard et al. ter, the dairy processor has shown willingness to col-
2008). Similar trends have also been reported by re- laborate in milk collection but the low milk
searchers in East Africa (Jayne et al. 2010) and South Af- production has been a discouraging factor for the
rica (Matsane and Oyekale 2014). The dairy processor dairy processor to justify the logistics involved in
has been exploring solutions to extend its collection pe- collecting milk from rural areas. Farmers in this
rimeters (i.e. using motor bikes with tanks), due to milk cluster require enhanced support to have stable and
volumes being lower than the maximum capacity, said functional cooperatives or organizations that could
the liaison persons of the dairy. A group of producers in enter into agreements with a third party like Kirene
this cluster who reside in closer proximity have begun to Dairy to facilitate access to inputs and services.
benefit from the market and extension services provided Once these collaboration platforms are established
by the dairy processor and its milk collection centre. and fully operational and by resolving the issues
The dairy processor sets limits on distances for milk col- raised by the farmers, the extension and market ser-
lection to avoid milk quality deterioration and thus, vices and inputs provided by the dairy processor (i.e.
farmers who reside further have yet to gain the advan- animal feeds, veterinary services, loans, etc.) could
tages of the new dynamic brought by the facility. The enhance production for the farmers while helping
biggest threat faced by farmers in this cluster is the the dairy processor to meet its processing capacity.
heavy reliance on rain to support production activities. Finally, in the mixed production systems characteriz-
Unfortunately, Sahel region and Fatick area are zones ing cluster 1, agroforestry practices may also be har-
where rain is limited and highly unpredictable, with pro- nessed to play a role in water conservation and feed
longed drought and very fragile vegetation cover in production. In addition to serving as animal feed,
addition to high levels of soil salinization (Zougmoré et al. crops compete with trees to send roots deeper into
2016). These are serious threats to both milk and agri- the soil, and improve not only nutrient cycling but
culture production activities of farmers in this group also the storage and retention of rainwater.
Table 7 Top 5 relevant categorical variables that best describe the 28 farms from cluster 3. Overall sample n = 100 farms
Variable v-test Cla/Mod1 (%) Mod/Cla2 (%) Overall3 (%) p-value4
Income from all crop activities: greater than average 5.37 87.50 50.00 16 < 0.001
Type of farmer: animals mostly in transhumance −5.06 2.44 3.57 41 < 0.001
Drought response: transhumance −4.95 2.50 3.57 40 < 0.001
Possession of cross-breed and exotic species: yes 4.76 61.29 67.86 31 < 0.001
Feed system during rainy season: grazing and indoor housing −4.63 20.88 67.86 91 < 0.001
1
Proportions of farms with that answer in cluster 3 out of the overall number of farms with the same answer (e.g. out of the 16 farms, 50% of them gave the
“greater than average” response to the question “income from all crops activities”)
2
Proportions of farms in cluster 3 with that answer out of the number of farmers in cluster 3 (e.g. 50% of the 28 farms in this cluster gave “greater than average”
response to the question “income from all crop activities”)
3
Proportions of farms with that answer out of the total number of surveyed farms (N = 100)
4
Overall vs cluster (α < 0.05)Habanabakize et al. Pastoralism: Research, Policy and Practice (2022) 12:22 Page 10 of 14 Cluster 2: Transhumant breeders located in peri- and processor. The dairy processor has established a model urban areas whose primary activity is livestock whereby producers are subsidized with a package of in- production which can be associated with agriculture and puts including animal feed, veterinary services, and with proximity to services provided by the dairy training on animal husbandry practices. Farmers have to processor and its milk collection centre reimburse some of the inputs like animal feed in which Cluster 2 was mainly composed of farmers who use case corresponding amounts are subtracted from their transhumance as an adaptation strategy to feed animals, pay at the end of the month in their milk payment cy- due to the scarcity of resources and significant changes cles. The dairy equipped the milk collection centre with in weather conditions in the study area. Transhumance motorcycles and basic quality testing tools to enable fast has been increasing in the region mainly due to shrink- and reliable milk collection for farmers who reside far ing of grazing areas at the expense of housing, extension from the centre but in reasonable distances that prevent of agricultural areas, and the progression of salty land milk quality deterioration. Milk collection is performed (Robinson et al. 2011). This group of farmers includes on a daily basis for enrolled farmers. The farmers inter- the majority of pastoralists, who consider animals not viewed from all the 3 clusters showed a level of satisfac- only a source of saving but also as social status by main- tion with the system implemented by the dairy taining their families “legacy as pastoralists”. Hence, the processor, but nearly all of them were not satisfied with majority of these producers own large animal herds. the price being paid per litre of milk. Furthermore, some These farms have a wide range of animal species includ- farmers have reported that at some point, the dairy pro- ing cattle, small ruminants, and transportation animals cessor was not consistently providing the animal feed such as donkeys and horses. Producers rely on commu- and medication as promised at the beginning, but the nal grazing to feed animals through serial movements to dairy’s liaison persons explained that this could happen regions where weather is favourable for grass. As a re- due to the lack of consistency in some farmers’ commit- sult, milk production decreases significantly during the ment where, after receiving the above benefits, no longer dry months where grazing zones are almost non-existent chose to deliver milk to the collection centre. Even if the in the region. This has been observed for pastoralists in dairy processor is considered by farmers in cluster 2 as a West Africa, where producers have been forced to move constant and sure market all year long, there are parallel to areas with greener pastures in the era of climate markets (i.e. local markets from Fatick ville or nearby change as grazing zones progressively degrade (Manoli Dakar) which actually offer higher prices but they are et al. 2014; Adriansen 2008; Turner et al. 2016; Kitchell very fragmented and inconsistent and are unable to buy et al. 2014; Boesen et al. 2014 ). Farmers in cluster 2 the bigger volumes especially in months of production prioritize milk production and sell milk at higher prices overflow. According to farmers, the local market price per litre compared to the overall average price across the can go as high as 700 CFA/L compared to 350 CFA/L sample population. This may be attributed to two key paid by the dairy processor, and that was another reason factors. First, the urban and peri-urban location of many given by some farmers on why they stopped delivering farmers in this cluster serves as strategic access to diver- milk to the processor. Overall, the implementation of sified markets, road infrastructures, and basic equipment the dairy processor and its milk collection centre in for milk transportation. This is congruent with the re- Fatick could be an avenue to the development of the sults from other studies in Senegal (Goldsmith et al. smallholder livestock production sector in the region, by 2004; Falletti 2012), West Africa (Rischkowsky et al. offering alternative means of income to conventional live 2006), and East Africa (Van der Lee et al. 2020) where, animal selling and meat production. However, in order despite other challenges in production, the proximity of to have a win-win situation where farmers would have producers to urban settings provides a competitive ad- more incentives to the benefits from a stable market and vantage to markets and access to basic infrastructures. access to inputs while the dairy processor could also Second, the implementation of the dairy processor and benefit from the increased local milk production needed a milk collection centre which serve as points of entry to to meet its processing capacity, the noted barriers and farmers in Fatick region is believed to have brought a issues raised by farmers will need to be eliminated. Es- new dynamic to milk production activities amongst tablishing platforms of dialogue between producer repre- farmers especially those in cluster 2 who are the closest sentatives and the dairy processor with adequate tools to the milk collection centre. As earlier mentioned, the (such as simple format buyer-seller agreements, etc.) data collection sample included farmers who actively may support mutual understanding and respect of the work with the dairy processor, those who no longer terms of collaboration, while also creating a long-term work with it, and those who have never worked with it. sustainable business environment. There has been evi- This has allowed to explore all aspects of the new dy- dence that creating connections between smallholder namic caused by the implementation of the dairy farmers and medium to large enterprises acts as a
Habanabakize et al. Pastoralism: Research, Policy and Practice   (2022) 12:22                                           Page 11 of 14

powerful mechanism to improve input and output mar-                     regarding the buying prices of the dairy processor. How-
kets and other productivity-enhancing services for                      ever, it is worth noting that during the overflow period,
liquidity-constrained smallholders (Adu-Baffour et al.                  the parallel markets (preferred by farmers) are unable to
2019; Sims and Kienzle 2016; Corniaux et al. 2014). The                 buy the available quantities and that is the time when
role of the government in this process is crucial to create             farmers rely on the dairy processor for milk selling.
an enabling environment for producer and processor or-                     Cluster 3 also consists of farmers whose average milk
ganizations and provide vertical coordination between                   production/day/farm is nearly double that of the overall
them. The development of infrastructure, such as cool-                  population average. Their cows produce more milk per
ing and collection centres, should also be enhanced                     day on average than all other farmers across clusters.
through public-private partnerships.                                    Animals in this cluster remain stalled the majority of the
   Another important characteristic of cluster 2 was the                time and from there consistently produce milk all year
lowest access to land and crop land compared to other                   long. Animal feeds are predominantly industrial concen-
farmer clusters. The position of many producers in                      trates with a supplement of crop straws. Farmers try to
urban and peri-urban areas of Fatick region provides a                  maintain access to veterinary care services. The higher
competitive advantage in the aspects discussed previ-                   milk production may be attributed to the fact that
ously, while also presenting with disadvantages. In Fatick              farmers mainly own either pure exotic breeds (such as
urban and peri-urban areas, land and water (surface                     Holstein, Jersey, Montbeliard) or cross-breeds, which are
water and wastewater) usable for production activities                  believed to produce higher amounts of milk compared
are scarce resources due to competing outputs (includ-                  to local breeds (Seck et al. 2016; Niemi et al. 2016; Mag-
ing infrastructure development and household activities).               nani et al. 2015). Most of the producers fall in the cat-
Even when farmers owned land, the proper land title                     egory of socio-professional workers, politicians, retired
documents were often not in possession. This makes it                   senior public servants, or other private people with suffi-
difficult for farmers to plan investments in production                 cient economic means, advanced education levels, and
activities, especially in the context of cities where regula-           good networks that enable them to mobilize resources
tions for land use require proper documentation. Des-                   that help to intensify production. It is likely that farmers
pite the land scarcity, some urban farmers in cluster 2                 in cluster 3 gain the most from the implementation of
adopted sedentary practices where few animals were                      the dairy processor, by facilitating their transition from
kept at home and in the vicinity in case of emergencies                 traditional breeders who were raising animals and pro-
(i.e. selling live animals, meat, or manure in urgent situa-            ducing milk largely for household consumption. The
tions that required money at home), while others were                   motivation of a permanent market offered by the dairy
mostly mobile (transhumance). Animals kept at home                      processor and accompanied extension services assured
grazed during the day in the outskirts of the city with                 this group to invest in business-oriented milk produc-
some kept in the fields at night and others brought back                tion by leveraging their access to resources and social-
home. A shepherd would be employed, responsible for                     professional status. Finally, it is important to realize that
the conduct and maintenance of the livestock.                           the wealth status of farmers has a considerable influence
                                                                        on their production strategies: from the breed choice
Cluster 3: Specialized milk producers located in peri-                  and type of feeds to the adopted management practices.
urban and rural areas of Fatick region with consistent and              The results suggest that farmers in cluster 3 are wealth-
all-year-round milk production sell high quantities to the              ier than farmers in other clusters and that could explain
dairy processor and the remainder to parallel markets                   why for example, as opposed to other farmers, they have
Cluster 3 was characterized by farmers that sell more                   access to expensive exotic breeds, they stall their animals
than 80% of the produced milk. Farmers of this cluster                  and have consistent access to veterinary services.
benefit from the dynamic of the dairy processor and its                    The main challenges faced by the farmers of cluster 3
milk collection centre by selling the greatest quantities               are the high production costs and the difficulty of main-
of produced milk. Consistent with the other two clus-                   taining the needs of exotic breeds less adapted to local
ters, farmers in cluster 3 reiterate that a portion of the              climatic conditions. Exotic cows are also at risk from
milk produced is reserved for parallel markets that offer               high vulnerability to local weather conditions, by lacking
better prices. It is beneficial for farmers and the dairy               resistance to heat, humidity, tropical diseases, and para-
processor to build and sustain positive business relation-              sites (Wilson 2018; Seck et al. 2016; Niemi et al. 2016;
ships and maintain consistent production and markets                    Magnani et al. 2015). Environmental modifications,
that profit both parties. That being said, the parallel mar-            water, and feed management strategies have all proved
kets remain an attractive option for farmers during the                 to be helpful in alleviating and encountering the stress
dry season when the demand is usually higher than the                   for exotic animals across the tropics (Renaudeau et al.
supply, which again explain the discontentment of farmers               2012). The design of animal facilities (shape, orientation,
Habanabakize et al. Pastoralism: Research, Policy and Practice (2022) 12:22 Page 12 of 14
thermo-physical properties of construction materials, Prolonged droughts, soil salinization, and other extreme
ventilation, opening facilities, etc.), genetic selection for weather events are generally reported throughout the lit-
more heat-tolerant cattle, and adaptation of feeding erature to be common challenges that affect production
strategies to balance water, nutrients, and electrolyte in- activities in the area and across clusters. This study also
take (for example by providing more minerals and vita- explored the new dynamic in the livestock production
min to meet the special needs) are all suggested to be sector of Fatick region brought by the implementation
amongst the primary means of reducing adverse effects of a dairy processor and its milk collection centre. These
of the environment on these animals (Renaudeau et al. facilities offer a package of extension services and a con-
2012; West 2003). Animal feed (most of which are in- sistent market opportunity for rural and urban livestock
dustrial concentrates) and veterinary costs account for producers. New business partnerships not only allowed
more than 70% of production expenditures. Forage pro- farmers to generate alternative resources to sustain live-
duction in the area is limited by lack of land and scarcity lihood levels, but were also necessary to increase local
and high cost of water resources. Adopting supplements milk production in line with the processing capacities of
that do not harm the environment and which can be lo- the dairy processor. This study also highlighted an exist-
cally sourced may be one solution to overcome the feed ing disconnection in the agreements and expectations of
scarcity challenges faced by farmers in this cluster. For both parties, especially in the price determination pro-
example, water ferns (such as Azolla caroliniana) are be- cesses. This will require the establishment of platforms
ing cultivated in ponds by farmers in India to provide for dialogue between producer representatives and the
extra protein to cattle and goats fed on protein-deficient dairy facilities to build more sustainable partnerships. A
elephant grass (Pennisetum purpureum) Eisler et al. community of practice that gathers local key stake-
2014). No foreseeable preventative factors would stop holders to discuss issues and opportunities surrounding
the same solution from being explored in Senegal, given the sector, while also sharing individual experiences,
that water ferns are able to grow in tropical climates. could foster a more resilient livestock production sector
Other plant extracts may also be explored, which can in Fatick. Future studies in the area should explore sus-
alter the rumen microbial population to use nitrogen tainable approaches to establish win-win collaborations
and energy more efficiently and lead to increased meat between producers of different scales and agro-
and milk production with proportionally less by-product industries, wherein both parties become partners who
greenhouse gas and ammonia (Eisler et al. 2014). The respond to the needs of involved stakeholders.
economic and physiological benefits of cross-breeding
Abbreviations
when combined with good animal management practices
ANOVA: Analysis of variance; GDP: Gross Domestic Product;
have been well documented as a successful strategy in HCPC: Hierarchical clustering on principal components; IFC: International
Senegal (Marshall et al. 2020; Niemi et al. 2016; Seck Financial Corporation; MFA: Multiple factor analysis; NASD: National Agency
of Statistics and Demographics Agence Nationale de la Statistique et de la
et al. 2016) and in the regions of Mali, Benin (Traoré
Démographique-ANSD ; PCA: Principal component analysis; SD: Standard
et al. 2017; Ahozonlin et al. 2019), and East Africa (Wil- deviation; vs: Versus; CFA: “Communauté Financière d’Afrique”
son 2018), amongst others. In that regard, farmers in
this cluster would benefit from government and private Supplementary Information
sector initiatives that promote the adoption of new The online version contains supplementary material available at https://doi.
breeding strategies and other technological options to org/10.1186/s13570-022-00234-8.
help them sustain production at good levels to satisfy
the ever-growing market. Additional file 1. Supplemental material: Descriptive statistics of
additional characteristics describing the 3 livestock production clusters.
Average ± SD are reported.
Conclusion
This study revealed the existence of three types of live- Acknowledgements
stock production systems in Fatick. While practice dif- We would like to thank all the farmers who agreed to participate in the
ferences amongst clusters (types) were found, it is worth surveys and all who helped with the data collection. Particularly, we want to
thank Mr. Gabriel Machado Dallago for helping with the data analysis and
noting that some practices (i.e. transhumance and com- Timothy Schwinghamer and Athena Zambelis for their help in editing the
munal grazing) were maintained across clusters to differ- manuscript. The authors are also grateful to the donors who funded this
ent degrees. Farmers in cluster 1 were primarily agro- project.
pastoralist and constrained by remote access to markets,
Authors’ contributions
inputs, and other infrastructures. Farmers in cluster 2 EH coordinated the project, designed the survey (investigation), developed
were primarily transhumant and constrained by a scar- the methodology, and wrote, reviewed, and edited the original draft and all
city of land and fodder resources. High cost of produc- the versions of the manuscript. EV conceptualized the project, provided
funding acquisition, administered the project, provided supervision, was
tion and susceptibility of exotic breeds to diseases were involved in the survey design and paper design, and reviewed and edited
the main challenges faced by farmers in cluster 3. the manuscript. PC contributed to the conceptualization of the project andYou can also read