Acoustic occurrence of baleen whales, particularly blue, fin, and humpback whales, off eastern Canada, 2015 2017
←
→
Page content transcription
If your browser does not render page correctly, please read the page content below

Vol. 47: 265–289, 2022            ENDANGERED SPECIES RESEARCH
                                                                                                  Published April 21
 https://doi.org/10.3354/esr01176            Endang Species Res

                                                                                                 OPEN
                                                                                                 ACCESS

            Acoustic occurrence of baleen whales,
         particularly blue, fin, and humpback whales,
                off eastern Canada, 2015−2017
             Julien J.-Y. Delarue1,*, Hilary Moors-Murphy2, Katie A. Kowarski1,
               Genevieve E. Davis3, Ildar R. Urazghildiiev1, S. Bruce Martin1
                          1
                            JASCO Applied Sciences (Canada) Ltd., Halifax, NS B3B 1Z1, Canada
  2
  Fisheries and Oceans Canada (Maritimes Region), Bedford Institute of Oceanography, Dartmouth, NS B2Y 4A2, Canada
3
 Northeast Fisheries Science Center, National Oceanic and Atmospheric Administration, Woods Hole, MA 02543-1026, USA

       ABSTRACT: Six baleen whale species occur off eastern Canada, but little is known of their year-
       round occurrence across this large region. This complicates identifying areas that are important to
       them and may require critical habitat designation, especially for those species considered at risk.
       This is particularly true between fall and spring because of a lack of visual survey effort. The main
       objective of this paper is to provide a year-round and pluriannual description of the minimum
       acoustic occurrence of baleen whales, particularly blue Balaenoptera musculus, fin B. physalus,
       and humpback whales Megaptera novaeangliae. We deployed 25 acoustic recorders off eastern
       Canada between May 2015 and November 2017, and the data were analyzed using a combination
       of automated detectors and manual validation to identify vocalizations produced by these species.
       Blue, fin, and humpback whales occurred off eastern Canada year-round, a finding which con-
       trasts the traditional seasonal latitude migration narrative for these species. The Scotian Shelf
       region and Flemish Pass−Orphan Basin areas seem particularly important for these animals and
       should be the focus of future research. Sei B. borealis, minke B. acutorostrata, and North Atlantic
       right whale Eubalaena glacialis vocalizations also occurred in the data but were not adequately
       captured by the adopted methodology. Coarse patterns of occurrence are presented for these spe-
       cies as a foundation for more detailed analyses. This study is the first to cover eastern Canadian
       waters for an extended continuous period and provides a baseline against which future changes
       can be assessed.

       KEY WORDS: Baleen whale · Acoustic occurrence · Blue whale · Fin whale · Humpback whale ·
       Eastern Canada

                  1. INTRODUCTION                           sessed as endangered by the Committee on the
                                                            Status of Endangered Wildlife in Canada (COSEWIC)
  Eastern Canadian waters are home to a rich marine         in 2019 (COSEWIC 2019) and are currently under
mammal community, with 34 species having reason-            consideration for listing under the SARA. Commercial
able probability of occurrence. Canada’s Species at         whaling has severely reduced these populations in
Risk Act (SARA) lists 6 of these species (SARA 2002),       the past, and the extent to which they have recovered
including endangered Atlantic blue Balaenoptera             varies but is generally poorly understood. Anthro-
musculus and North Atlantic right whales Eubalaena          pogenic threats, particularly entanglements in fishing
glacialis and special concern Atlantic fin whales B.        gear, vessel strikes, and underwater noise, affect all
physalus. Atlantic sei whales B. borealis were as-          baleen whales and are linked directly to the ongoing
                                                            © J. J.-Y. Delarue, K. A. Kowarski, I. R. Urazghildiiev, S. B. Mar-
*Corresponding author: julien.delarue@jasco.com             tin, Fisheries and Oceans Canada, and outside the USA, The
                                                            U.S. Government.
                                                            Publisher: Inter-Research · www.int-res.com
266                                    Endang Species Res 47: 265–289, 2022

decline of the North Atlantic right whale (Vanderlaan      2011, 2018) but are consistent with the presumed
et al. 2008, 2011, van der Hoop et al. 2017, Kenney        small population size (< 250 mature individuals)
2018), and possibly that of Atlantic fin whales in the     (COSEWIC 2002). Limited recruitment (COSEWIC
Gulf of St. Lawrence (GSL) (Schleimer et al. 2019a,        2002) and threats such as entanglements (Ramp et al.
Ramp et al. 2021).                                         2021) and underwater noise (McKenna 2011, Melcón
  The SARA mandates that the Canadian govern-              et al. 2012) highlight the urgent need to designate
ment prepare a recovery strategy defining threats,         and protect critical habitat for this species, both
recovery potential, and management objectives that         inside and outside the GSL.
will sustain species recovery and survival for threat-        Atlantic fin whales are considered common off
ened and endangered species/populations. Critical          eastern Canada. They range broadly from the Bay of
habitat is a key element of recovery strategies.           Fundy to Labrador, including throughout the Scotian
Important habitats for North Atlantic right whales in      Shelf, GSL, and Grand Banks. They were the most
Canadian waters were first identified in 2009 (Brown       sighted and harvested species on the Scotian Shelf
et al. 2009) and legally protected as critical habitat     in the 1960s to 1970s, while the vast majority of fin
under the SARA in 2017 (DFO 2017). While impor-            whales caught off eastern Canada occurred off
tant habitats of Atlantic blue whales have been            Labrador and northeastern Newfoundland (Sergeant
assessed (DFO 2018, Lesage et al. 2018), they have         1966, Mitchell 1974, Breiwick 1994, Lawson 2006).
yet to be formally identified under the SARA.              Visual sightings from 1945 to 2015 off eastern Can-
  One factor affecting the identification of important     ada, although uncorrected for effort, suggest a broad
habitats for baleen whales off eastern Canada is the       distribution of fin whales with potential highly suit-
large range occupied by each of these highly mobile        able habitats identified along the Newfoundland
species. Logistical constraints caused by unfavorable      coast, on the southern Labrador Shelf, on the outer
weather and sea state conditions that are prevalent in     Grand Banks, and in Orphan Basin (Lawson 2006,
non-summer months make it difficult to provide com-        Gomez et al. 2020). Despite evidence of one localized
plete year-round coverage of these ranges via vessel-      decline in abundance (Schleimer et al. 2019a), there
or aircraft-based surveys. While long-term studies on      are currently no data to suggest that this trend ap-
the occurrence, life history, and habitat preferences      plies to the Atlantic fin whale population as a whole,
of some baleen whales have been conducted in cer-          with preliminary summer abundance estimates rang-
tain areas off eastern Canada (e.g. in the Bay of          ing between 3000 and 4000 individuals (Lawson &
Fundy or GSL; Johnston et al. 2005, Ramp et al. 2006,      Gosselin 2011, 2018). Although visual sighting re-
2010, 2014, Doniol-Valcroze et al. 2007, 2011, Ramp &      cords are strongly biased towards summer, some fin
Sears 2013, Gavrilchuk et al. 2014, Davies et al. 2019,    whales remain in eastern Canadian waters in winter
Schleimer et al. 2019b), and some large-scale surveys      (Lawson 2006, Roy et al. 2018).
have been conducted (Lawson & Gosselin 2011,                  The summer presence of humpback whales off
2018), relatively limited information exists about         eastern Canada is well documented. In some areas,
whale occurrence and habitat use throughout most of        their distribution parallels that of fin whales, possibly
this region, especially in winter. This leads to uncer-    due to trophic niche overlap (Whitehead & Carscad-
tainty in identifying potential high-use areas or ag-      den 1985, Gavrilchuk et al. 2014). They are distributed
gregation sites worthy of protection.                      across several feeding aggregations, which can be
  Most current knowledge on Atlantic blue whales in        summarized as the Gulf of Maine−Scotian Shelf (in-
eastern Canada comes from the GSL, an area used            cluding the Bay of Fundy), GSL, and Newfoundland−
only by a proportion of the population (Ramp & Sears       Labrador (Katona & Beard 1990). They occur broadly
2013). Here they are acoustically present year-round       off Newfoundland and Labrador (Gomez et al. 2020),
in ice-free areas (Simard et al. 2016). Outside the        although predictable aggregations occur in coastal
GSL, important habitat areas have been identified          areas in relation with spawning aggregations of cape-
based on habitat and prey modeling, visual sight-          lin Mallotus villosus (Whitehead et al. 1982, Johnson
ings, and acoustic detections, which include areas         & Davoren 2021). Preliminary summer abundance es-
along the Scotian Shelf edge and the southern edge         timates derived from large-scale systematic surveys
of the Grand Banks off Newfoundland (Gomez et al.          indicate that about 6000 humpback whales occur off
2017, 2020, Lesage et al. 2018, Moors-Murphy et al.        eastern Canada (Lawson & Gosselin 2011, 2018).
2019). A low number of sightings during large-scale,       Humpback whales generally migrate from northern
systematic, aerial surveys off eastern Canada pre-         summer feeding grounds to lower-latitude winter
cluded abundance estimates (Lawson & Gosselin              breeding grounds. However, passive acoustic moni-

Delarue et al.: Baleen whale occurrence off eastern Canada                         267

toring (PAM) studies have revealed that a portion of         the deployment of 20 recorders (Stns 1−20) through-
the population remains in high-latitude waters in win-       out the Scotian Shelf, Newfoundland Shelf, and the
ter, or migrates late in the season, such that the           southern Labrador Shelf. The study focused on areas
species is present in Canadian waters for most of the        where anthropogenic activities were concentrated or
year (Kowarski et al. 2018, 2021a, Davis et al. 2020).       expected in the near future and where marine mam-
  PAM has become a commonly used method for                  mal occurrence has been poorly described. For that
studying marine mammal occurrence over space and             reason, areas where baleen whale occurrence is well
time (Zimmer 2011, Browning et al. 2017). PAM is a           documented (e.g. GSL, Bay of Fundy, inshore areas
cost-effective means for year-round monitoring in            of Newfoundland) were not included. Stns 21−25
areas otherwise hard to access and costly to survey          were deployed as part of an ongoing PAM program
using visual methods. Technological and data-                conducted by Fisheries and Oceans Canada (DFO) to
processing advances have made the collection and             help address knowledge gaps for species at risk
timely treatment of large data sets possible (Ko-            (including blue and North Atlantic right whales) and
warski & Moors-Murphy 2021). PAM has been                    for marine protected area monitoring purposes around
widely applied to monitor baleen whales worldwide.           Nova Scotia. Spacing between stations ranged from
Indeed, the widespread production of stereotypical           ca. 40 to 260 km.
songs by males (mostly seasonal) with generally high           All acoustic data were acquired using autonomous
source levels and long propagation ranges (Širović et        multichannel acoustic recorders (AMARs; JASCO
al. 2007, Stafford et al. 2007, Garcia et al. 2019)          Applied Sciences) configured to sample at 8 kHz
makes many baleen whale species ideal subjects for           with a 24-bit resolution and a duty cycle of 11 min
PAM. Non-song vocalizations produced by either sex           18 s every 20 min. The AMARs were equipped with
can also be used to monitor species presence when            M36-V35-100, M8Q-51 (GeoSpectrum Technology,
songs are absent, rare, or are not the dominant vocal-       GTI), or HTI-99-HF hydrophones (High Tech, HTI).
ization type, although these types of vocalizations          All hydrophones had a flat frequency response be-
tend to be less consistent and regularly produced            tween 10 and 100 000 Hz. GTI hydrophones have a
(see e.g. Simard et al. 2016).                               sensitivity of −165 dB re 1 V μPa–1 and noise floor of
  Here, we aimed to provide a year-round pluri-              165 dB re 1 μPa. HTI hydrophones have a sensitivity
annual description of the minimum occurrence of              of −164 dB re 1 V μPa–1 and noise floor of 165 dB re
blue, fin, and humpback whales in subarctic eastern          1 μPa. Recording systems were calibrated using a
Canadian waters using PAM data collected at 25 re-           reference tone at 250 Hz produced by a pistonphone
cording stations from 2015 to 2017. The analysis             type 42AC precision sound source (GRAS Sound &
methodology applied in this study proved inade-              Vibration) before and after each deployment. The
quate for a thorough description of North Atlantic           location of Stn 19 was shifted during the second year
right, sei, and minke whale occurrence. The acoustic         of data collection, and recorders deployed at Stns 3
occurrence of these species will be presented briefly        and 7 were lost during the first and second deploy-
here, with more detailed analyses either ongoing             ments, respectively. Data collection was uninter-
(North Atlantic right and sei whales) or left for future     rupted between both years in the ESRF study (except
work (minke whales). The findings of this study are          Stns 9 and 10) but not in the DFO study and started
intended to serve as a baseline for the long-term            earlier and ended later in the DFO study (Table 1).
assessment of changes in the occurrence of blue, fin,
and humpback whales off eastern Canada, to guide
future research and monitoring efforts, and to inform                    2.2. Detection range modeling
the identification of important habitats for manage-
ment and conservation purposes.                                 An important parameter for interpreting data on
                                                             marine mammal acoustic occurrence is the detection
                                                             range, which in this study represents the maximum
          2. MATERIALS AND METHODS                           range from a recorder at which a signal of a given
                                                             source level can be identified by an automated de-
                 2.1. Data collection                        tector in given background sound conditions (see
                                                             Section 2.4 for description of automated detectors).
  Acoustic recorders (n = 25) were deployed between          Modeling detection ranges also allows assessing the
2015 and 2017 (Fig. 1). A 2 yr study funded by the           potential overlap in the detection area of adjacent sta-
Environmental Studies Research Fund (ESRF) allowed           tions. Detection range modeling was applied to the
268                                       Endang Species Res 47: 265–289, 2022

Fig. 1. Study area in eastern Canada and location of the 25 acoustic recorders deployed between May 2015 and November
2017. Also shown are blue, fin and humpback whale detection areas assuming 50% probability of detection under median
   ambient noise conditions. Bathymetric features are responsible for the uneven shapes of the detection areas (e.g. Stn 14)

song notes of blue, fin, and humpback whales, which             deviation. Vocalization SL, bandwidth, and calling
are the vocalizations on which this study is focused            depth were obtained from the literature (see Table S1
(see Section 2.3). Detection ranges were modeled for            in the Supplement at www.int-res.com/articles/suppl/
the fall (September to November), when these species            n047p265_supp.pdf). A broad range of SL values for
were most acoustically abundant throughout the area.            song notes of blue, fin, and humpback whales have
   To evaluate the detection ranges, the received               been published, not all directly applicable to our focal
level, RL(r) (in dB re 1μPa ), measured at the distance         species and study area, but nonetheless complicating
r from the source, was modeled as:                              the choice of what value to use in the modeling. For
                                                                blue whales, we used the midpoint of estimates for
                   RL(r) = SL – PL(r)                   (1)
                                                                the northern subspecies Balaenoptera musculus mus-
where SL is the source level (in dB re 1μPa ), modeled          culus, adjusted down by 1 dB to account for the nar-
as a Gaussian distribution with a mean and standard             rower frequency band of North Atlantic song notes,
Delarue et al.: Baleen whale occurrence off eastern Canada                                  269

Table 1. Location, depth, and deployment time frame for the 25 recording locations. For continuous recording periods, the service
date refers to the date when the recorder deployed during the first year was retrieved and a new recorder was deployed for the
second year of monitoring. na: not applicable, either because data were recorded during one year only or because there was an
interruption between both recording years. The location of Stn 19 was different in both years and is referred to as 19A and 19B

 Station      Latitude (°N)     Longitude (°W)     Depth (m)       Deployment         Service date       Retrieval/record end

 1              46.99134            60.02403           186          17-Aug-15            8-Jul-16               10-Jul-17
 2              45.42599            59.76398           126          18-Aug-15           21-Jul-16                9-Jul-17
 3              44.14955            60.596              72            22-Jul-16            na                    8-Jul-17
 4              43.21702            60.49943          1830          19-Aug-15           22-Jul-16                8-Jul-17
 5              42.54760            62.17624          2002          19-Aug-15           23-Jul-16                8-Jul-17
 6              44.85309            55.27108          1802          22-Aug-15           20-Jul-16               23-Jul-17
 7              45.70082            51.23315            78          23-Aug-15           19-Jul-16               19-Jul-16
 8              47.49307            59.41325           428          16-Aug-15            8-Jul-16               10-Jul-17
 9              48.92733            58.87786            44          16-Aug-15              na                  26-Apr-16
                                                                       9-Jul-16            na                   10-Jul-17
 10             51.26912            57.53759            121           3-Aug-15             na                    5-Jul-16
                                                                      10-Jul-16            na                   11-Jul-17
 11             55.60300            57.75040           158            9-Aug-15          13-Jul-16               14-Jul-17
 12             57.25273            60.00175           143          10-Aug-15           13-Jul-16               14-Jul-17
 13             55.22797            54.19047          1750            8-Aug-15          11-Jul-16               15-Jul-17
 14             53.01567            53.46022           582            4-Aug-15          14-Jul-16               16-Jul-17
 15             50.41327            49.19638          2000          14-Aug-15           16-Jul-16               18-Jul-17
 16             44.19230            53.27441          1602          23-Aug-15           20-Jul-16               22-Jul-17
 17             44.97141            48.73373          1282          24-Aug-15           18-Jul-16               21-Jul-17
 18             46.90877            48.50418           111          25-Aug-15           18-Jul-16               20-Jul-17
 19A            48.72873            49.38087          1282          25-Aug-15              na                   17-Jul-16
 19B            48.38020            46.5254           1547            17-Jul-16            na                   19-Jul-17
 20             50.75232            52.33602           237          13-Aug-15           15-Jul-16               18-Jul-17
 21             46.35540            58.72768           341           17-Jun-15             na                  1-May-16
                                                                     23-Sep-16             na                 23-Nov-17
 22             46.16837            59.14563             87          16-Jun-15             na                  1-May-16
                                                                     24-Sep-16             na                  29-Oct-17
 23             44.52339            57.14949            478          22-Sep-15             na                  13-Jan-16
                                                                    11-Nov-16              na                   2-Dec-17
 24             43.83924            58.97786          1610          23-May-15              na                 10-May-16
                                                                     20-Sep-16             na                   1-Dec-17
 25             43.60871            62.86832            200         24-May-15              na                  20-Apr-16
                                                                     16-Sep-16             na                 25-Nov-17

even though several other estimates are available                  loss that is a non-random parameter computed using
for Antarctic B. m. intermedia and pygmy B. m. brevi-              JASCO’s Marine Operations Noise Model (MOMN).
cauda blue whales (Širović et al. 2009, Samaran et al.             MONM is a range-dependent parabolic equation
2010, Bouffaut et al. 2021). For fin whales, we selected           model based on the range-dependent acoustic model
a value near the midpoint of 2 SL estimates in the                 (Collins 1994) for frequencies below 2 kHz. Propaga-
North Atlantic, weighting more heavily the estimate                tion loss was calculated within a 3-dimensional
by Wang et al. (2016) derived for the Gulf of Maine,               volume (easting, northing, and depth) around each
close to our study area, and acknowledging that the                recorder up to 150 km (except 200 km for Stn 13) for
range of SL is much broader (see e.g. Charif et al.                fin and blue whale calls and 50 km (except 100 km at
2002, Garcia et al. 2019). For humpback whales, we                 Stn 20) for humpback whales, with a horizontal sepa-
used a value near the upper end of the range of SL for             ration of 20 m between receiver points along the mod-
various song units under the assumption that the                   eled radials. The sound fields were modeled with a
louder units are those most likely to be detected. PL(r)           horizontal angular resolution of 10° for a total of 36 ra-
(in dB re 1μPa ) is the range-dependent propagation                dial planes. Receiver depths were chosen to span the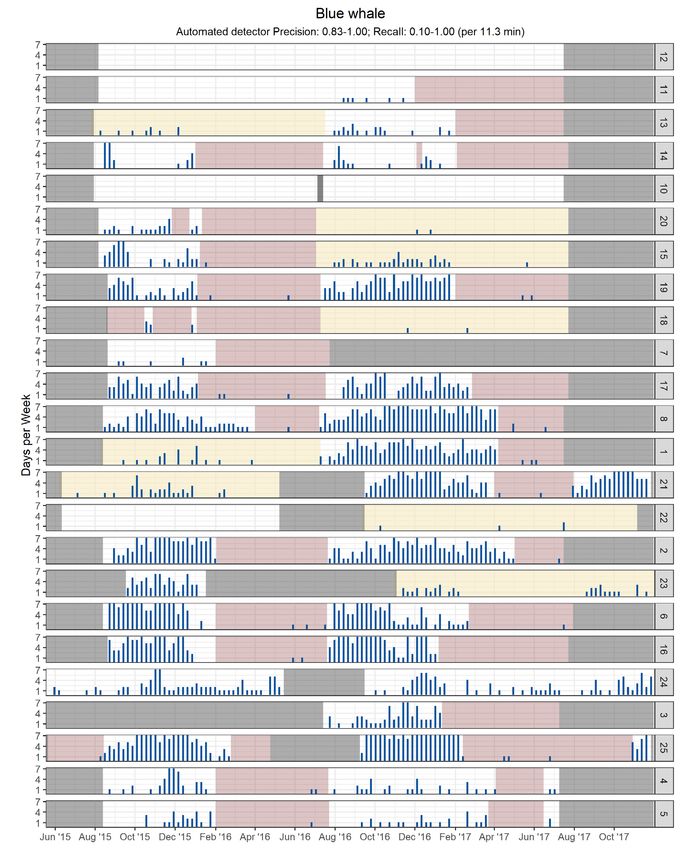
270                                         Endang Species Res 47: 265–289, 2022

entire water column over the modeled areas, from 2 m            10th percentile of the noise distribution. We then dis-
to a maximum of 3000 m, with step sizes that                    cretized the signal model and noise measurements
increased with depth. Water depths throughout the               into 0.5 dB bins (SLj and NLi) and computed PL(r) for
modeled area were extracted from the SRTM15+ grid               all combinations of NLi and SLj. We extracted the 10th
(Smith & Sandwell 1997, Becker et al. 2009). The prop-          and 50th percentiles of this distribution for generating
agation loss value was calculated using a sound speed           plots and tables of maximum and median detection
profile characteristic of the selected season (fall, i.e.       ranges, respectively.
September to December). The sound speed profiles
for the modeled site were derived from temperature
and salinity profiles of the US Naval Oceanographic                    2.3. Targeted marine mammal signals
Office’s Generalized Digital Environmental Model V
3.0 (GDEM; Teague et al. 1990, Carnes 2009). The                   Baleen whales generally produce stereotyped
GDEM temperature−salinity profiles were converted               species-specific signals, at least seasonally. In blue,
to sound speed profiles according to Coppens (1981).            fin, and humpback whales, these signals form the
   Where possible, geoacoustic profiles were ob-                basis of songs, which are defined as a series of notes
tained via inversion modeling performed at 15 of the            arranged in a stereotyped pattern (Payne & McVay
monitoring sites (Deveau et al. 2018). At the sites             1971) and are produced by males (Croll et al. 2002,
where locally derived profiles were unavailable, the            Darling et al. 2006, Oleson et al. 2007). Although
profile of the nearest site or a default profile used in        minke and sei whales produce patterned vocaliza-
previous modeling exercises by JASCO for similar                tions, these have not been formally characterized as
areas was used (see Table S2).                                  songs to date, although it has been suggested for sei
   The automated detection of marine mammal vocal-              whales (Tremblay et al. 2019). The song-forming
ization is assumed to occur if RL is greater than the           vocalizations targeted in this study are the fin whale
local noise level in the frequency band of vocaliza-            20 Hz pulses (Watkins et al. 1987), blue whale A-B
tions (NL) by a constant threshold c:                           vocalizations (Mellinger & Clark 2003, Berchok et al.
                                                                2006), and humpback whale tonal vocalizations,
                        RL (r) ≥ NL + c                   (2)
                                                                which form the basis of song units in various forms
  The threshold c must be chosen such that there is             (Au et al. 2006, Girola et al. 2019) but also occur as
very little chance of a false positive (FP) due to ambi-        non-song vocalizations (Dunlop et al. 2007). The
ent noise, and such that the probability that the auto-         other stereotyped vocalizations identified during
mated algorithms will detect a signal when present is           analysis were sei whale downsweeps (Baumgartner
at least 50%. Depending on the species of interest,             et al. 2008), North Atlantic right whale upcalls (Parks
JASCO’s automated detectors use constants of                    et al. 2011, Davis et al. 2017), and minke whale pulse
3−6 dB, which satisfies these constraints.                      trains (Risch et al. 2014b) (Fig. 2).
  The distribution of NL was determined empirically                The songs of blue, fin, and humpback whales gen-
from the measurements performed on the data                     erally occur between August and April coincident
recorded at each station. We used sound pressure                with the breeding season in the northern hemisphere,
level percentiles (see Delarue et al. 2018 for Stns             including the study area (Watkins et al. 2000, Stafford
1−20; JASCO unpubl. data for Stns 21−25) for the                et al. 2007). They have been recorded year-round in
deployment that was least influenced by flow, moor-             some areas, though less frequently than during the
ing, and seismic noise, which can be dominant at the            breeding season (Morano et al. 2012, Vu et al. 2012,
low frequencies of interest. Thus, NL has discrete              Simard et al. 2016, Roy et al. 2018). Minke whales fol-
values and the final probability of detection, PD , as a        low the same seasonal pattern of sound production,
function of range is:                                           with pulse trains essentially absent from late spring to
                                                                late summer (Risch et al. 2013, 2014a). Our under-
      PD (r ) = 1  P(NL i ) CDFSL (NL i + c + PL(r ))   (3)   standing of sei whale seasonal acoustic behavior is
                 NL i                                           poor, but there is evidence for year-round downsweep
where CDFSL (NLi + c + PL(r)) is the cumulative prob-           production (Davis et al. 2020). Right whales also pro-
ability of the source level exceeding NLi + c + PL(r).          duce upcalls year-round (Davis et al. 2017).
To further constrain the modeling so that the pre-                 Outside of the breeding season, balaenopterid
dicted ranges do not become unreasonably long, the              whale vocalization rates and stereotypy generally de-
maximum SL considered is the 90th percentile of the             crease. In addition, non-song vocalizations of blue
SL distribution, and the minimum noise level is the             and fin whales, which are the main signals produced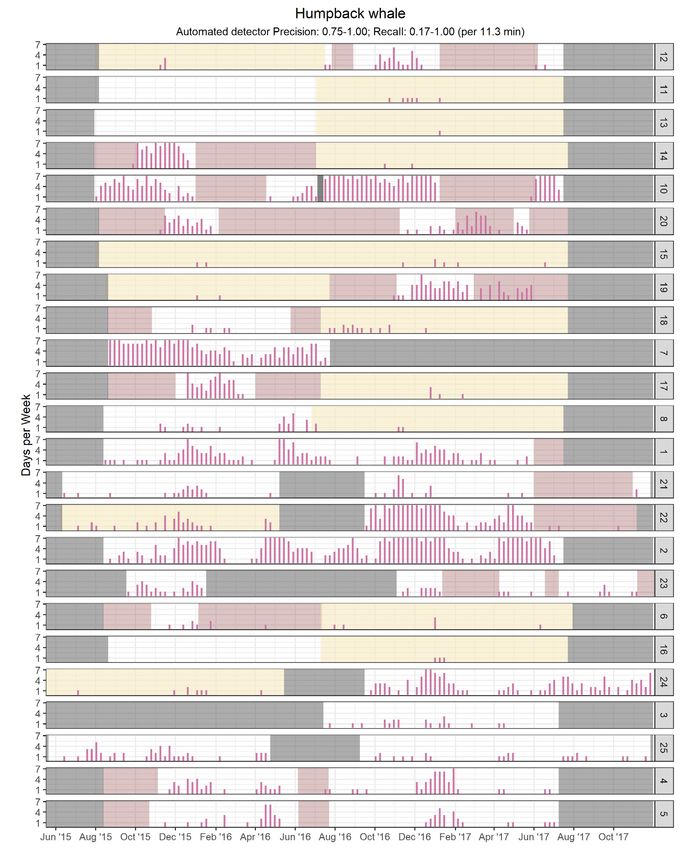
Delarue et al.: Baleen whale occurrence off eastern Canada                            271

Fig. 2. Spectrograms of vocalizations targeted for automated or manual detections. The calls of each species are coded as
follows. FW: fin whale 20 Hz pulse; BW: blue whale A-B call; HB: humpback whale tonal call; SW: sei whale downsweep;
                                   RW: right whale upcall; MW: minke whale pulse train

from late spring to mid-summer, and sei whale down-            whale pulse trains, for which an automated detector
sweeps show higher similarity in contours (Ou et al.           was not implemented when the data were analyzed.
2015), limiting the efficacy of automated detectors            For each automated detector, specific spectrogram
and increasing the difficulty of reliable species identi-      parameters were applied (Table S3) before the algo-
fication. These ‘summer’ non-song vocalizations for            rithm searched the spectrogram for contours. Con-
blue whales (Berchok et al. 2006) and fin whales               tours were assigned to a species if they were within
(Watkins 1981) were identified manually while vali-            the range of values in the template for the correspon-
dating automated detections (see Section 2.4).                 ding signal (Table S4). The automated detection
                                                               algorithms applied to the data were described in
                                                               detail by Kowarski et al. (2020).
 2.4. Automated detection and manual validation                   A subset of acoustic files was selected from each
                                                               station and deployment for manual validation by ex-
   Baleen whale acoustic signals were automatically            perienced analysts to evaluate automated detector
detected using a JAVA-based contour-following                  performance, using the methodology described by
algorithm that matched contour parameters to a                 Kowarski et al. (2021b). An automatic data selection
library of templates representing the vocalizations of         for validation algorithm selected files for validation
the target species. The only exceptions were minke             such that the file subset matched the corresponding
272                                       Endang Species Res 47: 265–289, 2022

data set’s distribution of (1) the number of automated         ance of the automated detectors was then described
detections per file for each automated detector; (2)           using precision (P) and recall (R). P represents the
the number of automated detectors triggered per file;          proportion of files with detections that are TPs. R rep-
and (3) the temporal spread of files containing detec-         resents the proportion of files containing the signal of
tions for each automated detector across the record-           interest that were identified by the detector.
ing period. This multi-species approach allowed the               Where the number of validated detections was too
performance of multiple automated detectors in                 low, or the overlap between manual and automated
diverse background noise conditions to be assessed             detections was too limited for the calculation of P, R,
simultaneously. The size of the validation subset cho-         and MCC, automated detections were ignored, and
sen for this study was 0.5% of the sound files in each         only validated results were used to describe the
data set (11.5 min files, n = ~160 per station per year,       acoustic occurrence of a species.
or ~7680 files total representing 1472 h of data) due             The automated detector performance algorithm
to analysis time constraints and the overall size of the       determines a threshold based on the number of
data set. Although the automated detectors classify            detections per 11.5 min file for each species, station,
individual signals, we validated the presence/                 and deployment combination that maximizes the
absence of species at the file level, not the detection        MCC score. A species was considered absent if the
level.                                                         automated detection count was below that threshold.
   The following restrictions were further applied to          Here, we only used results from automated detectors
the automated detector results. If a species was               whose post-threshold P ≥ 0.75. When P < 0.75, the
automatically detected at a location but no vocaliza-          manual detections were instead used to describe the
tions were found by analysts during the manual val-            acoustic occurrence of a species. This was the case
idation process (either during a specific period or            for North Atlantic right and sei whale vocalizations at
the whole recording period), all automated detec-              all stations. Because the manual detections of these,
tions during the relevant period were deemed FPs               along with minke whale vocalizations, were not ob-
and excluded from further processing. For example,             tained in a systematic manner, their acoustic occur-
the automated humpback whale detector was                      rence was summarized as overall presence/absence
falsely triggered by ice noise in northern stations            per station, where a single detection during the study
through winter when the species was never manu-                was needed to indicate presence.
ally confirmed to be acoustically present. Therefore,             The minimum acoustic occurrence of blue, fin, and
all automated humpback whale detections from                   humpback whales is presented following the tem-
these locations and times were deemed FPs and                  plates used by Davis et al. (2020). Where automated
were excluded from the final occurrence results.               detections are shown, the exclusion periods and
Periods during which detections were excluded are              detection count threshold, if any, have been applied.
referred to as exclusion periods (see Tables S6−S8             Time series showing the number of days per week
and see Figs. 4, 6, & 8).                                      with automated and/or manual detections for each
   The performance of each automated detector and              station over the 2 study years are provided. In addi-
any necessary thresholds (minimum number of auto-              tion, the proportion of days with automated de-
mated detections per file to consider species present)         tections during the entire recording period was plot-
was determined using a maximum likelihood estima-              ted at each station by season. Spring is defined as
tion algorithm. This algorithm compared the auto-              1 March to 31 May, summer as 1 June to 31 August,
mated and validated results and maximized the                  fall as 1 September to 31 November, and winter as
probability of detection while minimizing the num-             1 December to 28/29 February. The total number of
ber of false alarms using the Matthews correlation             detection (manual and/or automated) days was di-
coefficient (MCC):                                             vided by the total number of recording days to
                                                               account for recording effort. Sea ice extent (© 2021
                       TP TN  FP FN
 MCC =                                                   (4)   EUMETSAT) for 15 March 2016 and 2017 (approxi-
          ( TP + FP) ( TP + FN ) ( TN + FP) ( TN + FN )
                                                               mate seasonal maximum) was displayed on the
                     TP           TP                           spring plot, when the minimum acoustic occurrence
              P=           ;R =                         (5)
                   TP + FP      TP + FN                        was observed. A detailed analysis of sea ice as a
where TP (true positive) is the number of files with           driver of seasonal occurrence was beyond the scope
valid automated detections, FP is the number of files          of this paper, but this is intended to illustrate the
with false detections, and FN (false negative) is the          loss of physical habitat to marine mammals occurring
number of files with missed detections. The perform-           in winter off eastern Canada.
Delarue et al.: Baleen whale occurrence off eastern Canada 273
3. RESULTS detection ranges (using the highest source levels and
lowest noise levels in Eq. 3) were limited to the max-
3.1. Detection range modeling imum modeling extent (150 km) at 11 and 8 of 25 sta-
tions for fin and blue whales, respectively, and 10 of
The detection ranges presented here should be 25 stations for humpback whales (50−100 km extent),
considered with the following points in mind. The re- indicating that longer maximum ranges are possible.
sults are based on ambient background sound levels Most stations along the continental slope showed
as recorded near the ocean bottom by the recorders large variation in detection ranges depending on
during fall, when most automated detections oc- source direction, reflecting the effect of bathymetry
curred. Expected detection ranges could differ under in relation to the source-receiver orientation (e.g. see
different deployment scenarios (e.g. recorder in the blue whales at Stn 13, Fig. 1). Northern stations
sound channel or at the surface) or different seasons (Stn 19A and all stations north of Stn 19A) had gener-
(due to different sound speed profiles or presence of ally larger detection areas for fin and blue whales
sea ice, which would reduce detection ranges due to than those further south. Stn 20 had noticeably longer
increased refraction caused by the irregular under- detection ranges than any other station for all species.
ice surface). Perhaps more importantly, although the The shorter ranges at Stn 19B reflect the effects of
modeling is based on a range of source levels (SL high noise levels between 13 and 30 Hz due to flow-
± 3−5 dB) which represent a consensus across several induced mooring noise (see Delarue et al. 2018).
relevant publications (see Section 2.2 and Table S1),
the actual source level range is likely broader, which
could result in substantial variations in detection 3.2. Automated detector performance
ranges compared to those presented here. However,
these results are valuable to understand the typical The evaluation of automated detector performance
acoustic coverage of recorders for each species/ was based on the manual review of 1472 h of data.
vocalization type in eastern Canada. The automated detector performance metrics are
The median and maximum detection ranges for fin, presented in Tables S6−S8 and summarized in Fig. 3.
blue, and humpback whale vocalizations are pro- Automated detector performance varied between
vided in Table S5 and Fig. 1. Table S5 specifically species, stations, and year. The fin whale detector
lists the minimum and maximum detection ranges for performed best overall, while the humpback whale
the 10th and 50th percentile of noise levels across all detector had the lowest performance. Fin, blue, and
modeled radials, further highlighting the wide spec- humpback whales had 3, 8, and 14 data sets, respec-
trum of possible ranges. Humpback whale song tively, for which P was below 0.75 or none of the
notes can be detected over much smaller areas than automated detections were manually validated. R
those of blue and fin whales. Overlapping detection was generally lower than P, the detectors identifying
ranges at adjacent stations suggest that fin and blue on average 40−70% of sound files containing vocal-
whale vocalizations could be heard at multiple re- izations. However, daily R can be expected to be
corders simultaneously. This was confirmed oppor- higher than per-file R (Kowarski et al. 2020). Indeed,
tunistically for both species at Stns 1 and 8, on either a single file (out of 72 files per day) with detection is
side of the Cabot Strait (73 km apart). The longest required for daily presence to be confirmed, and it is
Fig. 3. Precision (dark grey) and recall (light grey) scores for blue, fin, and humpback whale automated detectors across the
stations where they were detected (sample size shown above each bar group) for both recording years. Boxes show the 25th,
50th and 75th percentiles, crosses show the mean, whiskers show the 5th and 95th percentiles, and dots show outliers274 Endang Species Res 47: 265–289, 2022
therefore unlikely that relatively low per-file R would ber at that station is an artefact of the exclusion
have a significant impact on the detections presented period applied to exclude FPs caused by seismic air-
here. Nevertheless, the results should be considered gun pulses. During spring, fin whale vocalizations
estimates of the minimum presence of each species. occurred more frequently at the Flemish Pass and
adjacent areas (Stns 17, 19A, and 19B), as well as the
western Scotian Shelf (Stn 25) than throughout the
3.3. Blue whale minimum presence rest of the study area. Summer acoustic occurrence
was generally low, except on the western Scotian
Blue whale A-B vocalization detections (both auto- Shelf and in the Gully Canyon (Stns 25 and 24).
mated and manual) occurred year-round in eastern
Canadian waters (Figs. 4 & 5). Detections started as
early as late July, increased in August, and continued 3.5. Humpback whale minimum presence
throughout the fall, albeit more regularly in the
southern half of the study area. They stopped as Humpback whale vocalizations were detected
early as November off Labrador and ceased increas- (manually and/or automatically) at all stations except
ingly later from north to south. The acoustic occur- Stn 9 (Figs. 8 & 9). Detections were notably high in
rence of blue whales was at its lowest in late spring the Strait of Belle Isle (Stn 10), eastern Scotian Shelf
and early summer. (Stns 2 and 22), and southern Grand Banks (Stn 7). In
In fall and winter, blue whales were most consis- the Strait of Belle Isle, humpback whales were de-
tently detected at stations associated with the Lau- tected nearly daily in both years from June to
rentian Channel, the southern edge of the Grand December. Stn 7 was only monitored during the first
Banks, and the Scotian Shelf. They were almost year but saw sustained detections throughout the
never heard in the Strait of Belle Isle or on the south- monitoring period with a peak in summer and fall. A
ern Labrador shelf. Off Newfoundland, blue whale high number of weekly detection days at Stns 10 and
vocalizations were more common at stations along 7 in summer indicate that positive detections are not
the slope of the Grand Banks than on the shelf, par- reliant on the presence of songs, which were not
ticularly at the northern end of the Flemish Pass (Stn observed in this season during manual validation.
19B) despite much shorter detection ranges than at In the Cabot Strait (Stns 1 and 8), detections were
nearby sites (Table S5). In waters surrounding Nova consistently higher on the south side. Similarly, along
Scotia, blue whale vocalizations in fall and winter the southern edge of the Laurentian Channel, detec-
were more common in the Laurentian Channel and tions were consistently higher on the shelf (Stn 22)
on the Scotian Shelf than at deep stations along the than along the slope of the channel (Stn 21). At deep
slope of the Scotian Shelf. stations along the continental slope, detections were
generally lower than at stations on the shelf and close
to shore. Notable exceptions were in the Gully Can-
3.4. Fin whale minimum presence yon (Stn 24) and north of the Flemish Pass (Stn 19B).
Humpback whales were rarely detected at the north-
Fin whale 20 Hz pulses generally occurred follow- ern stations (Stns 11−14), except during fall 2015 at
ing a well-defined seasonal pattern with an increase Stn 14. Where detections were rare, they were gen-
in the fall/winter and decrease in the spring/summer, erally concentrated during the winter months, some-
with the contraction more prominent at northern sta- times with a secondary peak in spring (e.g. Stns 4
tions (Figs. 6 & 7). Some of the southern stations and 5). During winter, detections occurred at almost
(Stns 24 and 25) had detections year-round. The de- all stations with a predominance at southern stations.
tection periods were notably shorter at northern sta- In contrast, spring and summer had the fewest sta-
tions, specifically on and off the Labrador shelf (Stns tions with detections.
11−13), on the northern Banks (Stns 14 and 20), and
in the Strait of Belle Isle. At many stations, the end of
the detection period in the spring represents the start 3.6. Other baleen whale species
of the exclusion period.
The sustained occurrence of fin whale vocaliza- North Atlantic right whale upcalls were manually
tions at Stn 19B well into the spring is worth noting detected sporadically at Stns 1, 2, 22, and 25 from
due to the short signal detection ranges modeled June to December. Isolated detections occurred in
there (see Fig. 1). The abrupt detection onset in Octo- September 2016 at Stn 10 and November 2016 atDelarue et al.: Baleen whale occurrence off eastern Canada 275
Fig. 4. Weekly presence summary, showing the number of days per calendar week with confirmed blue whale acoustic pres-
ence for each recording site (except Stn 9) between May 2015 and November 2017. Stations (numbers on the right) are
arranged north to south. Grey blocks indicate weeks with no available data. Pink blocks indicate exclusion periods (when au-
tomated detections were ignored). Yellow areas represent deployments for which the output of the automated detector was
not used when there was at least one manual detection. The first half of data for Stn 19 represents data collected at Stn 19A,
while the second half represents data collected at Stn 19B276 Endang Species Res 47: 265–289, 2022
Fig. 5. Blue whale seasonal occurrence. Proportion of recording days per season with confirmed Atlantic blue whale
acoustic detections, summarized for all available recording locations between June 2015 and November 2017. Sea ice data:
© 2021 EUMETSATDelarue et al.: Baleen whale occurrence off eastern Canada 277
Fig. 6. Same as Fig. 4, but for fin whales278 Endang Species Res 47: 265–289, 2022
Fig. 7. Same as Fig. 5, but for fin whalesDelarue et al.: Baleen whale occurrence off eastern Canada 279
Fig. 8. Same as Fig. 4, but for humpback whales280 Endang Species Res 47: 265–289, 2022
Fig. 9. Same as Fig. 5, but for humpback whalesDelarue et al.: Baleen whale occurrence off eastern Canada 281 Stn 6 (Fig. 10). Several tentative detections were relatively high detections with vocalizations re- made at other stations, suggesting that a dedicated corded primarily from late winter to early summer manual analysis of the data could reveal a broader and again in fall (Fig. 10). Detections occurred more acoustic presence of this species in eastern Canadian frequently at the deep stations off the continental waters. shelf than on the shelf. Although an automated de- Minke whale pulse trains were manually detected tector was designed to find sei whale downsweeps, at Stns 1, 2, 3, 5, and 16 (Fig. 10). Detections occurred the presence of seismic airgun pulses off northeast- sporadically between late July and mid-December, ern Newfoundland affected its performance. Off except at Stn 3, where minke whales were consis- Nova Scotia, where blue whales are more common, tently detected from August until mid-November the similarity between sei whale downsweeps and 2016. blue whale D-calls also impacted automated detector Sei whales were manually detected at all stations performance. except those associated with the GSL (Stns 1, 8, 9, and 10) and Stn 3. The prime detection area was off the southern Labrador Shelf (Stn 13) and in the 4. DISCUSSION AND CONCLUSIONS Orphan Basin (Stns 15, 19A, and 19B) where detec- tions occurred almost exclusively from May to The acoustic detections presented here represent November. The Scotian Slope (Stns 4, 5, and 24), and the minimum occurrence of baleen whales off east- to a lesser extent the Scotian Shelf (Stn 25), also had ern Canada within the detection range of each re- Fig. 10. Stations where minke, sei, and North Atlantic right whale (NARW) vocalizations were acoustically detected at least once
282                                      Endang Species Res 47: 265–289, 2022

corder. The detection areas shown in Fig. 1 are based        (August to April) remain a challenge for automated
on a subset of source level values that does not en-         detectors and, to some extent, also for experienced
compass the full possible range of source levels for         analysts.
each species. In addition, detection ranges are the
result of the interaction of variable source levels and
time-varying background noise and sound propaga-                                4.1. Blue whales
tion conditions, making it difficult to know the area
being actually monitored at any given time. A lack of           The occurrence of blue whales in eastern Canada
detections (particularly when relying on the manual          was reviewed by Lesage et al. (2018) and Moors-
review results only) does not indicate the absence of        Murphy et al. (2019), and several areas of importance
non-vocalizing animals. Animals may be present but           to blue whales for migration and foraging were pro-
not vocalizing, may be producing vocalizations not           posed. These include several foraging areas in the
targeted by the automated detectors, or their vocal-         GSL and a migration corridor through the Cabot
izations may be masked by ambient or anthropo-               Strait in and out of the GSL. Our consistent acoustic
genic noise. Although the manual validation effort           detections in the Cabot Strait, extending from late
was distributed across the duration of each data set,        July to April, suggest a steady flow of individuals in
the relatively low number of validated files may have        and out of the GSL throughout most of the year but
resulted in analysts missing isolated vocalization           could also indicate that some individuals use this
events when exclusion periods were implemented.              area for purposes beyond migration (e.g. mating and
However, the results are unlikely to mischaracterize         foraging). Indeed, satellite tagging studies have de-
the overall species occurrence.                              monstrated individuals foraging in the Cabot Strait
   Call stereotypy and species specificity are key fac-      (Lesage et al. 2017). The entirety of the Laurentian
tors that affect the ability of automated detectors to       Channel appears to be important to blue whales with
accurately represent species presence. The vocaliza-         detections near its end (Stns 23 and 6) and beyond
tions of fin, blue, minke, and sei whales fulfill these      along the southern Grand Banks (Stn 16), extending
requirements. Humpback whale tonal vocalizations             well into February. Although most satellite-tagged
are less stereotyped. However, they generally occur          blue whales headed towards the Scotian Shelf after
in predictable frequency bands. Generic automated            passing through the Cabot Strait (Lesage et al. 2017),
detectors developed for humpback whale vocaliza-             the intensity of acoustic detections in fall along the
tions within these bands can have limited perform-           southern edge of the Grand Banks suggests that at
ance in noisy environments but perform well in areas         least some individuals head east after exiting the
where humpback whales vocalize actively (Kowarski            Laurentian Channel. The only station in the GSL was
et al. 2018). Because of their potential similarity to       Stn 10, located at the eastern edge of the Mecatina
humpback whale vocalizations, confidence in the              Trough area, which was identified by Lesage et al.
output of the automated right whale upcall detector          (2018) as important blue whale habitat based on high
can be compromised in areas where humpback                   predicted krill aggregations and high blue whale
whales co-occur and are abundant.                            catches during whaling operations between 1925
   Variable performance of the same automated de-            and 1958, despite a scarcity of more recent sightings
tectors across stations or even between years at the         in the area. The lack of blue whale acoustic detec-
same stations highlights the need to evaluate auto-          tions at Stn 10, which is consistent with the lack of
mated detector results on a case-by-case basis               detections during an earlier 1 yr acoustic study in the
(Kowarski & Moors-Murphy 2021). Inter-annual vari-           same area (Simard et al. 2016), suggests that this
ations in performance reflect varying background             area is not regularly used by blue whales, although
noise conditions and species presence. Factors influ-        this may reflect short detection ranges and the re-
encing performance included a low number of TPs              corder being located at the edge of the Mecatina
and the presence of confounding signals (e.g. vessel-        Trough.
associated tonal sounds in the case of the blue whale           Two other areas of higher blue whale acoustic
detector; airgun pulses in the case of fin and sei           occurrence outside the GSL were the Scotian Shelf
whale detectors; humpback whale vocalizations in             and the Flemish Pass. Several tagged blue whales
the case of the North Atlantic right whale detector).        transited near Stn 2 on the eastern Scotian Shelf,
For fin and blue whale vocalizations, lower calling          sometimes repeatedly, on their way out of the GSL
rates, greater call variability, and overlap in call char-   (Lesage et al. 2017). Blue whale vocalizations were
acteristics outside of the song production months            recorded at this station regularly between late July
Delarue et al.: Baleen whale occurrence off eastern Canada                         283

and the end of April, suggesting that this area may                              4.2. Fin whales
not be just a migratory corridor. In fall and winter, the
recorder deployed in Emerald Basin on the Scotian               Uniformity in the acoustic occurrence of fin
Shelf (Stn 25) also consistently recorded a high num-        whales observed throughout the study area sug-
ber of detections. P and R values for these stations         gests a broad distribution across eastern Canadian
were high in both years, indicating that the acoustic        waters from late summer to winter and makes it dif-
occurrence of blue whales was accurately character-          ficult to identify specific areas that may be of
ized. This area partially overlaps a cluster of blue         greater importance to this species, if any. It may be
whale sightings recorded during a short period of            that their varied diet, made of zooplankton and
whaling off Nova Scotia (1967−1972), which ex-               small schooling fish (Gavrilchuk et al. 2014), pro-
tended towards the shelf break (Sutcliffe & Brodie           vides them more flexibility in habitat choice de-
1977). Interestingly, the closest stations along the         pending on prey availability and distribution, result-
Scotian Slope (Stns 4, 5, and 24) did not record the         ing in a more uniform apparent distribution. In
same level of detections. These recorders were               contrast, blue whales may be more restricted in
located inside the shelf edge important foraging             terms of potential foraging because of their euphau-
habitat identified by Lesage et al. (2018), which con-       siid-restricted diet (Yochem & Leatherwood 1985).
sists of a narrow (~50 km) strip encompassing the            However, some areas are worth highlighting due to
shelf break of the Scotian Shelf, and the southern           a greater presence of fin whale vocalizations in
and southeastern Grand Banks up to the southern              spring and early summer. Emerald Basin on the
edge of the Flemish Pass. The detection range mod-           Scotian Shelf (Stn 25), the Gully Canyon (Stn 24),
eling results indicate that in the most likely scenar-       and stations associated with the Flemish Pass and
ios, the blue whales producing vocalizations re-             southern Orphan Basin (Stns 15 and 19A/B) main-
corded at Stn 25 were located on the Scotian Shelf           tained relatively high call presence during this
within 40–90 km of that recorder. Stations along the         period. Late spring and early summer detections are
Scotian Slope had restricted detection ranges to-            noteworthy because the quasi-absence of songs and
wards the Scotian Shelf and a larger listening area          decrease in calling rates and in the proportion of
seaward. There appears to be some potential for indi-        20 Hz calls in the vocal repertoire of fin whales
viduals present on the outer continental shelf to have       (Watkins 1981, Stafford et al. 2007, Roy et al. 2018)
gone undetected, even in the best-case scenarios.            generally makes the species more acoustically cryp-
Nevertheless, our results suggest that the Scotian           tic during this season. At most stations, the scarcity
Shelf region may be equally, if not more, important to       or absence of automated 20 Hz call detections and
blue whales than the Scotian Slope. This is further          manual detections of any type of calls in spring and
supported by blue whale habitat suitability models,          summer indicate, at least, a limited acoustic pres-
which indicate potentially highly suitable habitat on        ence of fin whales, but we cannot rule out that a
the central Scotian Shelf as well as the Scotian Slope       greater manual review effort to compensate for
(Moors-Murphy et al. 2019).                                  reduced calling rates would reveal more consistent
   The detections on either end of the Flemish Pass          occurrence. In the Flemish Pass area, the exclusion
(Stns 19B and 17) are noteworthy, particularly in            periods in late spring and summer generally coin-
light of the relatively small detection ranges modeled       cided with the presence of seismic airgun pulses.
for these areas and low automated detector R. Detec-         The lack of TP detections (no manual detections)
tions extended into January to the north and Febru-          may reflect reactions of fin whales to airgun pulses,
ary to the south of the pass. Stns 19A/B and 15 had          as shown in other areas (Castellote et al. 2012).
similar detection periods in both years, even though            The uninterrupted occurrence of 20 Hz calls in
occurrence at Stn 15 is based on manual detections           Emerald Basin and the Gully in summer compared to
only. This suggests that Orphan Basin could have a           other areas could reflect a higher density of fin
similar importance as the Flemish Pass. Blue whales          whales, better call detectability (e.g. closer proximity
were comparatively rare at outer shelf locations on          of vocalizing whales, lower background noise), or
the Grand Banks and southern Labrador Shelf                  other factors causing higher acoustic activity. The
(Stns 18, 14, 20, 11, and 12), despite rather extensive      Gully Canyon has significantly higher cetacean
detection areas. This points to a preference for slope       sighting rates compared to adjacent slope and shelf
habitat in the Newfoundland region, in contrast to           areas, including baleen whales (Moors-Murphy
what is suggested by detections on and off the Scot-         2014), which could result in a greater concentration
ian Shelf.                                                   of fin whales and higher calling rates.
284                                    Endang Species Res 47: 265–289, 2022

  There is uncertainty regarding the winter migra-         Grand Banks and the Laurentian Channel, near
tory patterns of fin whales that feed in eastern Cana-     Stn 6. Both individuals started foraging upon reach-
dian waters in summer. Our results suggest that non-       ing these areas (Kennedy et al. 2014). Whitehead et
negligible numbers of fin whales remain in the study       al. (1982) described the migration of humpback
area in winter. Although the total number of fin           whales in Newfoundland. Whales first arrived on the
whales off eastern Canada is considered healthy, fin       south coast and progressively moved to the northeast
whales in some areas appear to be declining (Schlei-       coast near Bonavista Bay before crossing to the
mer et al. 2019a). Atlantic fin whales in Canada are       southern Labrador coast.
managed as a single population, even though evi-             Our detections suggest that humpback whales
dence indicates some level of population structure         exit the GSL predominantly along the southern
(Mitchell 1974, Delarue et al. 2009). Potential spatial    edge of the strait. The discrepancy in the number of
and demographic isolation should be considered             detections between the eastern Scotian Shelf (Stns 2
when assessing areas that may be important for some        and 22) and stations farther south suggest that the
but not all individuals, especially if they belong to      whales disperse after leaving the former instead of
populations with different abundance trajectories.         following an established migration corridor. How-
                                                           ever, the intensity of detections downstream from
                                                           the eastern Scotian Shelf region was highest in the
               4.3. Humpback whales                        Gully Canyon area, indicating that some whales
                                                           may transit via this area before heading south in
   The Strait of Belle Isle (Stn 10) was the only known    deep oceanic waters (Kowarski et al. 2018). It is
humpback whale aggregation site (Stevick et al.            unclear whether the waves of detections noted at
2006, Comtois et al. 2010) monitored during this study     stations along the slope of the Grand Banks repre-
and was found to be consistently utilized from June,       sent animals summering in Canadian waters, for
when the earliest humpback whale arrivals are typi-        instance off Labrador, or whales migrating from
cally recorded in the northern GSL (Ramp et al. 2015),     feeding areas farther north, particularly off West
until December, when ice starts forming in this area.      Greenland. The differences in acoustic detections at
Detections persisted nearly year-round on the south-       Stns 19A and 19B are noteworthy, suggesting that
ern Grand Banks (Stn 7), suggesting that some indi-        the northern Flemish Pass (and possibly the Flemish
viduals remain in Canadian waters throughout winter,       Cap) may act as a migration transit point. Interest-
as previously observed in other North Atlantic areas       ingly, Stn 17 at the southern end of the Flemish Pass
such as the Gulf of Maine (Davis et al. 2020) and Gully    had very few detections while they peaked at the
Canyon (Kowarski et al. 2018). None of the deep sta-       northern end (Stn 19B).
tions along the continental slope saw sustained peri-
ods of humpback whale acoustic occurrence.
   Among the 3 baleen whales discussed in this                                4.4. Other species
paper, the humpback whale adheres most closely to
the typical model of baleen whale migration pat-              The main summer feeding grounds of North Atlan-
terns. Most stations saw detections constrained to         tic right whales in eastern Canada were historically
well-defined periods which are presumably associ-          located in the Bay of Fundy and in Roseway Basin
ated with the movement of migrating animals. A late        (Davies et al. 2015, 2019). Although individuals were
fall-winter detection wave was apparent at all sta-        also occasionally sighted in the GSL, since 2015 most
tions. A spring wave was generally only visible at         right whale summer observations come from the
stations in the southern half of the study area. These     southern GSL. Despite the limitations of our analysis
fall and spring waves of acoustic occurrence were          protocol for establishing the acoustic occurrence of
investigated in more detail by Kowarski et al. (2019)      this species, our detections suggest, at the very least,
and are consistent with seasonal patterns of detec-        that some individuals wander beyond the main ag-
tions observed in feeding grounds in the Gulf of           gregations site in the southern GSL, both inside and
Maine (Vu et al. 2012). Migratory movements of             outside the GSL.
humpback whales from and to Canadian waters are               Minke whale detections were concentrated in the
poorly documented. Of 22 whales tagged on Carib-           southern half of the study area. However, minke
bean breeding grounds, only 2 returned to Canadian         whales are also abundant off Newfoundland (Law-
waters. They migrated in deep offshore waters until        son & Gosselin 2011), both inshore and offshore. A
reaching the Gully Canyon and the junction of the          lack of pulse trains at high-latitude feeding grounds
You can also read