Advanced Weather Radar Systems in Europe: The COST 75 Action
←
→
Page content transcription
If your browser does not render page correctly, please read the page content below
Advanced Weather Radar Systems
           in Europe: The COST 75 Action
                                        P. Meischner,* C. Collier,+ A. Illingworth,# J. Joss,@ W. Randeu&

  ABSTRACT

           The European Union COST (Cooperation in Science and Technology) action on advanced weather radar systems is
       described. The associated five-year research project, which began in early 1993, has the objective to develop guideline
       specifications for a future generation of European operational radar systems. The authors describe the status of the project,
       the results reached so far in assessing and reviewing the potential improvements to conventional radars, the products and
       application of Doppler radar data, the contribution of polarimetric radars to the improvement of quantitative precipitation
       measurements and for nowcasting, and the possible development of electronically scanned systems. Problems to be tackled
       in the remaining years of the project are assessments of future technological feasibility, market forecasts, and cost/benefit
       investigations for the varied requirement profiles across Europe. It is intended to generate a high-level specification for the
       next generation of weather radars in Europe.

1. Introduction                                                                vanced weather radars, in order to develop a
                                                                               guideline specification for a future generation
  Following the approval of the European Union                                 of operational systems. This is expected to
COST (Cooperation in Science and Technology)                                   enhance the efforts which are being or will be
                                                                               made by states participating in European co-
senior officials, the constituent assembly of the
                                                                               operation in the field of scientific and techni-
management committee for the COST action 75
                                                                               cal research (COST) in developing further their
(COST 75) on advanced weather radar systems was                                weather radar networks. Meetings and some
held in Brussels in January 1993. The resulting                                study costs are funded by the European Com-
memorandum of understanding (MOU) for the                                      mission. Research or development are not be-
implementation of a five-year European research                                ing provided by COST, but need to be covered
project on advanced weather radar systems stated:                              from existing national programmes.

       The main objective of the project is to coordi-                     In early 1993 the MOU was signed by Czecho-
       nate and to advance European research on the                     slovakia, Finland, France, Germany, Hungary,
       assessment of the utility and viability of ad-                   Italy, Slovenia, Spain, Switzerland, the Netherlands,
                                                                        and the United Kingdom. Since then Belgium,
*DLR, Institut für Physik der Atmosphäre, Oberpfaffenhofen,             Croatia, Greece, Poland, Portugal, and Sweden have
Germany.
+
  University of Salford, Telford Research Institute, Salford, United
                                                                        joined. The Czech Republic and Slovakia now rep-
Kingdom.                                                                resent the former Czechoslovakia. Austria has par-
#
  University of Reading, Reading, United Kingdom.                       ticipated as permanent observer from the beginning
@
  Swiss Meteorological Institute, Osservatorio Ticinese, Locarno        and has been a full member since early 1996. The
Monti, Switzerland.                                                     National Institute of Meteorology and Hydrology,
&
  Technical University Graz, Institute of Communications and Wave
                                                                        Bucharest, Romania, has been accepted as perma-
Propagation, Graz, Austria.
In final form 25 February 1997.                                         nent observer since 1995. These European coun-
Corresponding author address: Dr. Peter Meischner, DLR,                 tries operate over 100 weather radars operationally
Oberpfaffenhofen, D82234 Wessling, Germany.                             and about 10 in addition with polarization diver-

Bulletin of the American Meteorological Society                                                                                      1411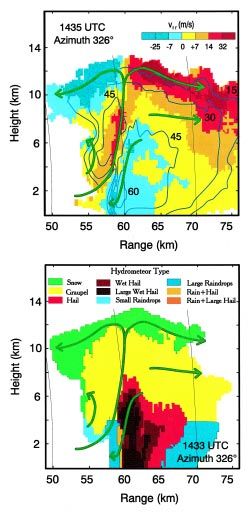
sity for research purposes. Eastern European coun-       seminar is scheduled for March 1998 in Lugano,
tries are just progressing in installing Doppler ra-     Switzerland.
dars. So the main interest and expertise contribut-
ing to COST 75 comes from networks of single
polarization Doppler (in some cases) radars oper-        2. Improvements of current weather
ated by the national weather services. Research             radar systems
institutions as well as industry involved in radar
system developments have been invited to discuss            This topic has been mainly discussed during
applications of advanced methods and technolo-           committee meetings and workshops held through-
gies in an operational environment and to assess         out the project, in the sense of advanced data pro-
technological projections into the next century.         cessing rather than in the sense of advancing tech-
   An area of uncertainty remains: the develop-          niques such as Doppler, multiparameter, or elec-
ment of future requirements. Already visible is the      tronic scanning systems to be covered by the other
effort to develop further weather nowcasting tech-       working groups and discussed later in this paper.
niques for a broad field of local users. Weather         Hardware options, such as dual Pulse Repetition
radars, if they can be operated in flexible and adap-    Frequency (PRF), dual frequency, and FM–CW
tive modes, can contribute to this field of economic     systems, however, were included.
interest. Further discussions need to clarify how           In the near future, most European users will have
more advanced radars may contribute to the tailor-       to work with existing radar systems, which are of-
ing of more specified products and how to distrib-       ten far from being used to the limits of their poten-
ute these in the growing multimedia world.               tial. Therefore, the potential for development of
   In order to cover the broad field of envisaged        methods used with existing systems and an indi-
research, four working groups were established.          cation for further improvements will be assessed
                                                         in this section. An overview of European opera-
• Working Group 1: Advanced data processing              tional weather radar systems (Joss 1995) is given
  with conventional and future radars, chaired by        in Table 1.
  J. Joss, Switzerland.
• Working Group 2: Doppler radars, chaired by            a. Calibration for the radar hardware
  C. Collier, United Kingdom.                               Much effort has been dedicated to discussing the
• Working Group 3: Multiparameter radars,                importance of the calibration of the current radar
  chaired by A. Illingworth, United Kingdom.             systems to hydrological applications. The precision
• Working Group 4: Electronically scanned sys-           required for quantitative radar measurements, such
  tems, chaired by W. Randeu, Austria.                   as needed to issue flood warnings, is far more de-
                                                         manding than for a qualitative use of radar, for
   Here, we outline the status of the project to date,   example, for just following and extrapolating ech-
the main results achieved so far, and the problems       oes in time and space. The concept of calibration,
to be tackled in the remaining years. The paper is       clutter elimination, profile correction, and adjust-
structured according to the working groups, al-          ment with rain gauges, therefore, receives much
though it is the aim of the project to integrate the     attention. The basis of calibration, the requirements,
findings of the working groups.                          and the results obtained in Germany and Switzer-
   Important events were the COST 75 International       land are described in some detail by Joss et al.
Seminar on Advanced Weather Radar Systems,               (1996). Excellent stability of system parameters
held 20–23 September 1994 in Brussels, which in-         during normal operation was found to be well
cluded more than 80 contributions from outside of        within 0.2 dBZ (3% of rain rate). This result fulfills
Europe as well (Collier 1995). A COST 75 Work-           the needs for estimates of rain amount and flood
shop on Improved Rainfall Estimates using                warning but unfortunately only concerns instru-
Polarisation Diversity Radar was held 3–4 July           mental aspects. It means that, for a well-maintained
1995 at the University of Reading, United King-          radar, errors caused by the equipment can be ne-
dom, and a Workshop on Doppler Weather Radar             glected compared with variations related to weather
on 22–23 October 1996 at Villa Chiozza,                  processes [that is, the vertical profile, inhomoge-
Cervignano del Friuli, Italy. The final international    neous beam-filling, Z–R (reflectivity–rain rate) re-

1412                                                                                  Vol. 78, No. 7, July 1997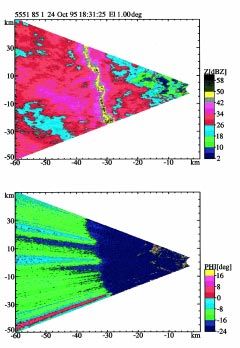
TABLE 1. Some parameters and scan strategies of the operational radars used in COST countries. The letters in the last column indicate
the method used for removing clutter in each country (M—clutter map; D—Doppler measurements; S—signal statistics; P—polarization;
R—resolution; I—interpolation), as explained in more detail in the text.

                                                          Number
                                                       of elevations/
 Country         No. of             Frequency           repet. time             RPM                    PRF                 Clutter
                 radars               bands                (min)               (min− 1)                (s − 1 )        discrimination

 Austria            4                    C                21/10;5                4, 5                  600               M,D,S,R,I

 Croatia            1                    S                 14/10                 2–3                   600                    M

 Czech
 Republic           2                 X,S,C             13;20/10;10                3                 250; 556               M,D,I

 Denmark            2                    C                 10/10                 2–6                250–1200                 M,S

 Finland            6                  X,C                  11/15                2–6                250–1200                 M,D

 France            13                   C,S                  3/3                 0.84                250–330                 S,I

 Germany           10                    C                 19/15                   3                600–1200                M,D,I

 Greece             4                   C,S                 4/10                   3                   250                    —

 Hungary            3                  X,S                   4/5                   3                   250                    —

 Ireland            2                    C                 10/15                 2–6                250–1200                  —

 Italy             14                  X,C                 10/15                 2–6                300–1200               M,D,P,I

 Netherlands        2                    C                  4/10                   3                   250                    S

 Norway             1                    C                 12/10                   6                250–1200                 M,D

 Poland             2                  C,X                 14/10                   6                   250                   M,D

 Portugal           1                    C                 13/15                   3                    250                 M,S,I

 Romania            3                  X,S                 10/25                 1–6                   250                    M

 Slovakia           2                  X,S                15/15;30                 6                   250                    M

 Slovenia           2                    C                 16/7.5                  3                250–1200                  M

 Spain             12                  C,S                 20/10                 2–6                250–1200                 M,D

 Sweden            11                    C              10–15/15,5               2–6                250–1200                M,D

 Switzerland        3                    C                  20/5                 3–6                600–1200             M,D,S,R,I

 United
 Kingdom           12                    C                   4/5                 1–3                300–1200                  —

Bulletin of the American Meteorological Society                                                                                     1413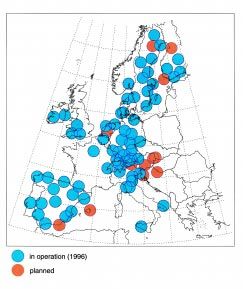
lationship, attenuation, etc.]. Furthermore, it is con- errors in estimating precipitation. There, we can
cluded that considerable redundancy is needed significantly improve measurements by applying
when determining relevant parameters for auto- corrections based on the vertical profile of
matic fault monitoring and remote diagnosis to al- reflectivity and estimating the degree of beam
low system deficiencies to be identified at an early blockage (Harrold et al. 1974; Joss and Lee 1995).
stage. This is a very important feature for un- For best results with such a correction, we need the
manned, automated equipment intended to issue full volume information. This, however, needs
flood warnings. more measurement time. An electronically scanned
antenna would ease such a task significantly, but
b. Adjustment of radar data using independent even with today’s mechanical scanned radars,
data, for example, rain gauges when using the flexibility of existing hardware, for
Agreement exists among participating countries example, by optimizing the rotation rate and pulse
that we should use rain gauges for adjustment, but repetition frequency, we may improve the quality
adjustment should be carried out only after having of radar data and obtain fast update rates. First steps
verified the accuracy and the stability of the radar are already reflected in the scan procedures adopted
hardware with microwave test equipment and af- in different countries.
ter having corrected for the other errors mentioned An overview of the strategies for scanning the
in the previous paragraph. When are adjustments volume as used in 15 countries is documented in
reasonable? Are adjustments in real time helpful? Joss (1995). Table 1 contains the principal charac-
The integration time required for optimum adjust- teristics of radars in existing networks of COST
ment depends upon the application. We should countries. In Europe X to S band is applied because,
modify the data only if the standard error of esti- for quantitative work including snow and rain, a
mate (representativity) of the gauges is smaller than compromise is needed between errors arising from
the bias caused by other errors (Smith et al. 1990). attenuation and non-Raleigh scattering at shorter
However, the high variability of precipitation in wavelength. These errors are caused at longer
time and space strongly reduces the representativity wavelength by reduced beam resolution at farther
of rain gauges. Hence, much effort continues to be ranges and increased ground clutter at all ranges
dedicated to finding the optimum way of using where the beam, or its sidelobes, may hit the ground
ground truth for adjustment. in normal as well as anomalous propagation situa-
Different adjustment strategies are applied in tions. The chosen parameters reflect the compro-
different European countries. The United Kingdom mise in each country (e.g., in Finland, where snow
uses real-time adjustments and Switzerland is pre- measurements with high spatial resolution are de-
paring to do so. Off-line adjustments are used in sired, C- or even X-band radars have a better cost/
Germany and Switzerland, and Spain is planning benefit ratio than S-band radars). In Spain, where
to follow soon. Experience of comparing data from severe thunderstorms containing hail are of most
radar, gauges, and river flow in Switzerland dur- importance, the “best compromise” is shifted to-
ing the past seven years is described in Joss et al. ward longer wavelength. This compromise needs
(1995). The results show agreement between careful analysis involving the dominant rain rate
monthly amounts estimated by different instru- of interest, the average distance of storms from the
ments but on occasion show significant differences radar, and the price of the radar. Table 1 reflects
caused by beam blockage and beam broadening. the pulse repetition frequency, the speed of antenna
rotation, number of elevations, and resulting rep-
c. Radar scanning procedures etition time for the complete (volume) scan. These
In the past, judging by the results obtained at parameters reflect the compromises needed be-
close ranges where problems caused by limited tween speed of update, detail of result, and its sta-
radar horizon can be neglected and with limited tistical error.
computing power, we were tempted to use uncor-
rected data from the lowest antenna elevation only d. Elimination of clutter and anomalous
to estimate precipitation at ground level. At longer propagation effects
ranges, however, the beam broadens, and the cur- A fundamental requirement for quantitative pre-
vature of the earth and the horizon cause dominant cipitation measurements is the quantitative removal
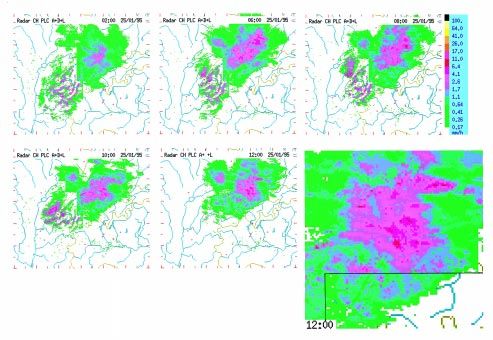
1414 Vol. 78, No. 7, July 1997FIG. 1. The composites of the three Swiss radars show the best estimate of rain rate in mm h−1 at the ground. Two of the radars, Albis
(northeast) and Lema (southeast), are of the Dopplerized third generation, whereas the southwestern system (La Dôle) is of the non-
Dopplerized second generation. The new systems provide extrapolations to the ground level by using profile corrections. They further
apply five algorithms for clutter suppression to every pixel of 1° × 1° × 83 m, as described in the text, whereas the older radar uses just
a clutter map. In the 12:00 plane, lower middle, only results from the new radars are shown. This clearly demonstrates improvements
compared to the spotty information from the older southwestern radar. The enlarged figure, lower right, shows residual differences
between the two new radars. They can be distinguished at a line west to east, approximately one-third of image extent from south.
of ground clutter without losing any signal from the 4) Resolution. Advantage to recognize and remove
precipitation. None of the numerous methods already clutter is taken from the characteristics of clut-
known and applied work to full satisfaction. The ter to appear in spots, leaving valid information
most promising strategy is to apply a combination. in between. Its retrieval (interpolation) is eased
An overview on the ground clutter removal al- if using short pulse length and sampling gates.
gorithms used in 10 countries so far is documented 5) Interpolation. After clutter has been eliminated,
in Joss (1995). They can be divided into six groups. the blind zones have to be filled using vertically
or horizontally adjacent information.
1) Map. A clutter map, provided and updated on 6) Polarization. Recognizes clutter by the distinct
clear day measurements marks and eliminates polarization signatures of various polarimetric
all pixels judged to contain clutter. parameters.
2) Doppler. On the basis of using the radial veloc-
ity, data having “nonzero velocity” using Fou- The first five methods are being tested in Switzer-
rier transform and other filter cancelers is clas- land for the new, third generation of radars. The
sified as precipitation. first experience is promising (Lee et al. 1995).
3) Statistical. Elimination of clutter signals on the Figure 1 illustrates the improvements obtained
bases of noncoherent signal statistics in time and with the new clutter suppression as compared to the
space. old way of just using a clutter map. Data from the
Bulletin of the American Meteorological Society 1415two newly installed Swiss radars, Lema (southeast Similar methods are applied in different coun-
1625 m above sea level) and Albis (northeast 928 tries. Finland (Koistinen 1986), Slovenia (Divjak
m), both Doppler C-band radars using a 1° beam, and Rakovec 1995), and Switzerland (Joss and Lee
are composited with the third older Swiss radar, La 1995) use measurements aloft for obtaining a bet-
Dôle (southwest 1680 m). Data from the old radar ter estimate of the precipitation reaching the
show far more “holes” in the echo, leftover from ground. Profile corrections are probably the most
the old strategy of clutter suppression alone. Dif- efficient, easiest, and cheapest way to obtain bet-
ferences in displayed rain rate between the two new ter results. Climatological “average profiles,” to-
radars in the east are also noticeable in the 1200 gether with a rough guess of the visibility height,
UTC zoom image at the west–east borderline be- give significant improvement (Joss and Waldvogel
tween the two composite parts. This reflects prob- 1990).
lems of compositing information from several ra- We conclude that, at long ranges of more than
dars. In this case, the two radars are of exactly the 100 km, an important reduction of intensity may
same type and the common ability to measure be caused by earth curvature and incomplete beam
reflectivity is much better than the observed differ- filling. At short ranges, the bright band can lead to
ence (Della Bruna et al. 1995). At the borderline considerable overestimates. Therefore, quantitative
the step amounts to about 3 dB of reflectivity estimates of precipitation may significantly be im-
equivalent to 60% of rain rate. It demonstrates that proved if corrections including our understanding
the correction procedure and the compositing al- of the precipitation evolution and the knowledge
gorithm still need perfecting: to avoid overcorrec- of what the radar really can measure are used. For
tion, the error caused by differences of visibility example, corrections are needed for reduced vis-
height between the northern and the southern ra- ibility because of earth curvature, beam broaden-
dar are not fully compensated. At the borderline the ing, and orographic beam blockage in combination
northern radar sees echos already above 2.5-km with variations of reflectivity with height (vertical
altitude, whereas the southern radar there sees only profile).
echos above 4.5-km altitude. This results in the 3
dB more reflectivity seen by the northern radar. f. Attenuation
The quantification of attenuation effects, particu-
e. Approaches for improving precipitation lar for C-band radars, caused by heavy precipita-
estimates tion as well as by the radomes is a topic of central
At short ranges, where the beam is small, the interest in Europe where most radars operate at this
bright band can cause important overestimation of frequency. This problem is particularly important
surface precipitation. Several authors have de- in severe storm situations. No reliable solution is
scribed methods of reducing these errors, for ex- available at present, although, as we shall see, po-
ample, Smith (1986). At longer ranges, however, larization diversity may offer a solution.
significant and increasing underestimation of pre-
cipitation is observed. The percentage of precipi-
tation seen by a radar (as compared to gauges) re- 3. Doppler weather radars
lates closely to the visibility of precipitation above
the ground, which is influenced by earth curvature, Over the last few years, radar manufactures have
terrain beam blocking, and beam broadening at increasingly offered Doppler weather radars as a
longer ranges. Indeed, with increasing distance, the standard product. Indeed, manufacturers generally
earth curvature and beam broadening become the regard a non-Doppler radar as an uneconomic
dominant sources of error (Kitchen and Jackson proposition to produce, although they do offer to
1993). Note that the visibility height of the radar is upgrade a non-Doppler radar to Doppler operation.
defined by the height to which an echo must reach It is clear that Doppler radars are rapidly becom-
to be seen. Joss and Lee (1995) propose ways to ing the operational standard, although some coun-
significantly improve clutter suppression and rain tries in Europe utilize Doppler data much more than
measurements by applying corrections based on others for operational weather forecasting. For ex-
the vertical profile of reflectivity and the visibility ample, Sweden and Finland provide Doppler wind
by the radar for each pixel. information routinely to forecasters, whereas in
1416 Vol. 78, No. 7, July 1997France such information is not available for weather
forecasting. Other countries are presently consid-
ering how best to use Doppler products operation-
ally.
With this background, COST 75 established a
working group with the specific tasks of identify-
ing the requirements for Doppler data and how
these data are, and can be, used to address specific
problems. The aim is to clarify where there are gaps
in our knowledge of Doppler radar and to develop
a review program into operational Doppler radar
leading to an outline specification of the next gen-
eration of systems for Europe.
Membership of the working group includes rep-
resentatives of Austria, Finland, France, Germany,
Italy, Sweden, and the United Kingdom, although
all participants in the action COST 75 have pro-
vided valuable information and comments on the
material produced by the working group. In this
section, some of the information collated so far is
discussed.
FIG. 2. Doppler weather radars in Europe used for operational
a. Distribution and type of Doppler radars in services and for research. The circles indicate a radius of 100 km,
Europe which is the typical quantitative range to which radars in Europe are
Figure 2 shows the current deployment of Dop- used to make measurements of precipitation. Often Doppler
measurements are used up to 120 km, whereas reflectivity
pler radars in Europe. While some countries have measurements are evaluated up to 230 km.
extensive networks, for example, Spain and Swe-
den, other countries have none, for example,
France (excluding research radars). This situation
reflects the continuing uncertainty of some coun- • ground clutter rejection including anomalous
tries of the benefits of Doppler radar to operational propagation echo suppression;
meteorology while recognizing the obvious re- • low-level winds for deriving wind shear and di-
search benefits. Nevertheless, there has been a vergence for aviation forecasting;
rapid growth in the use of Doppler radars of the last • wind data for numerical weather prediction
12 years or so. In 1982 there was only one such (NWP) data assimilation; and
radar in Europe. Doppler radars in Europe are gen- • nowcasting gust fronts, mesocyclones, and thun-
erally low power, about 30% of the power of the derstorms.
U.S. WSR-88D/NEXRAD radars. Both magnetron-
(Enterprise Electronics Corporation, Gematronik, The priority of the individual requirements var-
Ericsson, Siemens Plessey) and klystron- ies from northern to southern Europe related to the
(Segnalamento Marittimo ed Aereo) based systems frequency of occurrence of severe storms and sig-
are deployed. The magnetron systems use stabi- nificance of snow and icing problems. In very gen-
lized power supplies and phase-locking technolo- eral terms, the emphasis in northern Europe is on
gies to achieve the level of coherence necessary for using Doppler radar for ground clutter rejection and
most aspects of Doppler operation. There are no wind profiling by the velocity azimuth display tech-
WSR-88D-type systems in Europe. nique (VAD); see below. Research into the use of
both VAD and radial winds within the data simu-
b. Requirements for Doppler radar data in lation procedures of NWP models is being under-
Europe taken in several countries, notably Sweden and the
The main requirements for Doppler radars in United Kingdom. In southern Europe, severe
Europe have been identified as storms occur more frequently than in northern
Bulletin of the American Meteorological Society 1417Europe, and the use of Doppler radar data for radar have only been used operationally in a few
nowcasting these events, and associated phenom- locations in Europe. However, currently this is a
ena such as tornadoes and downbursts, is an im- very active area of research in the United States and
portant requirement. Such a requirement is being in Europe. There is a need for performance verifi-
considered further in connection with the need for cation studies, as removing echoes having zero
electronic scanning radar antennas since algorithms speed can effect the echo pattern very much. Spec-
developed to detect these phenomena require the tral broadening of echoes may lead to the retention
rapid acquisition of four-dimensional data. of some clutter and/or the removal of some rain.
There remains uncertainty in Europe as to how This problem may be addressed by using the Dop-
to use Doppler radar data effectively within an pler spectrum and employing a range of clutter fil-
operational, as opposed to research, environment. ters. However, it is already clear that Doppler tech-
In the United States, the introduction of the WSR- niques alone are not sufficient (Joss and Lee 1995).
88D radar has led to significant improvements in
the accuracy of storm warnings. It has increased e. Clear air detection capability
the lead time for tornado warnings from between The detection of clear air phenomena, while be-
zero and 4 min to as much as 20 min and in a few ing much studied in the United States, has been
cases more than 20 min (Polger et al. 1994). How- largely ignored in Europe. There is an increasing
ever, the large number of products (Klazura and recognition that important forecast information
Imy 1993) has been developed for selection by a could be obtained from such observations, as dis-
human forecaster experienced in mesoscale meteo- cussed next.
rology. The methods of using Doppler radar data There remains doubt as to what the clear air scat-
developed in the United States have not, in gen- tering mechanisms are in Europe. In northern Eu-
eral, been exploited in Europe. In particular, tech- ropean countries in summer, clear air echoes are
niques of improved severe storm warning are not detected to 50–60-km range and 1–2-km altitude,
being used extensively as these events are less fre- whereas in winter such echoes are rarely seen. It is
quent over much of Europe. However, work is felt that humidity gradients as well as insects must
under way to develop methods of using Doppler be responsible for these echoes. In Spain, clear air
data operationally. There is a need to develop prod- echoes are detected to 100 km range with C-band
ucts specified to user needs, which can be absorbed radar. These echoes are mostly due to insects.
operationally by nonspecialists or by using totally Achtemeier (1991) discussed in some detail radar
automated procedures. observations of insects in flight. More recently,
Wilson et al. (1994) discussed the origin of clear
c. Basic understanding of Doppler air echoes associating them with both particulate
measurements (birds and insects) and Bragg scattering (refractive
There are a number of areas that need to be clari- index inhomogeneities).
fied before the specification of the next generation Further studies under the aegis of COST 75 are
of radars in Europe can be finalized. For example, planned. It is clearly important to ascertain the
what is called spectral width is subject to uncertain- likely frequency of occurrence of clear air echoes
ties depending upon how it is measured and what across Europe in order that the next generation of
Nyquist interval and signal to noise ratio are present radars may be specified with the correct sensitiv-
in the system (Keeler and Passarelli 1990; Doviak ity if clear air detection is an important requirement.
and Zrnic 1984). Work has been instigated within
COST 75 to investigate this further. Range folding f. Radial and vertical profile winds
and velocity aliasing are problems that need to be Doppler radars are capable of providing both
dealt with to ensure that Doppler data are presented radial and vertical profiles of horizontal wind. Ver-
to users in an easy to assimilate way. The basis of the tical wind profiles are derived using a number of
techniques to deal with these problems are now un- different methods: VAD, volume velocity process-
derstood (e.g., Doviak and Zrnic 1984; Collier 1996). ing (VVP), and uniform wind. These techniques
assume approximate linearity of the wind field and
d. Clutter suppression therefore are not generally applicable to convec-
The clutter suppression capabilities of Doppler tive storm internal circulations. For more stratiform
1418 Vol. 78, No. 7, July 1997FIG. 3. Time–height cross section of VVP wind soundings FIG. 4. Horizontal wind field at the constant altitude plan position derived from the Finnish Doppler radar at Kuopio at 0100–0800 indicator (CAPPI) height of 1 km, derived by VVP processing in UTC 27 May 1996. The color background exhibits the radar derived 30 km long and 30° wide volume segments, and then interpolated distribution of divergence 10−4 s−1. Crosses indicate points where to a grid of 10 km × 10 km resolution at the Kuopio Doppler radar the signal is either too weak or does not pass the quality thresholds at 0107 UTC 27 May 1996. The color background exhibits the as, for example, signal coherency. The case is related to a passage slightly smoothed dBZ field at the CAPPI height of 1 km. of deepening frontal wave followed by cold air advection. situations, however, these methods show consis- of measurements are comparable with the differ- tent results as demonstrated by the Finnish radar ences obtained from radiosonde ascents made some network, in Figs. 3 and 4 (see also Scialom and Testud 20 km apart (Kitchen 1989). 1986; Andersson 1995). The subjective three-year The assimilation of Doppler wind information experience in Finland of meteorologists using VVP with either radial wind components or VAD pro- winds together with soundings from a high-reso- files is also expected to be relatively straightfor- lution limited area numerical model at the radar sites ward. The U.S. pilot studies (e.g., Lilly 1990) have suggests that VVP winds are accurate and reliable indicated the exciting possibilities of using Dop- for purposes of the operational weather service. pler wind information in this way. However, to en- There remains the requirement to convince us- sure reliability and consistency it may be necessary ers that VAD winds may be taken as actual mea- to use methodologies both adjoint and variational surements of wind. Work is under way in several methodologies similar to that described by Qui and European countries to develop ways of incorporat- Xu (1994) and Laroche and Zawadzki (1994). ing Doppler winds (both VAD and radial winds) into the data assimilation procedures of mesoscale g. New Doppler radar products NWP models. Crum and Alberty (1993) describe the flow of The accuracy of VAD winds is now being in- WSR-88D base data from the radar data acquisi- vestigated operationally in several European coun- tion to display as products for the radar forecaster. tries. In Sweden, the Swedish Meteorological and Similar types of products have been developed Hydrological Institute carries out wind profile mea- from Terminal Doppler Weather Radar (TDWR) surements routinely every 3 h. These measure- data. Hermes et al. (1993) describe in detail the ments have a resolution of 30 m up to an altitude gust-front detection and wind shift algorithms for of 500 m and a resolution of 100 m thereafter. the TDWR. Reviewing the characteristic features Assessment of the temporal continuity of these of the Doppler methods used in NEXRAD (WSR- measurements has been carried out showing excel- 88D) and TDWR, it appears, at first sight, that there lent consistency. Comparisons of Doppler wind is little scope to develop further products. profiles above the radar site were made with wind However, products not included in the WSR- profiles from radiosonde data within some minutes, 88D system that could be of importance in Europe showing that the differences between the two sets include the following: Bulletin of the American Meteorological Society 1419
• probability of icing by detection of shear zones      ever, it is perhaps more likely that Doppler winds
  and embedded convection (Pobanz et al. 1994);         will be assimilated into numerical models if the
• indication of the stage of development of par-        difficulties alluded to in section 3f can be overcome.
  ticular weather types, possibly derived from
  measurements of spectral width (Hardaker and
  Collier 1995) from which may be derived the           4. Multiparameter radars
  eddy dissipation rate (Cohn 1995);
• thermodynamic parameters derived with the aid            Most operational weather radars transmit at a
  of microphysical models (Hauser et al. 1988); and     single frequency and polarization and measure the
• anomalous propagation identified from eddy-           intensity and the Doppler shift of the return power.
  dissipation-derived measurements of C n2              A COST 75 working group is concerned with the
  (Wesely 1976; Brewster and Zrnic 1986).               additional information available from multiparam-
                                                        eter radars that exploit either the polarization prop-
h. Scan strategies and networking                       erties of the radar returns or compare the return
   While some European countries use only Dop-          power at several different frequencies. We are for-
pler radars, other countries have a mixture of Dop-     tunate in Europe to have several powerful multi-
pler and non-Doppler systems. Volumetric prod-          parameter radars that are currently used for re-
ucts, usually derived from reflectivity, are regarded   search. It is useful to consider whether such tech-
to be of equal or greater importance than Doppler       niques are appropriate for incorporation within
wind products. In addition, most countries wish to      future operational radar networks.
produce network composite images, so individual            Two particular themes where multiparameter
radars cannot be operated without regard to other       radars could have the most benefit in an opera-
systems. One option implemented in the United           tional environment are
Kingdom and elsewhere is to gather volume prod-
ucts in non-Doppler mode for (say) 10 min in ev-        • improved quantitative estimates of rainfall rates
ery 15-min period, allowing Doppler operation in          at the ground, and
the remaining 5 min. An alternative approach has        • identification of severe weather hazards, con-
been implemented in Switzerland in which both             nected, for example, with hail.
reflectivity and Doppler data are collected continu-
ously for 20 elevations on a 5-min cycle time (Joss        Many published research papers indicate how
and Lee 1995).                                          multiparameter techniques can contribute to these
   However, in rapidly changing convective situa-       two topics, but it must still be demonstrated that they
tions, Doppler data every 10–15 min, as collected       can produce a positive and economic impact in an
in the United Kingdom and elsewhere, is too in-         operational environment.
frequent. The WSR-88D employs one of four vol-             This work so far culminated in a 2-day open
ume scan strategies that require 5–10 min to com-       workshop that was held in Reading, United King-
plete with Doppler wind information being inter-        dom, on 3–4 July 1995. One aim was to identify
leaved with reflectivity data. These include clear      areas where advanced polarization diversity radar
air strategies (five elevations every 10 min, 0.5°–     could provide improved rainfall rates. Results from
4.5°) and a precipitation severe weather strategy       polarization diversity radars in Austria, Italy, Ger-
(14 elevations every 5 min, 0.5°–19.5°). The domi-      many, and the United Kingdom were presented;
nant user requirement will decide what strategy to      such radars compare the radar returns using verti-
employ in different parts of Europe. The interna-       cally and horizontally polarized transmitted radia-
tional exchange of wide-area reflectivity data will     tion. Observations from dual frequency radars in
also be an important consideration. Since Doppler       eastern Europe were also presented and discussed
radar network densities in parts of Europe are          (e.g., Brylev et al. 1995).
sparse, they are unlikely to provide all the required
wind measurements. The possible use of comple-          a. Polarization techniques
mentary data supplied from bistatic multiple-Dop-          The number of additional independent param-
pler radar networks (Wurman et al. 1993) is being       eters available from polarization diversity radars can
investigated by some countries in Europe. How-          appear bewildering. We shall initially consider lin-

1420                                                                                  Vol. 78, No. 7, July 1997
ear polarization, as this is used by most radars in estimate of rain rate as its response is usually con- Europe. A parallel set of variables exists for circu- trolled by raindrops; most hailstones tumble as they lar polarization and observations made using one fall and therefore usually do not contribute substan- polarization basis can, in theory, be converted to tially to KDP. the other. The circular depolarisation (CDR) is the ratio of Radar transmitting pulses that are alternately the cross-polar to copolar return for circular trans- horizontally and vertically polarized can measure mitted radiation. The highest values of CDR are ZH and ZV , the reflectivities for the two polarizations, associated with particles that are wet and oblate and, with the addition of a cross-polar receiver, the irrespectively of fall mode. Heavy rain and wet hail orthogonal reflectivity ZVH can be recorded. If the show increased values. radar is Dopplerized, then the difference in the It is also possible to define various correlation phases of the returns in the two polarizations (φDP parameters between the time series of the fluctuat- = φV−φH) can be estimated. ing radar reflectivity estimates. This is an area of The application of the three major parameters active research, and it seems premature to recom- besides Z as defined for a polarisation diversity mend its implementation in an operational environ- radar are summarized briefly below. ment. The differential reflectivity ZDR = 10 log (ZH /ZV) senses the mean shape of the hydrometeors. Rain- b. Recommendations for applications and further drops are oblate to a degree that depends upon their research size, so ZDR is a measure of mean raindrop size, and 1) IMPROVED ESTIMATE OF RAINFALL FROM a combination of Z and ZDR provides an estimate POLARIZATION RADAR of the actual drop-size distribution that will, on It is well known that rain-rate validation on an average, yield a more accurate rainfall rate than event basis by gauges is difficult because of the from Z alone. Interpretation of ZDR for ice is more poor spatial representativity of gauges (e.g., difficult. Tiny ice particles as needles or plates fall- Gorgucci et al. 1995) and the different measure- ing horizontally oriented give high values. Hail- ment conditions for radar and gauges (see section stones tumble as they fall and so should be associ- 2). With this in mind, and given that C-band fre- ated with zero ZDR. quencies are mainly used operationally in Europe, The linear depolarization ratio LDR = 10 we try to check whether, and which, multiparam- log(ZVH/ZHH) is a measure of the shape, the refrac- eter methods work reliably at C-band frequencies. tive index, and the fall mode of the precipitation At S-band frequencies, improvement at short particles. The highest cross-polar returns are asso- range by improved characterization of drop-size ciated with particles that are both wet and oblate distribution (DSD) using ZDR has already been dem- and tumble as they fall. LDR is an excellent detec- onstrated (Goddard and Cherry 1984). tor of wet ice. In convective clouds LDR can lo- Theory shows that for C-band frequencies, ZDR cate regions of small hail particles that are wet, and values are needed at an accuracy of 0.1–0.2 dB, in stratiform systems LDR can identify melting which implies that stable correction algorithms for snow that causes the enhanced reflectivity known propagation effects at C-band frequencies need to as the bright band. Clutter is also associated with be further developed and demonstrated (Aydin et high LDR. al. 1989; Bringi et al. 1990; Chandra et al. 1994). The specific differential propagation phase shift The potential for improved rainfall via better DSD KDP, the rate of change of φDP with range, is a for- estimates in heavier rain at short ranges needs to ward propagation effect. As the radar wave ad- be studied in detail as well as correction schemes vances through a region containing oblate rain- for a hail–rain mixture. drops, its velocity for horizontal polarization falls It has frequently been demonstrated that LDR is below that for vertical polarization, and so the phase very useful for identifying the bright band of en- difference φ DP between the two polarizations in- hanced reflectivity associated with melting snow, creases with range. In theory, KDP is more closely which may cause overestimation of rainfall rate related to the rainfall rate than Z. In severe thun- (Illingworth and Caylor 1989). Different hydrom- derstorms, the value of Z is dominated by the re- eteors can be identified more definitely by use of turns from the hail. The KDP may provide a better LDR (e.g., Höller et al. 1994; Hagen et al. 1995). Bulletin of the American Meteorological Society 1421
The specific differential propagation phase shift
                                                                          KDP promises to improve rain-rate estimates, espe-
                                                                          cially for heavy rain and if hail is present
                                                                          (Balakrishnan and Zrnic 1990). The beam must be
                                                                          in the rain, which is a problem at long ranges when
                                                                          the 0°C level is close to the surface (Blackman and
                                                                          Illingworth 1995; Goddard et al. 1994). Unlike ZDR
                                                                          and LDR, there are no attenuation problems at C-
                                                                          band frequencies. Further investigations are ongo-
                                                                          ing and are planned to demonstrate the accuracy,
                                                                          quality, and interpretability of KDP in dependance
                                                                          of rain rate, dwell time, and Mie scattering effects.
                                                                          A clear example is shown in Fig. 5, where there is
                                                                          an increase of the differential phase between hori-
                                                                          zontal and vertical returns by up to 30° by a nar-
                                                                          row intense rainband as measured by the Chilbolton
                                                                          (United Kingdom) research radar.
                                                                              At C-band frequencies, the use of ZDR to improve
                                                                          rain-rate estimations by estimating drop sizes can
                                                                          be affected by differential attenuation that biases
                                                                          ZDR negatively with increasing range. This negative
                                                                          bias, however, may itself provide a means of esti-
                                                                          mating the attenuation of Z.
                                                                              The recognition of attenuation itself can be im-
                                                                          proved by depolarization measurements, either of
                                                                          LDR or the circular depolarization ratio CDR if
    FIG. 5. Plots of reflectivity (Z) and differential phase (PHI) from   circular polarized radiation is feasible.
a low-level scan (1° elevation) through a narrow rainband of a cold
front 30 km to the west of the Chilbolton radar, United Kingdom.
In the rainband, Z values exceed 50 dBZ and the differential phase
                                                                             2) QUANTITATIVE MEASUREMENTS OF SNOW
between horizontal and vertical returns increased in the mean by             The use of polarization for better estimates of
about 12°. Measurements of increased differential phase of up to          precipitating snow has received little attention and
30° are caused by increased rain intensities through longer path          is an open question. Forecasting and nowcasting
lengths across the rainband. A gauge recorded rainfall rates of over      snow on the ground is an objective particularly at
150 mm h−1 as the rainband passed by. This demonstrates the
                                                                          higher grounds and in northern Europe. Polariza-
potential of the differential propagation phase for quantitative rain-
rate estimations.                                                         tion methods can measure the height of the bright
                                                                          band (freezing level) very accurately, but the reso-
                                                                          lution will degrade with distance as the beamwidth
                                                                          increases. This so-far neglected topic should be
Further verifications should stabilize these algo-                        addressed in the future.
rithms and improve the quantification of the dif-
ferent hydrometeor contents in the dynamical frame                           3) HAIL AND SEVERE WEATHER DETECTION
of a cloud system in order to intercompare devel-                            The research on deep convective systems by
opments with cloud models (Höller 1995).                                  combined use of polarimetric and Doppler radar
   Such quantitative measurements call for correc-                        measurements during the last 10 years or so has sig-
tion procedures to eliminate propagation effects, espe-                   nificantly increased our knowledge of the precipi-
cially at C-band frequencies. Applications, then, are                     tation forming process coupled with the dynamics
contributions to estimate rain profiles (including the                    of these storms (Höller et al. 1994; Meischner et
bright band) more accurately and to estimate the                          al. 1991). In southern Germany some 200 thunder-
use for numerical weather prediction models. For                          storm systems were investigated over a period of
future operational applications, the cost/benefit of                      6 yr and were documented, covering significant
adding LDR techniques needs to be quantified.                             times of their life cycle. The results of these 6 yr

1422                                                                                                   Vol. 78, No. 7, July 1997
were observed to be organized at line structures.
The damage potential increases with the degree of
organization. The observed hail categories signifi-
cantly increase from single-cell-type storms via
multicells and squall lines to supercell storms
(Höller 1994).
Figure 6 shows the microphysical structure em-
bedded within the dynamical structure of a single-
cell thunderstorm as a vertical section (RHI) ob-
served with the polarimetric Doppler radar of the
German Aerospace Research Establishment (DLR)
in Oberpfaffenhofen, Germany. The simultaneous
use and display of combined polarimetric and
Doppler measurements contribute to storm type
and life stage recognition, supplying improvements
in nowcasting capability.
The knowledge of the relation between storm
type and possible hazards as hail, heavy rain, light-
ning, and gusts and their appearance relative to
storm structure, storm dynamics, and state of life
cycle clearly is an important potential for forecast-
ing and nowcasting these events. It needs to be
further condensed to conceptual models, and its
superiority to complementary methods such as
reflectivity observation, satellite observations,
lightning observations, and numerical weather pre-
diction modeling needs to be further investigated
and demonstrated. This task, at least in its complete-
ness, is beyond the scope of COST 75, but this
knowledge will contribute toward improved
nowcasting techniques.
4) CLUTTER AND ANOMALOUS PROPAGATION
Polarization diversity techniques in combination
with techniques using conventional reflectivity and
Doppler could lead to an improvement of clutter
identification. Birds can strongly bias Doppler ve-
locities. Birds may be flagged by ZDR and LDR will
improve clutter identification (e.g., Wilson et al.
FIG. 6. Vertical section (RHI) taken by POLDIRAD through 1995). Anomalous propagation echoes remain
the center of a severe hailstorm that occured in southern Germany
problematic. It may be possible to use Doppler fil-
on 30 June 1990 (see Höller et al. 1994). The upper panel shows
storm-relative radial velocity vr overlayed by reflectivity contours tering techniques similar to those used for ground
(solid lines) labeled in dBZ. The lower panel indicates the different clutter removal in normal propagation conditions
types of hydrometeors as derived from ZDR and LDR measurements but in combination with polarization techniques.
taken 2 min earlier at the same azimuth. The bold arrows illustrate Further research is necessary to develop and vali-
possible streamlines. date such combined approaches.
5) DUAL WAVELENGTH TECHNIQUES
show that of the 200 observed systems, about 67% We need to make the best use of existing dual
occurred as single cell, 29% as multicell, and 4% wavelength systems for hail detection–discrimina-
as supercell storms. Frequently, single or multicells tion and for rain-rate estimates via attenuation–
Bulletin of the American Meteorological Society 1423reflectivity combination. Systems in Europe are • provide automatic Z calibration by dual polar-
used more for research than for operational work ization systems using KDP together with ZDR; and
because of their complexity (e.g., Russchenberg • estimate installation costs and added value of
1995; Dombai and Nagy 1995). Much work in the using circular polarization.
1970s carried out in the United States has not been
developed further. Using the systems in use in
Europe, we will be able to quantify the benefit and 5. Electronic scanning radars
limitations in today’s technical environment. Top-
ics to be tackled further are dynamic range prob- Over the last 10 years, defense radars have been
lems for low and high attenuation, beam matching, developed using electronic scanning technology.
complications due to Mie versus Rayleigh scatter- In parallel, VHF–UHF radars have employed this
ing, and the use for clutter detection. method to provide wind measurements in the tro-
posphere and stratosphere. Work is ongoing to in-
6) BASIS OF POLARIZATION vestigate the future design of air traffic control (ATC)
Most European polarimetric radars use linear radars and electronic scanning is being considered.
polarization, although elliptical polarizations are Weather radars with electronically scanning (“E-
available. Circular polarization has the advantage scan,” phased array) antennas are expected to pro-
that no fast switching of the polarization of the vide higher measurement speed and flexibility,
transmitted pulse is needed to estimate the param- resulting in reduced tropospheric volume acquisi-
eters of meteorological interest. The KDP from cir- tion times, an easier recognition of short duration
cular polarization may be less noisy than that from weather phenomena, and better adaptation to the
linear because no temporal interpolation of phases signal characteristics of precipitation and clutter
is needed. CDR is more sensitive to drop shape for echoes. In fact, an E-scan weather radar is not just
light rain than ZDR. CDR is not as good as ZDR for a conventional radar equipped with a new, more
hail detection (e.g., Jopson and Holt 1995) and is complicated and expensive, antenna, but needs
not able to detect weak echoes. Future work will major additional modifications in the transmitter–
concentrate on examining the quality of K DP and receiver chain as well as in the signal processing
CDR data from circular polarization and the poten- and interpretation algorithms. A complete new sys-
tial benefits for applications. tem design may be the most economical approach.
These polarization techniques need to be dem- For example, a full exploitation of the E-scan
onstrated and compared with single-polarization radar’s cycle time reduction would not be possible
and Doppler techniques in an operational environ- without providing special measures for the inten-
ment. Such a project is planned and will contrib- sity dwell-time reduction, which in turn generate
ute to the final recommendations of COST 75. problems with Doppler compatibility (need
for Doppler-immune compression–modulation
7) HARDWARE ASPECTS schemes). Furthermore, the E-scan radar’s ability
Important aspects of possible future applications of deliberately choosing the illumination and re-
of multiparameter measurements in an operational ception direction is offering new possibilities in
environment are the additional costs in relation to clutter detection–correction, to be obtained from
the improved benefits. The most important items pseudoextended dwell times for clutter-suspicious
for future work are the following: pointings (resampling of that pointing after the pre-
cipitation decorrelation time). Finally, as with each
• quantification of the effect of a radome on po- new technique, technological and economical
larization measurements; problems must be taken into account by both the
• cost estimations for the retrofit upgrading of system manufacturers as well as the potential us-
existing radars (e.g., an extra receiving channel ers, to whom it has to be demonstrated what ad-
to estimate LDR or a fast transmit switch for ZDR vantages at which price they would receive from
and KDP in comparison with a slow transmit switch different complexities of E-scan weather radars.
and a dual T/R module and additional software); The technology needed is now available and is
• how to assure high quality Z DR measurements being applied in military systems. However, the
with an accuracy up to 0.1 dB; price remains high, and further development is re-
1424 Vol. 78, No. 7, July 1997quired to be economically justifiable in civilian time. Present radars with mechanical scanning have
meteorological applications. full-volume scans as short as 5 min, while E-scan
On a worldwide basis, planning for phased-ar- radars, due to PRF and dwell times being adaptable
ray antennas in weather radars go back to the early to the type and distribution in range of target char-
1980s, when the National Center for Atmospheric acteristics, are estimated to provide full-volume
Research (NCAR) held its Rapid Scan Doppler observation durations around 1 min (Keeler and
Radar Workshop (Carbone and Carpenter 1983; Frush 1983).
Keeler and Frush 1983; Carbone et al. 1985).1 In There exists general agreement that in atmo-
Europe (excluding the former Soviet Union), first spheric research and cloud physics such short cycle
discussions on this new technique have ocurred times are needed in order to avoid overlooking
(Joss and Collier 1991; Josefsson 1991). Their con- spatially and temporally limited structures like
clusion was that it was too early to realistically apply microbursts or hail shafts, whose development and
E-scanning in operational weather radars, which is lifetimes can be a few minutes only. The question
now a theme of COST 75’s working program. of whether the 1-min cycle time would really be
The Working Group on Electronic Scanning needed in practical, operational applications was
Systems was established to deal with these topics: heavily discussed and received finally a number of
supporting arguments from applications like urban
a) justification of E-scan antennas in weather radars; hydrology, microburst detection in aviation and
b) development and testing of scanning strategies general meteorology, hail, and other severe weather
for different observational needs; detection and warning (Waters and Collier 1995).
c) investigation of the compatibility between E- The quantitative use of radar-derived precipitation
scanning and other advanced techniques (e.g., rates or cumulations would also benefit from the
Doppler, multiparameter); reduced cycle time, considering that at today’s ra-
d) development of a catalog of required antenna dar image spatial resolution (typically 1 km pixel−1)
specifications, including implementability con- a storm can move over several pixels during con-
siderations; ventional radar cycle times. It was proposed to
e) carrying out an antenna availability survey, demonstrate the quantitative superiority of the 1-
identification of existing suitable devices; min scan sequence over the conventional longer
f) collection–estimation of E-scan antenna reliabil- one, using radar data having been acquired with
ity data (e.g., mean time between failure), high temporal resolution.
g) develop specifications and requirements for
subsystems complementing the E-scan antenna, b. E-scan antennas
h) perform a market survey for E-scan weather ra- A considerable part of the group’s activities con-
dars (identification of interested user groups, cerns available E-scan antenna specifications
generate overall price projection estimates), and and technology. The group consists of European
i) investigate the possibility of initiating a “COST industry (Alenia, Ericsson, Siemens/Plessey,
75 Pilot Project” aiming at the design, produc- Segnalamento Marittimo ed Aereo, Thomson-
tion, and testing of a “European E-scan weather CSF), complemented by participants from relevant
radar prototype.” research organizations (DLR) or universities (TU-
Graz, TU Delft), and weather services (France,
The following sections present an overview of Switzerland, United Kingdom) as potential users.
topics discussed and decisions/definitions tenta- In addition, links were established to groups work-
tively agreed on so far. ing on related matters outside the COST domain
[e.g., NCAR and the Federal Aviation Administra-
a. User requirements and expected benefits tion (FAA) in the United States and the Main Geo-
Concentrating on the discussion of operational physical Observatory (MGO) in St. Petersburg,
weather radars, the main advantage in applying E- Russia, together with a Russian radar manufacturer].
scan principles is the reduction of observation cycle The major portion of work was spent on the
definition of required and available antenna speci-
1
See also material prepared for NCAR’s Rapid Scan Doppler fications needed for a dedicated E-scan weather
Workshop held in 1983 (Keeler et al. 1983). radar [as opposed to multifunction radars, like the
Bulletin of the American Meteorological Society 1425You can also read