An overview of the history, current contributions and future outlook of iNaturalist in Australia
←
→
Page content transcription
If your browser does not render page correctly, please read the page content below

CSIRO PUBLISHING
Wildlife Research, 2021, 48, 289–303                                                                                           Review
https://doi.org/10.1071/WR20154

      An overview of the history, current contributions and future
      outlook of iNaturalist in Australia

                                   A ,C                                    A,B
      Thomas Mesaglio                     and Corey T. Callaghan
      A
        Centre for Ecosystem Science, School of Biological, Earth and Environmental Sciences,
        The University of New South Wales, UNSW Sydney, NSW 2052, Australia.
      B
        Evolution & Ecology Research Centre, School of Biological, Earth and Environmental Sciences,
        The University of New South Wales, UNSW Sydney, NSW 2052, Australia.
      C
        Corresponding author. Email: thomasmesaglio@gmail.com

      Abstract. Citizen science initiatives and the data they produce are increasingly common in ecology, conservation and
      biodiversity monitoring. Although the quality of citizen science data has historically been questioned, biases can be
      detected and corrected for, allowing these data to become comparable in quality to professionally collected data.
      Consequently, citizen science is increasingly being integrated with professional science, allowing the collection of data at
      unprecedented spatial and temporal scales. iNaturalist is one of the most popular biodiversity citizen science platforms
      globally, with more than 1.4 million users having contributed over 54 million observations. Australia is the top
      contributing nation in the southern hemisphere, and in the top four contributing nations globally, with over 1.6 million
      observations of over 36 000 identified species contributed by almost 27 000 users. Despite the platform’s success, there are
      few holistic syntheses of contributions to iNaturalist, especially for Australia. Here, we outline the history of iNaturalist
      from an Australian perspective, and summarise, taxonomically, temporally and spatially, Australian biodiversity data
      contributed to the platform. We conclude by discussing important future directions to maximise the usefulness of these
      data for ecological research, conservation and policy.

      Keywords: citizen science, iNaturalist, biodiversity data, conservation, community science.

      Received 3 September 2020, accepted 16 January 2021, published online 19 March 2021

Introduction                                                             of these as accurately identified by citizen scientists (Silvertown
Citizen science, or community science – the cooperation                  et al. 2015). Further, because the quantity of data collected by
between volunteers and professional scientists – is increasingly         citizen scientists is so great, there are several statistical techni-
leveraged in the fields of ecology and conservation. Citizen             ques that can be used to identify and account for the noise and
science initiatives, and their associated data, are increasing at        bias in citizen science initiatives (Bird et al. 2014), ranging from
exponential rates (Pocock et al. 2017). As a result, biodiversity        hierarchical modelling using random effects to account for
research is increasingly reliant on citizen science data to              inherent noise (Isaac et al. 2014), to spatial and temporal
understand ecological patterns at spatial and temporal scales not        subsampling to minimise biases (Wiggins et al. 2011), to
possible mere decades ago. Concomitantly, there is an increas-           integrating professionally collected data with opportunistically
ing reliance on the use of citizen science data for conservation         collected data (Fithian et al. 2015; Pacifici et al. 2017). Statisti-
planning and monitoring (Chandler et al. 2017; McKinley et al.           cal techniques are increasingly being developed, which will
2017; Young et al. 2019). But despite the prevalence of citizen          continue to increase the utility of citizen science data for
science data, there are still several barriers to its use as a primary   biodiversity and ecological research.
research tool (Burgess et al. 2017).                                         Citizen science initiatives generally range from structured
   A major reason for the reluctance towards using citizen               (e.g. rigorous protocols, training, predetermined time and loca-
science data is questions surrounding data quality, such as              tion of surveys, collection of effort information) to unstructured
misidentifications or underlying biases skewing the data. Yet,           (e.g. no training necessary, opportunistic in nature, data col-
recent work has highlighted that the accuracy of citizen science         lected at any time or place), and each of these has trade-offs. For
data is increasingly comparable to that collected by experts             example, structured initiatives are likely to collect data with less
(Aceves-Bueno et al. 2017). An examination by external experts           bias, but the quantity of data is often greater from unstructured
of 3287 records (2234 plants, 1053 moths) submitted to the               initiatives with little to no formal protocols. Citizen science
platform iSpot (www.ispotnature.org) verified more than 92%              initiatives also vary in their approach, including contributory/

Journal compilation Ó CSIRO 2021 Open Access CC BY-NC                                                       www.publish.csiro.au/journals/wr
290     Wildlife Research                                                                                   T. Mesaglio and C. T. Callaghan

participatory (i.e. participants engage in a project developed by       observations), and uploaded on or before 21 November 2020
professionals), or collaborative (i.e. participants are involved in     (api.inaturalist.org). We used observations within continental
defining the scope, purpose, and methodology) approaches                Australia, islands under Australian jurisdiction, and the waters
(Danielsen et al. 2005; Pocock et al. 2019).                            constituting Australia’s Exclusive Economic Zone (which
    Of all citizen science initiatives, iNaturalist (www.inatural-      extends to a maximum distance of 200 nautical miles). We
ist.org) is one of the most globally successful on the basis of         followed iNaturalist’s taxonomy for all taxa. First, we highlight
participation and quantity of data collected. iNaturalist is a          the exponential growth of iNaturalist in Australia, providing a
multi-taxa citizen science platform hosted by the California            brief history of the platform from an Australian perspective.
Academy of Sciences and National Geographic Society. Its                Second, we provide a taxonomic overview of the biodiversity
primary goal is to connect people to nature, while also aiming          data, including a summary of endangered and rare species data.
to generate scientifically valuable biodiversity data. iNaturalist      Third, we provide a spatial summary of the data, highlighting
is an unstructured citizen science initiative that is opportunistic     important spatial gaps in these data. Fourth, we discuss significant
in nature, allowing participants to contribute observations (e.g.       projects, highlighting the broad utility and adaptability of the
photos, sound recordings) of any living organism, or traces             iNaturalist platform for targeted citizen science projects. Last, we
thereof, with associated spatiotemporal coordinates. Records are        conclude with an overview of significant next steps for the future
then identified to the lowest possible taxonomic resolution by          for iNaturalist in Australia that will maximise the information
other iNaturalist users. Data are presence-only, such as those          content for researchers aiming to better understand biodiversity
data from iSpot or FrogID; conversely, citizen science initiatives      research in Australia. Ultimately, we hope that this overview will
such as eBird or Reef Life Survey involve the collection of             (1) help to encourage naturalists and professionals alike to
species lists, allowing for easy inference of absences. An              become involved with the iNaturalist community in Australia,
observation is deemed ‘Research Grade’ when it has two or               and (2) stimulate future research directions that will benefit the
more suggested identifications and more than two-thirds of these        continuous improvement of iNaturalist as an entity in data
identifications agree. Although ‘Needs ID’ observations are not         collection for biodiversity research.
necessarily less taxonomically accurate than Research Grade
observations (Hochmair et al. 2020), designation as Research            Temporal summary of Australian iNaturalist data
Grade allows these records to be automatically exported to the          Current data contributions
Global Biodiversity Information Facility (GBIF; provided the            As of 21 November 2020, 26 849 users have contributed
observation is published under a CC0, CC BY, or CC BY-NC                1 637 950 verifiable observations (of which 1 036 648 are
license). Australian observations (both Research Grade and              Research Grade) of 36 391 identified species in Australia, with
Needs ID) are also automatically exported to the Atlas of Living        11 433 users providing identifications. Although ranked fourth in
Australia (ALA; provided the observation is shareable under a           the world for number of observations, Australia is ranked third for
Creative Commons license). Importantly, any subsequent                  number of species, and second for average number of observa-
changes to these observations in iNaturalist, such as changed           tions per observer (Table 1). Australian observers follow a strong
identifications, are also reflected in GBIF and the ALA.                long-tailed distribution, with the top 10 observers (representing
    Since the launch of iNaturalist in 2008, it has seen immense        0.04% of all Australian observers) contributing 20.64% of all
uptake on a global scale, with .54 million observations of              Australian observations, confirming the general pattern of ‘power
,306 000 identified species, contributed by .1.4 million obser-         users’ (Supplementary material Table S1; Wood et al. 2011;
vers and spanning 252 countries and territories. The data from          Rowley et al. 2019). The distribution of identifiers follows a
iNaturalist have already made significant impacts in ecological         similar pattern, with 16.6% of all identifications of Australian
and biodiversity research, and have been validated in their use         observations made by the top 10 users (Table S2).
for vegetation mapping, albeit at a small scale (Uyeda et al.
2020). More broadly, data from iNaturalist have been used               History of iNaturalist in Australia
to detect range extensions of alien species (Agarwal 2017;              Use of iNaturalist in Australia started slowly, with little growth
Vásquez-Restrepo and Lapwong 2018), quantify urban toler-              from 2008 to 2015. However, from mid-2016 onward, several
ance of organisms (Callaghan et al. 2020a), map character traits        events drove dramatic increases in observation rates, the number
such as wing phenotypes and colour morphs (Drury et al. 2019;           of observers, and the number of observed species (Fig. 2). First,
Lehtinen et al. 2020), and record the rediscovery of lost species       in 2016, Questagame, a different citizen science biodiversity
(Jain et al. 2019; Richart et al. 2019).                                platform, gave users the option of syncing their account with
    Surprisingly, syntheses highlighting the advances of our            iNaturalist, helping drive the first significant increase in
knowledge as a result of iNaturalist are rare, with many papers         Australian observation rates. In October 2016, the creation of the
instead focusing on singular records of interesting and unique          Australasian Fishes Project (https://www.inaturalist.org/projects/
data points (e.g. Fig. 1). Yet, such syntheses are important to (1)     australasian-fishes) sparked a similar acceleration in observation
inform the scientific community of the value of the data, (2)           rates. Before Australasian Fishes’ inception, the most observa-
provide feedback to the citizen science participants (de Vries et al.   tions uploaded in any given month only just exceeded 2000, and
2019) and iNaturalist staff, and (3) highlight future research          after its inception, observation rates more than tripled compared
questions. Here, we synthesise Australian biodiversity data con-        with the average monthly rate of the preceding year.
tributed through the iNaturalist platform. We extracted all geor-           From 2016 onwards, observations of Australian taxa have
eferenced and dated records of wild organisms from iNaturalist          continued to increase at an accelerating rate, with this sustained
associated with a photograph or sound file (i.e. ‘verifiable’           organic growth occasionally punctuated by increasingly large
History and future of iNaturalist Australia                                                                                      Wildlife Research       291

            (a)                                                                   (b)

           The critically endangered red handfish (Thymichthys politus) is       This is the first record of a female angled Australian
           one of the rarest fishes in the world, with an estimated population   barkhopper (Paraselina brunneri) since its description in 1887,
           size of under 100.                                                    and one of only five records since the holotype was collected.

            (c)                                                                   (d)

           This record of a Papuan frogmouth (Podargus papuensis) is the         This is both the only known photograph and only known
           first ever observation of this species swimming.                      georeferenced record anywhere of Clunio pacificus, a species
                                                                                 of non-biting midge.

           Fig. 1. Examples of Australian observations of extremely rare species and behaviours. (a) Phil Malin (@acanthaster); (b) Nick
           Lambert (@nicklambert); (c) David White (@davidgwhite); Thomas Mesaglio (@thebeachcomber).

                                  Table 1. Observation statistics for the top 6 contributing countries to iNaturalist

Country                        Observations                 Species              Observers                Identifiers                  Average number of
                                                                                                                                    observations per observer
USA                             28 622 336                   75 352               776 694                  104 701                            36.85
Canada                           4 076 115                   27 654               97 475                   27 083                             41.82
Mexico                           2 508 219                   36 813               57 204                   19 925                             43.85
Australia                        1 637 950                   36 391               26 849                   11 433                             61.01
United Kingdom                   1 277 446                   14 879               53 470                   12 909                             23.89
South Africa                     1 093 082                   28 703               11 889                    7253                              91.94

spikes driven by external events. The first of these major spikes                   In May 2019, the Atlas of Living Australia (ALA) began
occurred in May 2019 with the closure of BowerBird. Hosted by                    collaborating with iNaturalist by forming iNaturalist Australia, a
Museums Victoria, BowerBird was Australia’s core biodiversity                    local node of the broader iNaturalist platform. This collabora-
citizen science platform. With a particularly strong focus on                    tion has allowed the ALA to access the strong network of
invertebrates, BowerBird users tracked large range expansions                    identifiers provided by iNaturalist, while also prompting more
for invasive species (Baumann et al. 2016), rediscovered species                 Australian experts to join iNaturalist. In 2020, Australia partici-
assumed to be extinct (Richter 2015) and recorded undescribed                    pated in the City Nature Challenge (CNC; https://citynature-
species (Walker 2014). Over 70 000 records were migrated to                      challenge.org/) for the first time, with four cities, namely,
iNaturalist from BowerBird, a merger that also attracted new                     Sydney, Adelaide, Geelong and Redland City, officially com-
users from BowerBird, helping further accelerate observation                     peting, and the rest of Australia being encouraged to also submit
rates over time for the iNaturalist platform.                                    as many records as possible from 24 to 27 April. In just 4 days,
292    Wildlife Research                                                                                                    T. Mesaglio and C. T. Callaghan

                           (a) 120 000
                                                                            Total observations
                                                                            Research grade observations
                                                    100 000

                           Observations per month    80 000

                                                     60 000

                                                     40 000

                                                     20 000

                                                         0
                                                         2008 2009 2010 2011 2012 2013 2014 2015 2016 2017 2018 2019 2020 2021
                                                                                          Time
                           (b) 40 000

                                                                            Species
                                                    35 000
                                                                            Observers

                                                    30 000

                                                    25 000
                           Number

                                                    20 000

                                                    15 000

                                                    10 000

                                                     5000

                                                         0
                                                         2008 2009 2010 2011 2012 2013 2014 2015 2016 2017 2018 2019 2020 2021
                                                                                          Time

                           Fig. 2. Growth of Australian iNaturalist involvement over time. (a) Number of total observa-
                           tions and research grade observations uploaded per month. An observation is deemed ‘research
                           grade’ when it has two or more suggested identifications and more than two-thirds of these
                           identifications agree. (b) Cumulative number of observers and observed species.

1476 Australian users, many of whom were new users recruited                              32 213 observations of 5101 identified species from 25 to 28
to iNaturalist through CNC advertising, submitted 24 881 obser-                           September as part of the event, Australian uploads exceeded
vations of 4724 identified species. In May 2020, NatureShare                              100 000 in a single month for the first time.
(Victoria’s main biodiversity citizen science platform) closed
down and its records were migrated across to iNaturalist. As
with BowerBird, this process generated new iNaturalist obser-                             Taxonomic summary of Australian iNaturalist data
vations and attracted new users.                                                          Animals are the most observed kingdom in Australia on
    After the successes of the CNC, the Australian organisers                             iNaturalist (68%), followed by plants (25%) and fungi (6.5%),
coordinated the Great Southern BioBlitz (https://greatsouthern-                           with all other kingdoms constituting just 0.5% of all Australian
biobl.wixsite.com/website) to promote observations during the                             observations on iNaturalist. Species diversity follows a
southern hemisphere spring. With 1446 observers uploading                                 similar pattern, with animals constituting 58.9% of recorded
History and future of iNaturalist Australia                                                                      Wildlife Research     293

Australian species, plants 35.6%, fungi 4.7%, and the remaining        2020), highlighting the potential of iNaturalist as a powerful tool
kingdoms 0.8%.                                                         for the public to collect large quantities of data from private land
                                                                       at little to no cost. An important direction for future research is
Animalia                                                               the quantification of contributions by iNaturalist to under-
Australian animal observations are dominated by arthropods             standing biodiversity on private lands, especially through
(51.9%) and chordates (41.8%), with all other phyla being              understanding the percentage of observations made on private
represented by just 6.3% of observations. Most arthropod               land in comparison to professional science and other citizen
observations are insects (86.3%), and, indeed, insects comprise        science initiatives.
30.5% of all Australian observations and 33.6% of Australian
species across all taxa on iNaturalist. The most observed insect       Threatened species
group is Lepidoptera (50.4% of all insect observations; Fig. 3).       iNaturalist has potential for understanding the spatial and tem-
    Birds are strongly over-represented relative to their diversity,   poral distribution of threatened species, with more than 29 460
comprising 17.3% of Australian observations across all taxa            observations of 1101 Australian species with a conservation
despite comprising only 2.1% of all species. This strong sam-          status of near threatened or higher (Fig. 4). One of the greatest
pling bias towards birds is pervasive across almost all biodiver-      challenges for conservation is detection; many threatened spe-
sity data and platforms (Troudet et al. 2017), because birds tend      cies are cryptic, have low numbers or have very restricted ranges
to be more charismatic, easier to photograph and easier to             (Campos-Cerqueira and Aide 2016), so estimates of population
identify compared to other taxa (especially invertebrate groups).      size are often difficult. By spreading monitoring efforts across a
Within the chordates, fishes are strongly under-sampled relative       large number of participants, many of whom have access to
to their diversity, comprising 50.1% of all identified Australian      private land that would otherwise be difficult to monitor, plat-
chordate species on iNaturalist, but only 16.7% of observations.       forms such as iNaturalist allow the expansion of conservation
                                                                       efforts to scales that would otherwise be impossible without
Plantae                                                                citizen scientists (Ellwood et al. 2017; Steven et al. 2019).
Australian plant observations are almost entirely of vascular          Simultaneously, Australian cities are actually threatened species
plants (96.6%), with bryophytes (1.1%) the next-most observed          hotspots, with 30% of threatened species found in urban areas
group. Most vascular plant observations are dicots                     (Ives et al. 2016; Lloyd et al. 2020). Given that Australian
(Magnoliopsida; 70.1%), followed by monocots (Liliopsida;              observations on iNaturalist show a strong spatial bias towards
23.5%) and ferns (Polypodiopsida; 3.6%). The most observed             major cities and urban areas (Fig. 5), iNaturalist is well poised to
dicot order is Asterales (asters, bellflowers, fanflowers,             contribute strongly to threatened species monitoring and con-
and allies; 14.3%), and the most observed monocot order is             servation more broadly.
Asparagales (agaves, orchids, irises and allies; 64.6%).                   The potential value of iNaturalist for conservation-based
   The most speciose plant order observed in Australia on              monitoring is already apparent, with 18 627 iNaturalist records
iNaturalist is Myrtales (myrtales, evening primroses and allies)       of species with a conservation status of near threatened or above
with 1316 species, closely followed by Fabales (legumes,               having been exported to the ALA. This value is especially clear for
milkworts and allies) with 1244 species, and Asparagales with          many individual taxa; 27% of all Caladenia fulva (endangered)
1215 species.                                                          records, almost 31% of all ngwayir (Pseudocheirus occidentalis;
                                                                       critically endangered) records, and 66% of all White’s seahorse
Fungi                                                                  (Hippocampus whitei; endangered) records on the ALA are
Australian fungi observations on iNaturalist are dominated by          Australian iNaturalist observations. Future research should aim
basidiomycetes both in observations (74.2%) and species                to further quantify the contributions of iNaturalist data to conser-
(69.5%), with ascomycetes comprising 15.2% of observations             vation (e.g. Lloyd et al. 2020), and understand how these
and 29.9% of species. At the class level, 95.2% of basidiomycete       contributions may differ among taxa.
observations (75 747) and 90% of species (1148) are
agaricomycetes.                                                        The value of iNaturalist for Australian insects
                                                                       Despite insect populations across many of the major orders
Applications of iNaturalist data for conservation                      facing threats from a myriad of factors, including climate
With Earth in the midst of ‘biological annihilation’ as part of the    change, habitat destruction and the systemic use of agricultural
sixth mass extinction (Ceballos et al. 2017), it is more important     pesticides (Harvey et al. 2020; Wagner 2020), insects are
than ever to understand patterns of biodiversity across space and      strongly under-represented in conservation efforts (Didham
time. This is especially true for Australia, which has more than       et al. 2020a), and, indeed, very few species have been evaluated
1800 threatened species and one of the worst extinction rates          and assigned a conservation status (Didham et al. 2020b).
globally (Ward et al. 2019). However, monitoring threatened            Although much of the data documenting insect declines are
species can be difficult as many species’ distributions greatly        spatially biased towards North America and Europe (Simmons
overlap with private land (Bean and Wilcove 1997; Lepczyk              et al. 2019), population declines and the factors driving them
2005) and large-scale ecological monitoring programs are often         have also been identified in an Australian context (Sands 2018).
expensive (Dickinson et al. 2012). The value of Australian             Concurrently, despite progress in recognising the importance of
iNaturalist data for conservation research has recently been           and implementing conservation efforts for Australian insects,
realised (Rowley et al. 2019; Kirchhoff et al. 2021; Turak et al.      there still remain major impediments to the field. Although
294   Wildlife Research                                                                                                   T. Mesaglio and C. T. Callaghan

                           (a)

                                    Lepidoptera                                       Mammalia, Reptilia
                                                                                      Actinopterygii, Fungi

                           (b)

                                    Coleoptera                                        Santalales, Fabales,
                                                                                           Myrtales

                           (c)

                                        Magpie,                                        Platyhelminthes, Ctenophora,
                                    rainbow lorikeet                                        Annelida, Bryozoa,
                                                                                             Porifera, Cnidaria

                          Fig. 3. Visualisation of iNaturalist sampling biases in Australia towards insects and birds. Each
                          seesaw is balanced so that the total observations for the taxa on each side of the seesaw are
                          approximately equal, e.g. in (c), the total number of observations for the two most commonly
                          observed Australian bird species on iNaturalist is equal to the total observations for six invertebrate
                          phyla combined. (a) Left: David White (@davidgwhite). Right (from top left, clockwise): Deb Raph
                          (@deborod), John Sullivan (@sullivanribbit), Tony Strazzari (@tonydiver), Torbjorn von Strokirch
                          (@blackangus); (b) Left: Nick Monaghan (@nickm69). Right (from top, clockwise): Wayne Martin
                          (@w_martin), Loxley Fedec (@npk), Klaus Bohn (@kboh); (c) Left: Jack Morgan (@ratite),
                          Dianne Clarke (@dianneclarke). Right (from top, clockwise): Reiner Richter (@reiner), John
                          Turnbull (@johnturnbull), Peter Barfod (@fiftygrit), Trek Hopton (@trekh), David Muirhead
                          (@davemmdave), Sascha Schulz (@sascha_schulz).
History and future of iNaturalist Australia                                                                                    Wildlife Research   295

                    (a)                                                         (b)

                   Listed as near threatened, black-necked storks              Listed as vulnerable, grey-headed flying foxes (Pteropus
                   (Ephippiorhynchus asiaticus) are usually non-social, making poliocephalus) are greatly threatened by climate change,
                   reliable estimates of population size difficult.            with extreme temperature events causing mass die-offs.

                    (c)                                                         (d )

                   Endemic to the Otway Ranges in Victoria, Otway black        The dwarf-spider orchid (Caladenia pumila) is currently
                   snails (Victaphanta compacta) are listed as endangered      listed as critically endangered, and was presumed extinct
                   due to habitat loss and threats posed by climate change.    from 1933 until 2009, when two specimens were found.

                  Fig. 4. Examples of Australian observations of threatened species. (a) Anthony Katon (@anthonykat); (b) Ákos
                  Lumnitzer (@akoslumnitzer); (c) John Eichler (@johneichler); (d) Reiner Richter (@reiner).

limited funding, decreasing taxonomic expertise, and a lack of                 established populations of invasive species are present within
public interest all play a role (Taylor et al. 2018), the most                 10 km of the boundaries of almost 90% of the world’s protected
significant hurdles are the Linnean and Wallacean shortfalls                   areas (Liu et al. 2020). In Australia, invasive species have
(Brito 2010; Cardoso et al. 2011), i.e. that Australian insects                enormous ecological and economic impacts, incurring a cost of
constitute a vast assemblage of undescribed species for which                  more than AU$13.6 billion (losses and control) in the 2011–
little to no data exist, and the geographical distributions of                 2012 financial year alone (Hoffmann and Broadhurst 2016).
described species are similarly poorly characterised (Sands                    Australian citizen science platforms such as FeralScan and
2018; Hutchings 2019). Given recording when and where insect                   MyPestGuideTM play an integral role in modelling the distri-
species occur is a priority action to combat this data paucity,                bution of invasive species (Roy-Dufresne et al. 2019) and
citizen science is strongly positioned to help address these                   facilitating pest surveillance for biosecurity (Emery et al. 2016).
challenges (New 2018; Didham et al. 2020b; Wilson et al. 2020),                With 70 638 observations of 932 introduced species in Australia,
and with insects comprising 30.5% of all Australian observations               many of which are also invasive, iNaturalist is well positioned to
(the highest percentage for the top 15 contributing nations to                 contribute strongly to this field, particularly for significant
iNaturalist) across more than 12 000 species, iNaturalist is driving           invasive species such as the red fox (Vulpes vulpes; 1475
efforts to overcome these shortfalls. Especially notable is the                observations), cane toad (Rhinella marinus; 1043 observations)
Australian contribution to the First Known Photographs of Living               and lantana (Lantana camara; 791 observations).
Specimens project (https://www.inaturalist.org/projects/first-
known-photographs-of-living-specimens), with observations of                   Spatial summary of Australian iNaturalist data
183 Australian insect species for which no other photographs of                Although Australian observations span the continent and much
living specimens are readily available online; among these are                 of its islands, there are strong spatial biases towards major cities,
also the first ever records of several species since their original            especially along the eastern and south-eastern coasts (Fig. 5).
description (Skejo et al. 2020).                                               These biases are consistent with many citizen science initiatives
                                                                               (Geldmann et al. 2016; Callaghan et al. 2020c), and, indeed,
Invasive species                                                               ecological research more broadly (Boakes et al. 2010; Piccolo
As one of the top five drivers of global biodiversity loss, invasive           et al. 2020). This pattern is especially pronounced for Australian
species have been associated with more extinctions in the past                 citizen science initiatives that contribute to threatened species
500 years than has any other factor (Blackburn et al. 2019), and               monitoring and conservation, with strong correlations between
296     Wildlife Research                                                                                                T. Mesaglio and C. T. Callaghan

               Fig. 5. Heat map for all observations within continental Australia, islands under Australian jurisdiction, and the waters
               constituting Australia’s Exclusive Economic Zone. The warmer the colour, the greater the density of observations. Note
               that the colours code for relative density, not absolute density. Note the high density of observations around each capital
               city, as well as power-user driven, regional hotspots such as near eastern Victoria (Reiner Richter, @reiner), Taree (Victor
               Fazio III, @vicfazio3) and Coffs Harbour (Nick Lambert, @nicklambert). This figure was adapted from the inbuilt heat
               map available at www.inaturalist.org/observations/map#2/0/0. Note that the default zoom level is #2; we zoomed to level
               #6, and then manually stitched together 25 individual screenshots of Australia and its waters.

project density and population density along the south-eastern                 much of Australia’s arid interior is extremely data deficient,
and south-western coasts (Lloyd et al. 2020), mirroring the                    including vast tracts of the Nullabor, Great Victoria Desert and
patterns seen in Fig. 5. Although many of the Australian                       Simpson Desert. This under-sampling is also reflected in pro-
iNaturalist observation hotspots are associated with the most                  fessional science for many taxa, especially at local scales
populous capital cities, others are also driven by the presence of             (Schmidt-Lebuhn et al. 2012), highlighting a key target area
research institutions, such as the efforts of James Cook                       for future sampling.
University students at Cairns, and the contributions of individual                Another conspicuous spatial gap exists in tropical northern
power users.                                                                   Australia, with most of Arnhem Land being unsampled by
   But despite strong spatial coverage along the eastern and                   iNaturalist. Improving sampling across this region is crucial
south-eastern coasts, and south-western corner, there are still                given its high biodiversity and endemicity (Woinarski et al.
many large areas of Australia with little or no iNaturalist                    2009), the recent drastic decline of its small to medium mammal
observations. Outside small, largely tourist-driven clusters                   biota (Einoder et al. 2018), and the under-sampling of its fauna
around Alice Springs and Uluru–Kata Tjuta National Park,                       even in professional science and for charismatic taxa such as
History and future of iNaturalist Australia                                                                               Wildlife Research     297

                                     Table 2. Selected examples of successful Australian iNaturalist projects

Project                                       Focus(es)                                         Observations    Species      Observers    Identifiers
Australasian Fishes                           Ray-finned fishes (Actinopterygii); lobe-finned     99 527         2664          3129           1670
  (https://www.inaturalist.org/projects/        fishes (Sarcopterygii); jawless fishes
  australasian-fishes)                          (Agnatha); sharks and rays (Elasmobranchii)
Backyard Species Discovery with Bush Blitz    All taxa                                            109 122        8455           179           2362
  (Australia)
  (https://www.inaturalist.org/projects/
  backyard-species-discovery-with-bush-
  blitz-australia)
Fungimap Australia                            Fungi                                               30 216         1032           343           602
  (https://www.inaturalist.org/projects/
  fungimap-australia)
Cicadas of Australia                          Cicadas (Cicadoidea)                                10 402         166           1266           374
  (https://www.inaturalist.org/projects/
  cicadas-of-australia)
Environment Recovery Project: Australian      Observations from areas affected by the              9980          1846           308           624
  Bushfires                                     2019–2020 bushfire season, and subsequent
  (https://www.inaturalist.org/projects/        bushfires
  environment-recovery-project-australian-
  bushfires)

mammals (Ziembicki et al. 2015). Similarly, despite the                     ready-made for immediate data collection, obviating the need
region’s high threatened species richness, citizen science initia-          for project managers to build any data collection tools
tives targeting these species are relatively low in number (Lloyd           themselves.
et al. 2020), reinforcing the value of engaging citizen scientists
across this region.                                                         Factors driving successful projects
    Perhaps the most poorly sampled regions of Australia on                 Many of the most successful Australian projects (Table 2) are
iNaturalist are its offshore waters, particularly those beyond the          driven by one, or both, of two key factors. First, although many
continental shelf (.200 m water depth). These zones are                     projects have a specific taxonomic or ecological focus, suc-
characterised by low numbers of specimens, gaps in taxonomic                cessful projects often collect observations and data at large
knowledge and many species awaiting discovery and descrip-                  spatial scales, maximising participation and allowing the
tion (Williams et al. 2018). Although this data paucity is                  development of a diverse community of users. Second, suc-
understandable given the inaccessibility of these regions and               cessful projects are often monitored and/or administrated by a
habitats, especially to citizen scientists, it highlights the impor-        core group of professional experts who consistently provide
tance of diversifying and recruiting new iNaturalist users from             identifications and teach other users, driving the creation of a
sectors such as commercial fisheries.                                       strong community with similar interests. This opportunity to
                                                                            collaborate with and learn from professionals is an important
Leveraging an existing platform for focussed projects                       and highly valued aspect of citizen science initiatives (Johnson
One of iNaturalist’s most powerful attributes is the ‘Project’              et al. 2014; Steven et al. 2019), and indeed in many cases, this
feature. Projects allow users to filter and collect observations            learning is mutual (Dowthwaite and Sprinks 2019; Pearse 2020),
either automatically on the basis of their metadata, such as                further motivating the professionals.
spatial coordinates or dates of observation (collection projects);              Australasian Fishes, the longest-running and most successful
or, manually by collating observations with some unifying                   Australian iNaturalist project, highlights the value of these two
theme, such as observations of feathers or records of predator–             factors for project success. Created in late 2016 by Mark
prey relationships (traditional projects). Although iNaturalist is          McGrouther (@markmcg), the former Ichthyology Collection
broadly an unstructured, opportunistic data collection platform,            Manager at the Australian Museum, the project focuses on
projects provide the scope for more structured protocols and                fishes, sharks and rays across Australia and New Zealand.
sampling designs; many projects are designed around customi-                Almost 15% of all users who have contributed data for Australia
sable observation fields or the collection of additional metadata           have also contributed to Australasian Fishes, with an extensive
unique to a specific scientific objective or hypothesis (e.g. host          network of museum curators, taxonomic experts, researchers
plant, substrate, or habitat information), highlighting iNatural-           and many passionate amateur naturalists from all around
ist’s potential to shift towards semi-structured data collection            Australia helping build a strong community. These successes
when used in this way. Given projects are simple and fast to                are reflected in the use of photographs and observation meta-
create, intuitive to interact with, and require minimal manipu-             data from the project in research (e.g. Booth and Sear 2018;
lation to be effective, they are an ideal tool for collecting both          Fetterplace et al. 2018). Australasian Fishes members were
spatiotemporal and secondary data. Perhaps the greatest strength            also heavily involved in the first ever record of a hoodwinker
of projects is that they offer existing digital infrastructure              sunfish (Mola tecta) in the northern hemisphere, which made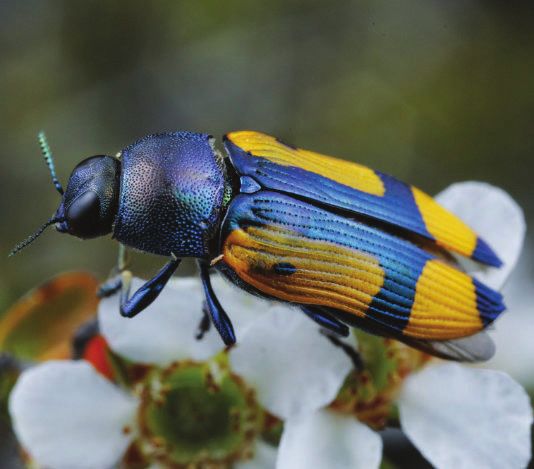
298     Wildlife Research                                                                                 T. Mesaglio and C. T. Callaghan

international headlines in 2019 (https://www.bbc.com/news/            applications of the data is immense. We propose the following
world-us-canada-47424072). Cicadas of Australia is another            four key future research directions for the use of iNaturalist data
popular taxon-specific, community-driven project, with almost         by Australian ecological researchers: (1) use of existing data to
1300 contributors across Australia able to learn from a core          model species distributions in space and time, (2) extraction of
group of Australian cicada experts, and, in return, provide           secondary data from observations, (3) increased collaboration
valuable local knowledge that also benefits the experts.              with taxonomic experts, and (4) dynamic use of the data and
                                                                      integration into policy planning.
Benefits of successful projects                                           Given the scale of massive citizen science datasets, many
                                                                      applications of these data lie in estimating the abundance of
Designed to rapidly collect data after the devastating 2019–2020
                                                                      species across space and time (Tulloch et al. 2013; Chandler et al.
Australian bushfire season, the Environment Recovery Project
                                                                      2017; Callaghan et al. 2020b). Indeed, outside Australia, iNatur-
run by the University of New South Wales’ Centre for Ecosys-
                                                                      alist data have already been used to inform local population trends
tem Science has been hugely productive. The easy to use, ready-
                                                                      (Erickson and Burt 2019) and model species distributions at a
made digital infrastructure provided by the project feature,
                                                                      continental scale (Wang et al. 2018). With over 1.6 million
combined with a strong media campaign (e.g. https://www.abc.
                                                                      observations having already been submitted for Australia, a major
net.au/triplej/programs/hack/citizen-science-project-bushfire-
                                                                      focus of research in the near future should be its use for modelling
recovery-needs-your-help/11910486), helped drive the upload
                                                                      species distributions and detecting population trends in space and
of 10 000 observations by more than 300 observers across south-
                                                                      time. The paucity of current research from an Australian iNatur-
eastern Australia in just 10 months, including data collected
                                                                      alist perspective highlights the need to focus on large-scale trends
within days of fires occurring. These successes have seen the
                                                                      using massive datasets; many of the papers that do utilise
project already generate research output (Kirchhoff et al. 2021),
                                                                      Australian iNaturalist data are brief records of range shifts or
with invaluable data tracking the recovery of Australian eco-
                                                                      rare species at novel locations (Booth and Sear 2018; Hewish
systems continuing to be collected.
                                                                      2019; Schubert 2020), whereas other papers have used Australian
    Overcoming sampling biases towards charismatic taxa is
                                                                      data as part of assessments of data quality (Hochmair et al. 2020).
another benefit of successful projects. Fungal taxonomy and
                                                                      Although iNaturalist is largely restricted to presence-only data,
conservation are largely neglected fields, especially in Australia;
                                                                      there is an increasing number of methods able to account for
a paucity of mycologists, the cryptic nature of many species
                                                                      missing absence data (Fithian et al. 2015; Roberts et al. 2017),
(especially owing to the ephemerality of fruiting bodies for many
                                                                      mostly by integrating citizen science data with data from other
groups), and the prominence of pathogenic species in the public
                                                                      sources such as remote sensing or professional surveys (He et al.
consciousness (Irga et al. 2018) have all contributed to a lack of
                                                                      2015; Pacifici et al. 2017).
knowledge of this group. Given that the conservation of fungi
                                                                          iNaturalist is also an untapped resource for valuable second-
requires an understanding of how many species exist and the
                                                                      ary data beyond spatiotemporal coordinates on a map (Gazdic
resolution of taxonomic opacity, iNaturalist Australia is well
                                                                      and Groom 2019; Callaghan et al. 2020b). Although this poten-
placed to contribute significantly, with Fungimap Australia
                                                                      tial has been recently realised in North America, with studies
featuring more than 30 000 observations of over 1000 species.
                                                                      undertaking continent-scale assessments of phenotypic (Drury
The promotion of this project and the recruitment of professional
                                                                      et al. 2019) and phenological data (Barve et al. 2020) using
mycologists to teach and collaborate with citizen scientists
                                                                      iNaturalist observations, these applications are mostly unrea-
(Grube et al. 2017) will improve the quality of the fungal dataset
                                                                      lised in an Australian context. Capitalising on this secondary
of iNaturalist Australia and help drive conservation efforts.
                                                                      information, for example, extracting plant–pollinator relation-
    The robust existing data collection frameworks created
                                                                      ships or colour morphs across a species’ range, will vastly
by projects also help attract more professional scientists. As
                                                                      expand the already considerable potential of Australian iNatur-
Australia’s largest biodiversity discovery program, Bush Blitz’s
                                                                      alist observations as a source for understanding biodiversity
involvement with iNaturalist through the Backyard Species
                                                                      (Tulloch et al. 2013).
Discovery with Bush Blitz project has driven a large uptick in
                                                                          A crucial direction to help facilitate improvement of the data
Australian taxonomic experts joining iNaturalist, especially for
                                                                      is the continued recruitment of Australian taxonomic experts,
many less charismatic taxa. This recruitment has been crucial for
                                                                      particularly for esoteric taxa for which iNaturalist currently has
driving greater engagement between experts and amateur nat-
                                                                      few trained identifiers. Greater involvement by these experts
uralists. An important future area will be quantifying the impact
                                                                      will facilitate learning by citizen scientists (Domroese and
of these experts with respect to data quality and accuracy of
                                                                      Johnson 2017; Parrish et al. 2018), motivating them to make
identifications, similar to previous analyses of identification
                                                                      more and better observations (e.g. learning which features are
accuracy by platforms such as iSpot (Silvertown et al. 2015).
                                                                      required for different taxa, and photographing these accordingly
                                                                      to promote easier identification). In turn, this will improve the
Directions for the future of iNaturalist in Australia                 data further, thus attracting more experts in a positive feedback
With Australian contributions to iNaturalist continuing to            loop (Fig. 6).
accelerate exponentially across all metrics, including number of          Finally, we highlight the need for, and importance of, using
observations, observers, and species, increasingly large datasets     Australian iNaturalist data to inform policy. Scientific policy
will become available to researchers in the future. By optimising     decisions are often dictated, for the worse, by the costs associ-
when, where and how biodiversity is sampled and identified            ated with data collection and research (Vuong 2018), and these
(Callaghan et al. 2019), the scope for research opportunities and     decisions can have significant negative repercussions for
History and future of iNaturalist Australia Wildlife Research 299
More experts join iNaturalist
More observations identified,
experts teach citizen scientists
Quality Grade: Research
Quality of data across
iNaturalist improves
Citizen scientists make
better identifications and
become enthused to make
more and better observations
Fig. 6. Conceptual figure showing the positive feedback loop as iNaturalist continues to grow in
Australia. As more taxonomic experts join iNaturalist, more observations will increase the bioliteracy of
the data, providing more data for ecological and conservation research questions in Australia.
biodiversity (Azevedo-Santos et al. 2017). Because citizen Conclusions
science data are typically collected and verified at little or no Australia’s contributions to iNaturalist are significant (e.g.
cost, a model followed by iNaturalist, integration with profes- Fig. 2). Moving beyond singular records of interesting and
sional data collection greatly reduces the costs of ecological unique data points (e.g. Fig. 1) and, instead, focusing on the
monitoring and expedites scientific discoveries (Cavalier and integration of Australian iNaturalist data into professional eco-
Kennedy 2016; Nascimento et al. 2018), providing incentivisa- logical research is an important future step towards fully rea-
tion for policymakers to utilise these data so as to implement lising the value of these data. That citizen science data can
meaningful policies. This is especially important in Australian significantly contribute to broad-scale ecological databases and
cities, where the disproportionate presence of threatened species drive research in spatial ecology, conservation, and macro-
compared with less urban areas provides many opportunities for ecology is clear (Kobori et al. 2016; Poisson et al. 2020), and
conservation practitioners and policymakers to engage with although well structured citizen science projects produce the
citizen science (Ives et al. 2016). Collaboration within iNatur- most robust data, even projects with opportunistic data collec-
alist is also a boon for policy; the ability for taxonomic experts to tion and little participant training can still contribute to eco-
review data points and provide identifications in real time logical monitoring (Brown and Williams 2019). Given that the
increases the legitimacy of the data and better informs policy establishment of robust databases is a crucial facet of ecological
and legislation (Couvet et al. 2008; Jones et al. 2019), with the research (Osawa 2019), iNaturalist is well positioned to be a
expediency of this data filtering being especially important to major source of ecological data into the future to better under-
ameliorate the consistently slow transfer of research findings stand Australian ecology and conservation. Although the value
into policy (Dunn et al. 2018). Given that the science–policy of these data for use in broad ecological research and biodi-
interface in Australian government has been historically char- versity monitoring is increasingly being recognised, there is still
acterised by conflicting ideologies, poor communication and great potential for improvement. The optimisation of data
systemic inflexibility (Hickey et al. 2013), iNaturalist Australia sampling, recruitment of more taxonomic experts, and increased
has a critical role to play. exploration of secondary data integration are all important300 Wildlife Research T. Mesaglio and C. T. Callaghan
drivers of this improvement, and will drive better science–policy Callaghan, C. T., Poore, A. G., Major, R. E., Rowley, J. J., and Cornwell,
communication. W. K. (2019). Optimizing future biodiversity sampling by citizen
scientists. Proceedings. Biological Sciences 286, 20191487.
Conflicts of interest doi:10.1098/rspb.2019.1487
Callaghan, C. T., Ozeroff, I., Hitchcock, C., and Chandler, M. (2020a).
The authors declare no conflicts of interest. Capitalizing on opportunistic science data to monitor urban biodiversity:
a multi-taxa framework. Biological Conservation 251, 108753.
Acknowledgements Callaghan, C. T., Poore, A. G., Mesaglio, T., Moles, A. T., Nakagawa, S.,
We thank the thousands of contributors who have uploaded observations of Roberts, C., Rowley, J. J., Vergés, A., Wilshire, J. H., and Cornwell,
Australian species, and identified these observations for others. Thanks also W. K. (2020b). Three frontiers for the future of biodiversity research
to Mark McGrouther for providing material for the Australasian Fishes using citizen science data. BioScience 71, 55–63. doi:10.1093/biosci/
section. Two anonymous reviewers provided thoughtful comments that biaa131
substantially improved this manuscript. This research did not receive any Callaghan, C. T., Roberts, J. D., Poore, A. G., Alford, R. A., Cogger, H., and
specific funding. Rowley, J. J. (2020c). Citizen science data accurately predicts expert-
derived species richness at a continental scale when sampling thresholds
References are met. Biodiversity and Conservation 29, 1323–1337. doi:10.1007/
Aceves-Bueno, E., Adeleye, A. S., Feraud, M., Huang, Y., Tao, M., Yang, s10531-020-01937-3
Y., and Anderson, S. E. (2017). The accuracy of citizen science data: a Campos-Cerqueira, M., and Aide, T. M. (2016). Improving distribution data
quantitative review. Bulletin of the Ecological Society of America 98, of threatened species by combining acoustic monitoring and occupancy
278–290. doi:10.1002/bes2.1336 modelling. Methods in Ecology and Evolution 7, 1340–1348.
Agarwal, M. (2017). First record of Dendronotus orientalis (Baba, 1932) doi:10.1111/2041-210X.12599
(Nudibranchia: Dendronotidae) in the temperate eastern Pacific. BioIn- Cardoso, P., Erwin, T. L., Borges, P. A., and New, T. R. (2011). The seven
vasions Records 6, 135–138. doi:10.3391/bir.2017.6.2.08 impediments in invertebrate conservation and how to overcome them.
Azevedo-Santos, V. M., Fearnside, P. M., Oliveira, C. S., Padial, A. A., Biological Conservation 144, 2647–2655. doi:10.1016/j.biocon.2011.
Pelicice, F. M., Lima, D. P., Simberloff, D., Lovejoy, T. E., Magalhaes, 07.024
A. L., Orsi, M. L., and Agostinho, A. A. (2017). Removing the abyss Cavalier, D., and Kennedy, E. B. (Eds) (2016). ‘The Rightful Place of
between conservation science and policy decisions in Brazil. Biodiver- Science: Citizen Science.’ (Consortium for Science, Policy &
sity and Conservation 26, 1745–1752. doi:10.1007/s10531-017-1316-x Outcomes.)
Barve, V. V., Brenskelle, L., Li, D., Stucky, B. J., Barve, N. V., Hantak, Ceballos, G., Ehrlich, P. R., and Dirzo, R. (2017). Biological annihilation via
M. M., McLean, B. S., Paluh, D. J., Oswald, J. A., Belitz, M. W., and the ongoing sixth mass extinction signaled by vertebrate population
Folk, R. A. (2020). Methods for broad-scale plant phenology assess- losses and declines. Proceedings of the National Academy of Sciences of
ments using citizen scientists’ photographs. Applications in Plant the United States of America 114, E6089–E6096. doi:10.1073/pnas.
Sciences 8, e11315. doi:10.1002/aps3.11315 1704949114
Baumann, J. M., Walker, K., Threlfall, C., and Williams, N. S. (2016). Chandler, M., See, L., Copas, K., Bonde, A. M., López, B. C., Danielsen, F.,
African Carder bee, Afranthidium (Immanthidium) repetitum Legind, J. K., Masinde, S., Miller-Rushing, A. J., Newman, G., and
(Hymenoptera: Megachilidae): a new exotic species for Victoria. Victo- Rosemartin, A. (2017). Contribution of citizen science towards interna-
rian Naturalist 133, 21. tional biodiversity monitoring. Biological Conservation 213, 280–294.
Bean, M. J., and Wilcove, D. S. (1997). The private-land problem. Conser- doi:10.1016/j.biocon.2016.09.004
vation Biology 11, 1–2. doi:10.1046/j.1523-1739.1997.011001001.x Couvet, D., Jiguet, F., Julliard, R., Levrel, H., and Teyssedre, A. (2008).
Bird, T. J., Bates, A. E., Lefcheck, J. S., Hill, N. A., Thomson, R. J., Edgar, Enhancing citizen contributions to biodiversity science and public
G. J., Stuart-Smith, R. D., Wotherspoon, S., Krkosek, M., Stuart-Smith, policy. Interdisciplinary Science Reviews 33, 95–103. doi:10.1179/
J. F., Pecl, G. T., Barrett, N., and Frusher, S. (2014). Statistical solutions 030801808X260031
for error and bias in global citizen science datasets. Biological Conser- Danielsen, F., Burgess, N. D., and Balmford, A. (2005). Monitoring matters:
vation 173, 144–154. doi:10.1016/j.biocon.2013.07.037 examining the potential of locally-based approaches. Biodiversity and
Blackburn, T. M., Bellard, C., and Ricciardi, A. (2019). Alien versus native Conservation 14, 2507–2542. doi:10.1007/s10531-005-8375-0
species as drivers of recent extinctions. Frontiers in Ecology and the de Vries, M., Land-Zandstra, A., and Smeets, I. (2019). Citizen scientists’
Environment 17, 203–207. doi:10.1002/fee.2020 preferences for communication of scientific output: a literature review.
Boakes, E. H., McGowan, P. J., Fuller, R. A., Chang-qing, D., Clark, N. E., Citizen Science: Theory and Practice 4, 1–13.
O’Connor, K., and Mace, G. M. (2010). Distorted views of biodiversity: Dickinson, J. L., Shirk, J., Bonter, D., Bonney, R., Crain, R. L., Martin, J.,
spatial and temporal bias in species occurrence data. PLoS Biology 8, Phillips, T., and Purcell, K. (2012). The current state of citizen science as
e1000385. doi:10.1371/journal.pbio.1000385 a tool for ecological research and public engagement. Frontiers in
Booth, D. J., and Sear, J. (2018). Coral expansion in Sydney and associated Ecology and the Environment 10, 291–297. doi:10.1890/110236
coral-reef fishes. Coral Reefs 37, 995. doi:10.1007/s00338-018-1727-5 Didham, R. K., Barbero, F., Collins, C. M., Forister, M. L., Hassall, C.,
Brito, D. (2010). Overcoming the Linnean shortfall: data deficiency and Leather, S. R., Packer, L., Saunders, M. E., and Stewart, A. J. (2020a).
biological survey priorities. Basic and Applied Ecology 11, 709–713. Spotlight on insects: trends, threats and conservation challenges. Insect
doi:10.1016/j.baae.2010.09.007 Conservation and Diversity 13, 99–102. doi:10.1111/icad.12409
Brown, E. D., and Williams, B. K. (2019). The potential for citizen science to Didham, R. K., Basset, Y., Collins, C. M., Leather, S. R., Littlewood, N. A.,
produce reliable and useful information in ecology. Conservation Menz, M. H., Müller, J., Packer, L., Saunders, M. E., Schönrogge, K., and
Biology 33, 561–569. doi:10.1111/cobi.13223 Stewart, A. J. (2020b). Interpreting insect declines: seven challenges and
Burgess, H. K., DeBey, L. B., Froehlich, H. E., Schmidt, N., Theobald, E. J., a way forward. Insect Conservation and Diversity 13, 103–114.
Ettinger, A. K., HilleRisLambers, J., Tewksbury, J., and Parrish, J. K. doi:10.1111/icad.12408
(2017). The science of citizen science: exploring barriers to use as a Domroese, M. C., and Johnson, E. A. (2017). Why watch bees? Motivations
primary research tool. Biological Conservation 208, 113–120. of citizen science volunteers in the Great Pollinator Project. Biological
doi:10.1016/j.biocon.2016.05.014 Conservation 208, 40–47. doi:10.1016/j.biocon.2016.08.020History and future of iNaturalist Australia Wildlife Research 301
Dowthwaite, L., and Sprinks, J. (2019). Citizen science and the professional– Hochmair, H. H., Scheffrahn, R. H., Basille, M., and Boone, M. (2020).
amateur divide: lessons from differing online practices. Journal of Evaluating the data quality of iNaturalist termite records. PLoS One 15,
Science Communication 18, A06. doi:10.22323/2.18010206 e0226534. doi:10.1371/journal.pone.0226534
Drury, J. P., Barnes, M., Finneran, A. E., Harris, M., and Grether, G. F. Hoffmann, B. D., and Broadhurst, L. M. (2016). The economic cost of
(2019). Continent-scale phenotype mapping using citizen scientists’ managing invasive species in Australia. NeoBiota 31, 1–18. doi:10.3897/
photographs. Ecography 42, 1436–1445. doi:10.1111/ecog.04469 neobiota.31.6960
Dunn, G., Bos, J. J., and Brown, R. R. (2018). Mediating the science-policy Hutchings, P. (2019). An advocate for taxonomic research in Australia.
interface: insights from the urban water sector in Melbourne, Australia. Pacific Conservation Biology 25, 34–36. doi:10.1071/PC17033
Environmental Science & Policy 82, 143–150. doi:10.1016/j.envsci. Irga, P. J., Barker, K., and Torpy, F. R. (2018). Conservation mycology in
2018.02.001 Australia and the potential role of citizen science. Conservation Biology
Einoder, L. D., Southwell, D. M., Lahoz-Monfort, J. J., Gillespie, G. R., 32, 1031–1037. doi:10.1111/cobi.13121
Fisher, A., and Wintle, B. A. (2018). Occupancy and detectability Isaac, N. J., van Strien, A. J., August, T. A., de Zeeuw, M. P., and Roy, D. B.
modelling of vertebrates in northern Australia using multiple sampling (2014). Statistics for citizen science: extracting signals of change from
methods. PLoS One 13, e0203304. doi:10.1371/journal.pone.0203304 noisy ecological data. Methods in Ecology and Evolution 5, 1052–1060.
Ellwood, E. R., Crimmins, T. M., and Miller-Rushing, A. J. (2017). Citizen doi:10.1111/2041-210X.12254
science and conservation: recommendations for a rapidly moving field. Ives, C. D., Lentini, P. E., Threlfall, C. G., Ikin, K., Shanahan, D. F., Garrard,
Biological Conservation 208, 1–4. doi:10.1016/j.biocon.2016.10.014 G. E., Bekessy, S. A., Fuller, R. A., Mumaw, L., Rayner, L., and Rowe, R.
Emery, R. N., Fagan, L., McCauley, R., Hardie, D., Hammond, N., Cook, D., (2016). Cities are hotspots for threatened species. Global Ecology and
Wright, D., Cousins, D., Russell, J., and Garel, N. (2016). MyPestGuide – Biogeography 25, 117–126. doi:10.1111/geb.12404
the ‘BEST’ suite of biosecurity engagement and surveillance tools. In Jain, A., Chan, S. K. M., Soh, M., and Chow, L. (2019). Rediscovery of the
‘2016 International Congress of Entomology’. (Entomological Society orange gull butterfly, Cepora iudith malaya, in Singapore. Singapore
of America: Annapolis, MD, USA.) Biodiversity Records 22–23.
Erickson, R. A., and Burt, W. G. (2019). Additional information on a Johnson, M. F., Hannah, C., Acton, L., Popovici, R., Karanth, K. K., and
nonnative whiptail population (Aspidoscelis flagellicauda/sonorae Weinthal, E. (2014). Network environmentalism: citizen scientists as
complex) in suburban Orange County, California. Bulletin of the agents for environmental advocacy. Global Environmental Change 29,
Southern California Academy of Sciences 118, 76–78. doi:10.3160/ 235–245. doi:10.1016/j.gloenvcha.2014.10.006
0038-3872-118.1.76 Jones, C. D., Glon, M. G., Cedar, K., Paiero, S. M., Pratt, P. D., and Preney,
Fetterplace, L. C., Turnbull, J. W., Knott, N. A., and Hardy, N. A. (2018). T. J. (2019). First record of paintedhand mudbug (Lacunicambarus
The devil in the deep: expanding the known habitat of a rare and polychromatus) in Ontario and Canada and the significance of iNaturalist
protected fish. European Journal of Ecology 4, 22–29. doi:10.2478/ in making new discoveries. Canadian Field Naturalist 133, 160–166.
eje-2018-0003 doi:10.22621/cfn.v133i2.2223
Fithian, W., Elith, J., Hastie, T., and Keith, D. A. (2015). Bias correction in Kirchhoff, C., Callaghan, C. T., Keith, D. A., Indiarto, D., Taseski, G., Ooi,
species distribution models: pooling survey and collection data for M. K., Le Breton, T. D., Mesaglio, T., Kingsford, R. T., and Cornwell, W.
multiple species. Methods in Ecology and Evolution 6, 424–438. (2021). Rapidly mapping fire effects on biodiversity at a large-scale
doi:10.1111/2041-210X.12242 using citizen science. The Science of the Total Environment 755, 142348.
Gazdic, M., and Groom, Q. (2019). iNaturalist is an unexploited source of doi:10.1016/j.scitotenv.2020.142348
plant–insect interaction data. Biodiversity Information Science and Kobori, H., Dickinson, J. L., Washitani, I., Sakurai, R., Amano, T., Komatsu,
Standards 3, e37303. doi:10.3897/biss.3.37303 N., Kitamura, W., Takagawa, S., Koyama, K., Ogawara, T., and Miller-
Geldmann, J., Heilmann-Clausen, J., Holm, T. E., Levinsky, I., Markussen, Rushing, A. J. (2016). Citizen science: a new approach to advance
B., Olsen, K., Rahbek, C., and Tøttrup, A. P. (2016). What determines ecology, education, and conservation. Ecological Research 31, 1–19.
spatial bias in citizen science? Exploring four recording schemes with doi:10.1007/s11284-015-1314-y
different proficiency requirements. Diversity & Distributions 22, 1139– Lehtinen, R. M., Carlson, B. M., Hamm, A. R., Riley, A. G., Mullin, M. M.,
1149. doi:10.1111/ddi.12477 and Gray, W. J. (2020). Dispatches from the neighborhood watch: using
Grube, M., Gaya, E., Kauserud, H., Smith, A. M., Avery, S. V., Fernstad, citizen science and field survey data to document color morph frequency
S. J., Muggia, L., Martin, M. D., Eivindsen, T., Koljalg, U., and in space and time. Ecology and Evolution 10, 1526–1538. doi:10.1002/
Bendiksby, M. (2017). The next generation fungal diversity researcher. ece3.6006
Fungal Biology Reviews 31, 124–130. doi:10.1016/j.fbr.2017.02.001 Lepczyk, C. A. (2005). Integrating published data and citizen science to
Harvey, J. A., Heinen, R., Armbrecht, I., Basset, Y., Baxter-Gilbert, J. H., describe bird diversity across a landscape. Journal of Applied Ecology
Bezemer, T. M., Böhm, M., Bommarco, R., Borges, P. A., Cardoso, P., 42, 672–677. doi:10.1111/j.1365-2664.2005.01059.x
and Clausnitzer, V. (2020). International scientists formulate a roadmap Liu, X., Blackburn, T. M., Song, T., Wang, X., Huang, C., and Li, Y. (2020).
for insect conservation and recovery. Nature Ecology & Evolution 4, Animal invaders threaten protected areas worldwide. Nature Commu-
174–176. doi:10.1038/s41559-019-1079-8 nications 11, 1–9.
He, K. S., Bradley, B. A., Cord, A. F., Rocchini, D., Tuanmu, M. N., Lloyd, T. J., Fuller, R. A., Oliver, J. L., Tulloch, A., Barnes, M., and Steven,
Schmidtlein, S., Turner, W., Wegmann, M., and Pettorelli, N. (2015). R. (2020). Estimating the spatial coverage of citizen science for moni-
Will remote sensing shape the next generation of species distribution toring threatened species. Global Ecology and Conservation 23, e01048.
models? Remote Sensing in Ecology and Conservation 1, 4–18. doi:10.1016/j.gecco.2020.e01048
doi:10.1002/rse2.7 McKinley, D. C., Miller-Rushing, A. J., Ballard, H. L., Bonney, R., Brown,
Hewish, M. (2019). Swamp Bluet Coenagrion lyelli Tillyard (Odonata: H., Cook-Patton, S. C., Evans, D. M., French, R. A., Parrish, J. K.,
Zygoptera: Coenagrionidae) In South Australia. Victorian Entomologist Phillips, T. B., and Ryan, S. F. (2017). Citizen science can improve
49, 81. conservation science, natural resource management, and environmental
Hickey, G. M., Forest, P., Sandall, J. L., Lalor, B. M., and Keenan, R. J. protection. Biological Conservation 208, 15–28. doi:10.1016/j.biocon.
(2013). Managing the environmental science–policy nexus in govern- 2016.05.015
ment: perspectives from public servants in Canada and Australia. Nascimento, S., Rubio Iglesias, J. M., Owen, R., Schade, S., and Shanley, L.
Science & Public Policy 40, 529–543. doi:10.1093/scipol/sct004 (2018). Citizen science for policy formulation and implementation. InYou can also read