Analysis of cancer-promoting genes related to chemotherapy resistance in esophageal squamous cell carcinoma
←
→
Page content transcription
If your browser does not render page correctly, please read the page content below
Original Article
                                                                                                                                         Page 1 of 12

Analysis of cancer-promoting genes related to chemotherapy
resistance in esophageal squamous cell carcinoma
Feng Xie 1#, Donglei Zhang 1#, Xiaoqing Qian 2#^, Huabing Wei 1, Lihuang Zhou 1, Chunyong Ding 3,
Wenbiao Pan1, Qing Ye1
1
    Department of Thoracic Surgery, Renji Hospital, Shanghai Jiaotong University School of Medicine, Shanghai, China; 2School of Biomedical
Engineering, Shanghai Jiaotong University, Shanghai, China; 3School of Pharmacy, Shanghai Jiaotong University, Shanghai, China
Contributions: (I) Conception and design: F Xie; (II) Administrative support: Q Ye; (III) Provision of study materials or patients: D Zhang, W Pan; (IV)
Collection and assembly of data: X Qian, C Ding; (V) Data analysis and interpretation: H Wei, L Zhou; (VI) Manuscript writing: All authors; (VII)
Final approval of manuscript: All authors.
#
These authors contributed equally to this work.
Correspondence to: Wenbiao Pan; Qing Ye. Department of Thoracic Surgery, Renji Hospital, Shanghai Jiaotong University School of Medicine, 160
Pujian Road, Shanghai 200127, China. Email: pyw244@163.com; yeqing1@hotmail.com.

                  Background: According to histopathology, esophageal cancer can be divided into squamous cell carcinoma
                  (SCC) and esophageal adenocarcinoma (adeno arcinoma). In China, 90% of esophageal cancer patients are
                  squamous cell carcinoma. Cisplatin and fluaziridine are the main chemotherapy before and after surgery.
                  Long-term drug treatment is often accompanied by the emergence of drug resistance of tumor cells. There
                  are many mechanisms for the emergence of drug resistance of tumor cells, including the increase of drug
                  efflux, the decrease of drug intake, the inhibition of cell apoptosis, and so on. This study aimed to investigate
                  the key cancer-promoting genes related to chemotherapy resistance in esophageal squamous cell carcinoma
                  (ESCC).
                  Methods: Two datasets from the Gene Expression Omnibus (GEO) database (GSE86099 and GSE50224)
                  were retrieved. We performed microRNA (miRNA) and messenger RNA (mRNA) expression analysis to
                  identify differentially expressed genes (DEGs). The intersection of the downregulated miRNA targets and
                  the upregulated mRNAs were used for Gene Ontology (GO) enrichment analysis, and survival risk was
                  assessed using data from The Cancer Genome Atlas (TCGA).
                  Results: There were 35 common genes, of which, based on GO enrichment, most were related to the
                  cardiac muscle cell action. Four genes showed significant association with the estimated half-maximal
                  inhibitory concentration (IC50) of paclitaxel: bone morphogenetic protein 1 (BMP1), dumbbell former 4
                  protein (DBF4), angiogenin (ANG), and MAP7 domain containing 2 (MAP7D2). Four risk factors (MP1,
                  HIP1, ANG, and MAP7D2) were selected to generate a signature using least absolute shrinkage and selection
                  operator (LASSO) regression. Protein-protein interaction (PPI) analysis showed guanine nucleotide-binding
                  protein subunit beta 4 (GNB4), calcium voltage-gated channel auxiliary subunit beta 2 (CACNB2), and
                  sodium voltage-gated channel alpha subunit 1 (SCN1A) were located at key positions of the network. Among
                  potential risk genes, only the high expression of dedicator of cytokinesis 8 (DOCK8) was associated with
                  poorer survival.
                  Conclusions: The 35 oncogenes may be involved in mechanisms of chemotherapy resistance in ESCC,
                  as well as the corresponding enrichment and regulatory network. The signature containing 4 key risk genes
                  merits further investigation and may provide a deeper understanding of the molecular mechanisms in ESCC
                  treatment failure.

                  Keywords: Esophageal squamous cell carcinoma (ESCC); microRNA (miRNA); chemotherapy resistance;
                  oncogene; bioinformatics analysis

^ ORCID: 0000-0001-6531-6581.

© Annals of Translational Medicine. All rights reserved.                    Ann Transl Med 2022;10(2):92 | https://dx.doi.org/10.21037/atm-21-7032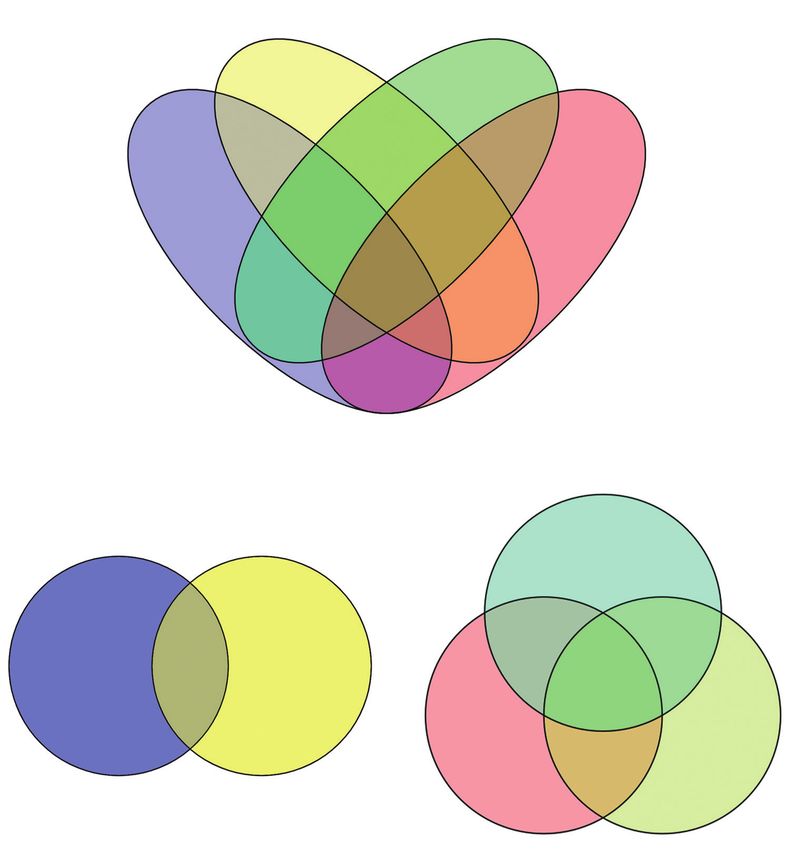
Page 2 of 12                                                                                          Xie et al. Drug resistance of esophageal cancer

                  Submitted Nov 30, 2021. Accepted for publication Jan 20, 2022.
                  doi: 10.21037/atm-21-7032
                  View this article at: https://dx.doi.org/10.21037/atm-21-7032

Introduction                                                                         with chemotherapy resistance and the effectiveness of
                                                                                     chemotherapy. Therefore, we aimed to seek associations
Esophageal cancer is one of the most common cancers
                                                                                     between miRNA/mRNA expression and chemotherapy
worldwide, and with a 5-year survival rate less than 25%,
                                                                                     resistance in ESCC cell lines. In addition, we assessed the
is a leading cause of cancer-related deaths (1). Esophageal
                                                                                     risk of potential oncogenes associated with chemotherapy
squamous cell carcinoma (ESCC), a malignancy of
                                                                                     resistance on survival in ESCC patients. Herein, we
esophageal epithelial cells, accounts for around 90% of
                                                                                     combined two datasets of the Gene Expression Omnibus
esophageal cancer cases (2). In clinical practice, surgery
                                                                                     (GEO) database and identified some novel and important
remains the best choice for esophageal cancer treatment (3).
                                                                                     cancer-promoting genes.
However, compared with surgery alone, chemotherapeutic
                                                                                        We present the following article in accordance with
approaches have demonstrated a survival advantage for
                                                                                     the STREGA reporting checklist (available at https://atm.
patients undergoing either neoadjuvant chemotherapy or
                                                                                     amegroups.com/article/view/10.21037/atm-21-7032/rc).
combined chemoradiotherapy treatment before surgery.
Cisplatin and paclitaxel are two chemotherapeutic agents
frequently used alone or in combination with surgery.                                Methods
Although the overall effect of chemotherapy is considerable
                                                                                     Microarray data
and it has been widely used, many patients respond poorly
to chemotherapy or eventually develop chemotherapy                                   We searched all gene expression data associated with
resistance. Chemoradiotherapy resistance (in particular,                             chemotherapy resistance in ESCC using samples from the
towards cisplatin and paclitaxel) and cancer relapse are                             GEO database (http://www.ncbi.nlm.nih.gov/geo/). The
among the most difficult issues in ESCC treatment (4,5).                             inclusion criteria were as follows: (I) the samples were human
Thus, novel therapies developed with the aid of molecular                            ESCC cells or tissues; (II) mRNA or miRNA expression
biomarkers are urgently needed to prevent resistance                                 profiling was included; and (III) there were chemotherapy
of ESCC. Therefore, it is important to discover novel                                resistance samples as well as wild-type control.
molecular biomarkers associated with chemotherapy                                       There were two available arrays with chemotherapy-
resistance so as to predict the effectiveness of chemotherapy.                       resistant ESCC samples: GSE86099 (gene expression
There are some methods for screening tumor markers                                   signature of paclitaxel resistance in human ESCC cell
i n c l u d e r a d i o i m m u n o a s s a y, c h e m i l u m i n e s c e n c e     lines) and GSE50224 (the expression profiling of miRNA
immunoassay, enzyme-linked immunosorbent assay,                                      from chemotherapy-resistant esophageal adenosquamous
immunosensor, proteomics, polymerase chain reaction                                  carcinoma cell line). The first dataset, GSE86099, used
(PCR), fluorescence in situ hybridization (FISH), single                             parental and paclitaxel resistant cell lines and studied
strand conformation polymorphism (SSCP), liquid biopsy                               mRNA transcription levels by microarray analysis to explore
and so on.                                                                           the key molecules for developing paclitaxel resistance. The
    To discover useful and novel cancer-promoting genes                              second dataset, GSE50224, A global miRNA expression
related to chemotherapy resistance in ESCC, microRNA                                 program for potential chemoresistance is described in detail,
(miRNA) and messenger RNA (mRNA) expression patterns                                 which identifies different classes of upregulated miRNAs in
of the resistant ESCC strains can be probed. Theoretically,                          the generated chemoresistant cell lines. We only used the
when a suspected miRNA and its potential targets reverse                             ESCC cell line (KYSE410) in this dataset. The study was
directions under chemotherapy stress, they are possibly                              conducted in accordance with the Declaration of Helsinki
involved in the process of resistance development. In other                          (as revised in 2013).
cancer types, miRNA expression has been shown to exert
an impact on the response to chemotherapy (6-9), but
                                                                                     Differentially expressed genes (DEGs)
few studies have reported on resistance in ESCC. Herein,
we focus on the novel molecular biomarkers associated                                MRNA and miRNA expression profiles were analyzed for

© Annals of Translational Medicine. All rights reserved.                           Ann Transl Med 2022;10(2):92 | https://dx.doi.org/10.21037/atm-21-7032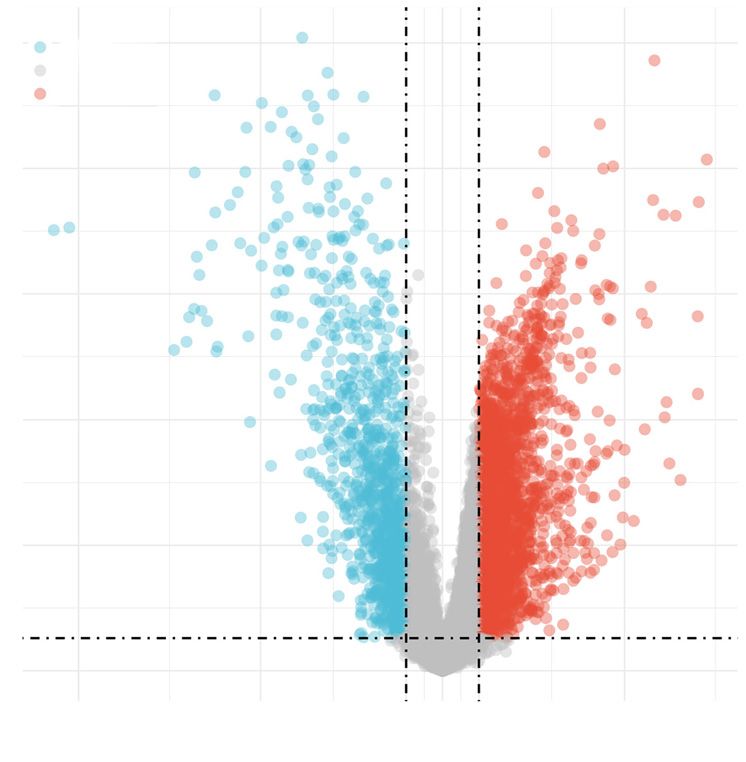
Annals of Translational Medicine, Vol 10, No 2 January 2022                                                             Page 3 of 12

DEGs. Expression data were imported into the DEGseq               regression was performed to identify relevant risk genes,
package in R to compare expression differences between            using 10-fold cross-validation, and the prognostic predictive
samples. The fold change and adjusted P value were                signature, using the R software package glmnet (v 4.1-1).
obtained for each transcript. Based on the threshold of           Raw counts of RNA-sequencing data and corresponding
adjusted P2 or 1.5 or
Page 4 of 12                                                                                      Xie et al. Drug resistance of esophageal cancer

      A                  14                                                      ESCC patients were screened out to draw a KM survival
                                                                                 curve.
                         12

                         10
      −Log10 (P value)

                                                                                 Statistical analysis
                          8
                                                                                 Statistical analysis using R software (R: Language and
                          6
                                                                                 Environment for Statistical Computing, R Core Team, R
                          4                                                      Foundation for Statistical Computing, Vienna, Austria,
                          2   Padj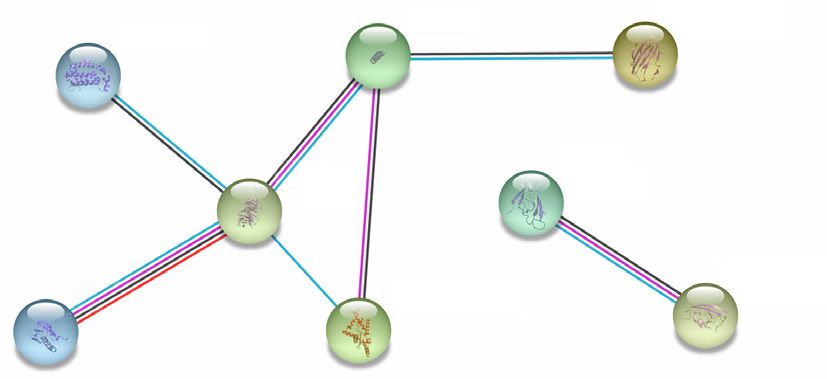
Annals of Translational Medicine, Vol 10, No 2 January 2022                                                                                 Page 5 of 12

                      A                              hsa-miR-18a-3p                      hsa-miR-1226-3p

                                                               2460                          2366

                                                         762                  1432                   277

                                              1401                                                             533
                                                                  711                       275

                                                                              173
                                                           687                                    293

                                                                        120           132

                                                                              157
                                           hsa-miR-935                                                  hsa-miR-99b-5p

                      B                                                                       C            Paclitaxel resistance

                           miRNA targets               Up mRNAs
                                                                                                                     209

                                                                                                        88                     4
                                138           35           2640
                                                                                                                      5

                                                                                              3333                                 436

                                                                                                                     104

                                                                                                        DEG                Prognosis

Figure 2 miRNA and their targets analysis. (A) Intersection analysis of all targets of 4 DE miRNAs; (B) the intersection of common targets
and all upregulated mRNAs; (C) genes associated with paclitaxel resistance, DEG, and prognosis differentially expressed. DE, differentially
expressed; DEG, differentially expressed genes.

related to chemotherapy resistance in ESCC. These 35                                  and the 3,530 DEGs from TCGA, a Venn diagram was
genes were: NEK1, KALRN, SCN4B, SATB1, IGF2, GJC1,                                    generated. The Venn diagram found 5 genes shared by the
SHANK2, EYA1, DOCK8, PTPRD, RBM23, CACNB2,                                            3 sets: bone morphogenetic protein 1 (BMP1), dumbbell
GNB4, ZBED9, AKT2, NKAIN1, DLG2, GPR161, SCN1A,                                       former 4 protein (DBF4), huntingtin-interacting protein 1
PDE4DIP, FAT2, ZBTB20, TCF4, STARD4, DCLK1,                                           (HIP1), angiogenin (ANG), and MAP7 domain containing
TIGIT, PPP1R9A, MRO, OSBPL1A, CIART, SLC39A14,                                        2 (MAP7D2) (Figure 2C). These 5 genes were essential
CMKLR1, USH2A, HIF3A, and ZNF235.                                                     ESCC-associated genes involved in both chemotherapy
                                                                                      resistance and survival.

ESCC survival-associated genes and interaction analysis
                                                                                      Correlation between paclitaxel sensitivity prediction and 5
There were 549 genes in the whole genome associated
                                                                                      common genes
with the prognosis of ESCC, and together with the
306 essential genes associated with paclitaxel resistance                             The estimated paclitaxel IC 50 of the 82 TCGA-ESCA

© Annals of Translational Medicine. All rights reserved.                            Ann Transl Med 2022;10(2):92 | https://dx.doi.org/10.21037/atm-21-7032
Page 6 of 12 Xie et al. Drug resistance of esophageal cancer
A Log (S)=11.14, P=0.024, ρ̂ spearman =0.25, B Log (S)=11.70, P=0.004, ρ̂ spearman =−0.31,
CI95% [0.03, 0.45], npairs =82 CI95% [−0.50, −0.09], npairs =82
−2.5 −2.5
−3.0
Paclitaxel IC50
−3.0
Paclitaxel IC50
−3.5 −3.5
−4.0 −4.0
1 2 3 4 4 5 6 7
Log2 (ANG expression) Log2 (BMP1 expression)
C Log (S)=11.68, P=0.010, ρ̂ spearman =−0.28,
CI95% [−0.47, −0.06], npairs =82
D Log (S)=11.03, P=0.003, ρ̂ spearman =0.33,
CI95% [0.11, 0.51], npairs =82
−2.5 −2.5
−3.0 −3.0
Paclitaxel IC50
Paclitaxel IC50
−3.5 −3.5
−4.0 −4.0
2 3 4 5 6 7 0 2 4 6
Log2 (DBF4 expression) Log2 (MAP7D2 expression)
Figure 3 Correlation between paclitaxel sensitivity prediction and 4 key risk genes. For all 82 TCGA-ESCA samples, the estimated
paclitaxel IC50 of each sample and the above 5 genes were paired for correlation analysis. Four genes have significant association with the
estimated IC50 of paclitaxel: (A) ANG, (B) BMP1, (C) DBF4, and (D) MAP7D2. TCGA, The Cancer Genome Atlas; ESCA, esophageal
carcinoma.
samples and the above 5 genes were paired for correlation ANG, and MAP7D2) were selected to construct a risk score
analysis. Four genes showed significant association with using LASSO regression (Figure 4B), after dimensions were
the estimated IC50 of paclitaxel: BMP1, DBF4, ANG, and reduced (Figure 4C). Patients were divided into a high-risk
MAP7D2 (Figure 3A-3D). group and low-risk group. KM survival analysis showed a
significant difference in survival between the two groups
(median survival period: 1.5 and 3.7 years, respectively;
Prognostic performance of the signature
Figure 4D). This signature showed satisfactory performance
The prognostic performance of the risk-gene signature in 1-, 2-, and 3-year survival prediction as shown by the area
was showed (Figure 4A). Four risk factors (MP1, HIP1, under the curve (AUC) of the ROC curve (Figure 4E). In
© Annals of Translational Medicine. All rights reserved. Ann Transl Med 2022;10(2):92 | https://dx.doi.org/10.21037/atm-21-7032Annals of Translational Medicine, Vol 10, No 2 January 2022 Page 7 of 12
A 0 4 4 5 5 B 5 5 5 5 5 5 5 4 4 4 4 4 4 4 4 1
Partial likelihood deviance
0.8 ANG 9.5
0.6
Coefficients
0.4 9.0
MAP7D2
0.2
DBF4
8.5
0.0
−0.2 HIP1 8.0
BMP1
−0.4
0.0 0.5 1.0 1.5 2.0 −6 −5 −4 −3 −2
L1 norm Log (λ)
C Risk type D
1.00
High risk
Overall survival probability
0.5 Groups = high groups
Low risk Groups = low groups
0.75
Risk score
0.0
−0.5 0.50
−0.1 0.25
0.00 Median time: 1.5 and 3.7
Staus
Groups = high groups 41 26 3 1 0 0 0
Alive Groups = low groups 41 34 12 4 2 1 0
Dead
4 0 1 2 3 4 5 6
Time, years
Time
E
2
1.00
True positive fraction
0 0.75
0.50
HIP1
ANG
0.25 Type
MAP7D2 1 year, AUC =0.754, 95 % CI (0.649-0.859)
2 years, AUC =0.856, 95 % CI (0.742-0.969)
BMP1
0.00 3 years, AUC =0.817, 95 % CI (0.545-1.089)
0.00 0.25 0.50 0.75 1.00
Z-score of expression
False positive fraction
−2−1 0 1 2
Figure 4 The prognostic performance of the risk-gene signature. (A) Coefficients of selected genes are shown by lambda parameter; (B)
partial likelihood deviance versus log (λ) was drawn using LASSO Cox regression model; (C) prognostic analysis of gene characteristics in
the TCGA set. The dotted line represents the median risk score and divides patients into low-risk and high-risk groups. Risk score curve.
Survival status of patients. Higher patient mortality was associated with a higher risk score. Heatmap of prognostic gene expression profiles
in low-risk and high-risk groups; (D) Kaplan-Meyer survival analysis of gene characteristics; (E) time-dependent ROC analysis the of the
gene characteristics. TCGA, The Cancer Genome Atlas; ROC, receiver operating characteristic.
particular, the AUC value for the 2-year survival evaluation promoting genes related to chemotherapy resistance as
was 0.856 (95% CI: 0.742−0.969). DE miRNA targets. Nine GO terms were significantly
enriched, including AV node cell to bundle of His cell
communication, cardiac muscle cell action potential
Enrichment analysis
involved in contraction, dendrite morphogenesis, cardiac
Enrichment analysis was conducted based on the 35 cancer- muscle cell contraction, cardiac muscle cell action potential,
© Annals of Translational Medicine. All rights reserved. Ann Transl Med 2022;10(2):92 | https://dx.doi.org/10.21037/atm-21-7032Page 8 of 12 Xie et al. Drug resistance of esophageal cancer
AV node cell to bundle of His cell communic...
Cell-cell signaling involved in cardiac conduct...
Cardiac muscle cell action potential involved i...
Cardiac muscle cell contraction
Cardiac muscle cell action potential
Positive regulation of dendrite development
Dendrite morphogenesis
Postsynapse organization
Regulation of membrane potential
0 20 40 60 80 100 120 140 160
Enrichment ratio
Figure 5 GO enrichment analysis of 35 cancer-promoting genes related to chemotherapy resistance and DE miRNA targets. Nine GO
terms were significantly enriched, including AV node cell to bundle of His cell communication, cardiac muscle cell action potential involved
in contraction, dendrite morphogenesis, cardiac muscle cell contraction, cardiac muscle cell action potential, positive regulation of dendrite
development, regulation of membrane potential, post-synapse organization, and cell-cell signaling involved in cardiac conduction. GO,
Gene Ontology; DE, differentially expressed; AV, atrioventricular.
KALRN SCN1A SCN4B Survival risk of DOCK8 in ESCC patients
Finally, we analyzed the influence of 35 key oncogenes
GNB4 DLG2 on survival using TCGA data of 82 ESCC cases (https://
cdn.amegroups.cn/static/public/10.21037atm-21-7032-2.
AKT2 CACNB2 SHANK2
xlsx). Among these potentially risk genes, we found only
DOCK8 had a correlation with overall survival, and high
expression of DOCK8 also implied poorer survival time
Figure 6 The PPI network of 35 key oncogenes. PPI, protein- (Figure 7). The median survival of the low-DOCK8 group
protein interaction. was 1,361 days (95% CI: 754–1,968 days), while that of the
high-DOCK8 group was 650 days (95% CI: 499–801 days)
(logrank P=0.02). There were no correlations between the
positive regulation of dendrite development, regulation of 4 miRNAs and survival in ESCC patients. Taken together,
membrane potential, post-synapse organization, and cell- DOCK8 should be considered a preferred gene for detecting
cell signaling involved in cardiac conduction (Figure 5). the underlying mechanisms of chemotherapy resistance.
Among 35 key oncogenes, only 1 factor (DOCK8) was
found to be a survival risk gene, implying that the influence
PPI network
and deep network of oncogenes under chemotherapy stress
A PPI network was generated using the STRING database. is more complicated.
As shown in Figure 6, guanine nucleotide-binding protein
subunit beta 4 (GNB4), calcium voltage-gated channel
Discussion
auxiliary subunit beta 2 (CACNB2), and sodium voltage-
gated channel alpha subunit 1 (SCN1A) were located at The mRNAs and miRNAs associated with ESCC
key positions of the network. PPI analysis showed GNB4, development have been widely studied through high-
CACNB2, and SCN1A were located at key positions of throughput approaches, and known ESCC-related miRNAs
the network. Among potential risk genes, only the high include miR-196a-5p, miR-1-3p, miRNA-134, miR-135b-5p,
expression of dedicator of cytokinesis 8 (DOCK8) was miR-15b-5p, miR-195-5p, miR-124, miRNA-1290, miRNA-
associated with poorer survival. GNB4, CACNB2, SCN1A 20b-5p, miR-885-5p, miR-140-3p, miR-708, miR-639, miR-
and DOCK8 have different effects on the formation of 596, miRNA-506, and miR-338-5p (10-16). In addition,
tumor chemotherapy resistance microenvironment. These hundreds of ESCC-driving mRNAs have been reported.
nodes merit more attention in future research of ESCC However, the key genes associated with chemotherapy-
progression and treatment. resistance in ESCC are not fully understood. Several
© Annals of Translational Medicine. All rights reserved. Ann Transl Med 2022;10(2):92 | https://dx.doi.org/10.21037/atm-21-7032Annals of Translational Medicine, Vol 10, No 2 January 2022 Page 9 of 12
1.0 DOCK8 In prognosis analysis using the 4-risk factor signature
Low
High (BMP1, HIP1, ANG, and MAP7D2), we observed a good
Low-censored
0.8 High-censored performance, especially in 2-year survival prediction. BMP1
is capable of inducing formation of cartilage in vivo and
Cum survival
0.6 is associated with osteogenesis imperfecta and high bone
mass osteogenesis imperfecta. Among its related pathways
0.4
are activation of cyclic adenosine monophosphate (cAMP)-
dependent protein kinase A (PKA) and adipogenesis.
0.2
A previous study on the immune genes associated with
0.0 Log rank (Mantel-Cox) P=0.022
prognosis in esophageal carcinoma also reported that BMP1
was a risk gene in esophageal carcinoma (24). HIP1 is a
0 500 1000 1500 2000 2500
Survival time, day membrane-associated protein that functions in clathrin-
mediated endocytosis and protein trafficking within the
Percentiles 25% 50% 75% cell. Recently, it was reported that abnormally high HIP1
Low Not availabre 1,361±309.6 764±279.5
expression was associated with metastatic behaviors and
High 855±77.3 650±76.8 484±93.8 poor prognosis in ESCC (25). ANG is a member of the
Overall 1,458±114.3 855±248.6 557±91.2 ribonuclease (RNase) A superfamily and is associated
with amyotrophic lateral sclerosis and amyotrophic lateral
Figure 7 The influence of DOCK8 on survival based on TCGA
sclerosis. Among its related pathways are cell junction
data. A total of 83 ESCC cases were collected. A high expression of
organization and pathways of neurodegeneration. One
DOCK8 implies poorer survival. DOCK8, dedicator of cytokinesis 8;
study reported, consistent with our results, that all-trans
TCGA, The Cancer Genome Atlas; ESCC, esophageal squamous
retinoic acid (ATRA) inhibited angiogenesis and metastasis
cell carcinoma.
of ESCC by suppressing the ANG-Tie2 pathway (26).
MAP7D2 is a relatively novel risk gene in carcinoma. An
integrated bioinformatics analysis showed that MAP7D2
published works have demonstrated that this resistance
was a prognostic biomarker of gastric cancer (27), and it
could be affected by both mRNAs, including taurine
may contribute to the progression of ESCC through a
upregulated 1 (TUG1), zinc finger protein x-linked (ZFX),
similar mechanism.
and nuclear factor-erythroid factor 2-related factor 2 (Nrf2),
DOCK8 is a member of the DOCK family of guanine
and miRNAs, such as miR-130a-3p, miR-148a-3p, miR-
nucleotide exchange factors, which interact with Rho
125a-5p, and miR-224 (17-21). Herein, we discovered that
GTPases and are components of intracellular signaling
hsa-miR-18a-3p, hsa-miR-935, hsa-miR-1226-3p, and hsa-
networks. In patients with human papillomavirus (HPV)-
miR-99b-5p were downregulated in resistant ESCC cells,
positive head and neck squamous cell carcinoma, DOCK8
and for the first time, that some novel targets, including
can serve as a prognostic biomarker and is related to
DOCK8, GNB4, CACNB2, and SCN1A, were possibly
immune infiltration (28). In 2008, a Japanese study
highly involved in ESCC chemotherapy resistance. To reported that DOCK8 was an upregulated gene involved
the best of our knowledge, these results, particularly in radiosensitivity of ESCC (29). The specific mechanism
of the key mRNAs, have not been reported in previous of DOCK8 towards the stress of chemotherapeutic drugs
ESCC studies. Although there appear to be discrepancies is largely unknown. Notably, mutations of DOCK8 are
between our results and the original article of some associated with immunodeficiency (30,31). Expression
data (e.g., GSE50224), this was mainly due to the use of levels of DOCK8 were reduced in 87% of primary lung
different grouping methods. For example, we combined cancers in comparison with normal lung tissue (32). These
all chemotherapy-resistant esophageal cancer cells into results appeared to be the exact opposite of our findings.
the resistant group. SCN1A is a neuronal sodium-channel In hepatocellular carcinoma, DOCK8 is a downstream
gene and is associated with different nervous-system related member of signal transducer and activator of transcription
disorders, as shown in the enrichment results in DisGeNET 3 (STAT3) and can play a role as a guanine-nucleotide
(22,23). Currently, this is the first study reporting that exchanging factor for Rac Family Small GTPase 1 (RAC1),
SCN1A may be an important ESCC driver. which drives mesenchymal-type movement (33). Moreover,
© Annals of Translational Medicine. All rights reserved. Ann Transl Med 2022;10(2):92 | https://dx.doi.org/10.21037/atm-21-7032Page 10 of 12 Xie et al. Drug resistance of esophageal cancer
DOCK family proteins are involved in the regulation of complicated. In addition, we did not perform verification
migration, morphology, adhesion, and cell growth (32), of the expression of DE mRNA and miRNA, the protein
suggesting that they may enhance the migration ability of expression of the corresponding mRNAs, or their matched
ESCC cells under the stress of chemotherapy. Given the targeting relationships. We have hardly analyzed lncRNA
increased expression of DOCK8 in resistant ESCC cells and ceRNA network which will be carried out in the next
and its association with poorer survival, we believe that its research work. The functions of the key genes have not
molecular action mechanism in ESCC merits urgent further been verified by experiments. This step is exceedingly
exploration. GNB4 is also a hub gene in ovarian cancer and necessary for deeper exploration. Finally, the number of
Helicobacter pylori-induced gastric cancer (34,35), but ESCC cases in TCGA was limited, and the phenotype
its detailed mechanism in tumor development is largely dimension was not sufficient. Therefore, patients with
unknown. The association between CACNB2 and squamous different stages and treatments were pooled together for
cell carcinoma (SCC) was reported by another miRNA analysis. This may have led to the negative results of most
study regarding head and neck SCC (36), which found that candidate oncogenes.
the tumor suppressor miR-31-5p targeted CACNB2 and
affected prognosis.
Conclusions
The authors of dataset GSE50224 published 2 similar
articles regarding the 4 downregulated miRNAs, with In conclusion, we combined miRNA and mRNA changes
consistent results (37,38), and another study reported that and found 35 key oncogenes involved in chemotherapy
miR-1226-3p could sensitize ESCC towards cisplatin in resistance in ESCC, as well as the corresponding
50% of cell lines (19). However, other supporting evidence enrichment and regulatory network. The novel candidates
is limited. Therefore, miR-18a-3p, hsa-miR-935, and hsa- in this study merit further investigation and may provide
miR-99b-5p in ESCC is worthy of more attention. a deeper understanding of the molecular mechanisms in
Some upregulated mRNAs seemed contradictory to ESCC treatment failure.
previous studies. For example, NK6 Homeobox 1 (NKX61)
has been reported as a suppressor of metastasis in colorectal
Acknowledgments
cancer (39). This inconsistency can be explained by the fact
that the role of NKX61 in ESCC and colorectal cancer may Funding: This study was sponsored by Clinical Medicine
differ. Further, we cannot confirm that the upregulated Plus Technology Project from Shanghai Jiaotong University
targets were a driver of chemotherapy resistance as this may School of Medicine and Shanghai Key Laboratory
have been a concomitant phenomenon, albeit with a high of Nucleic Acid Chemistry & Nanomedicine (No.
probability of being a driving factor. 2021ZYA008).
Radiotherapy combined with cisplatin and taxol
chemotherapy can improve the immune function of patients
Footnote
with esophageal cancer. In the training and validation
cohort, the down-regulation of NS1-BP is related to Reporting Checklist: The authors have completed the
chemoradiotherapy resistance and short disease-specific STREGA reporting checklist. Available at https://atm.
survival (DSS). Both synchronous radiotherapy and pure amegroups.com/article/view/10.21037/atm-21-7032/rc
radiotherapy are appropriate. Improving the immune
function of patients can promote progress, increase T Conflicts of Interest: All authors have completed the
lymphocyte, inhibitory T-cells, helper T cells and Th/Ts ICMJE uniform disclosure form (available at https://atm.
levels of patients, lower the Ts level and lower the tumor amegroups.com/article/view/10.21037/atm-21-7032/coif).
index. The level of SCC-Ag and CYFRA21-1 should The authors have no conflicts of interest to declare.
be kept at the same time, and chemotherapy should be
performed simultaneously. Ethical Statement: The authors are accountable for all
This study had some limitations. First, of the 35 key aspects of the work in ensuring that questions related
oncogenes, only 1 factor (DOCK8) was found to be a to the accuracy or integrity of any part of the work are
survival risk gene, implying that the influence and deep appropriately investigated and resolved. The study was
network of oncogenes under chemotherapy stress is more conducted in accordance with the Declaration of Helsinki (as
© Annals of Translational Medicine. All rights reserved. Ann Transl Med 2022;10(2):92 | https://dx.doi.org/10.21037/atm-21-7032Annals of Translational Medicine, Vol 10, No 2 January 2022 Page 11 of 12
revised in 2013). 2019;79:3608-21.
10. Sang C, Chao C, Wang M, et al. Identification
Open Access Statement: This is an Open Access article and validation of hub microRNAs dysregulated in
distributed in accordance with the Creative Commons esophageal squamous cell carcinoma. Aging (Albany NY)
Attribution-NonCommercial-NoDerivs 4.0 International 2020;12:9807-24.
License (CC BY-NC-ND 4.0), which permits the non- 11. Li CY, Zhang WW, Xiang JL, et al. Identification of
commercial replication and distribution of the article with microRNAs as novel biomarkers for esophageal squamous
the strict proviso that no changes or edits are made and cell carcinoma: a study based on The Cancer Genome
the original work is properly cited (including links to both Atlas (TCGA) and bioinformatics. Chin Med J (Engl)
the formal publication through the relevant DOI and the 2019;132:2213-22.
license). See: https://creativecommons.org/licenses/by-nc- 12. Yang H, Su H, Hu N, et al. Integrated analysis of genome-
nd/4.0/. wide miRNAs and targeted gene expression in esophageal
squamous cell carcinoma (ESCC) and relation to
prognosis. BMC Cancer 2020;20:388.
References
13. Sun H, Wang L, Zhao Q, et al. Diagnostic and prognostic
1. Then EO, Lopez M, Saleem S, et al. Esophageal Cancer: value of serum miRNA-1290 in human esophageal
An Updated Surveillance Epidemiology and End Results squamous cell carcinoma. Cancer Biomark 2019;25:381-7.
Database Analysis. World J Oncol 2020;11:55-64. 14. Yu J, Chen S, Niu Y, et al. Functional Significance and
2. Zeng RJ, Zheng CW, Gu JE, et al. RAC1 inhibition Therapeutic Potential of miRNA-20b-5p in Esophageal
reverses cisplatin resistance in esophageal squamous cell Squamous Cell Carcinoma. Mol Ther Nucleic Acids
carcinoma and induces downregulation of glycolytic 2020;21:315-31.
enzymes. Mol Oncol 2019;13:2010-30. 15. Li SP, Su HX, Zhao D, et al. Plasma miRNA-506 as a
3. Allum WH, Bonavina L, Cassivi SD, et al. Surgical Prognostic Biomarker for Esophageal Squamous Cell
treatments for esophageal cancers. Ann N Y Acad Sci Carcinoma. Med Sci Monit 2016;22:2195-201.
2014;1325:242-68. 16. Cui D, Zhu Y, Yan D, et al. Dual inhibition of cMET
4. Zhou C, Zhang L, Xu P. Growth inhibition and chemo- and EGFR by microRNA-338-5p suppresses metastasis
radiosensitization of esophageal squamous cell carcinoma of esophageal squamous cell carcinoma. Carcinogenesis
by survivin-shRNA lentivirus transfection. Oncol Lett 2021;42:995-1007.
2018;16:4813-20. 17. Jiang L, Wang W, Li G, et al. High TUG1 expression
5. Ou Y, Ma L, Ma L, et al. Overexpression of cyclin B1 is associated with chemotherapy resistance and poor
antagonizes chemotherapeutic-induced apoptosis through prognosis in esophageal squamous cell carcinoma. Cancer
PTEN/Akt pathway in human esophageal squamous cell Chemother Pharmacol 2016;78:333-9.
carcinoma cells. Cancer Biol Ther 2013;14:45-55. 18. Wu J, Zhou Y, Wang T, et al. ZFX promotes tumorigenesis
6. To KK, Tong CW, Wu M, et al. MicroRNAs in the and confers chemotherapy resistance in esophageal
prognosis and therapy of colorectal cancer: From bench to squamous cell carcinoma. Clin Res Hepatol Gastroenterol
bedside. World J Gastroenterol 2018;24:2949-73. 2021;45:101586.
7. Feng Y, Zhong M, Zeng S, et al. Exosome-derived 19. Lindner K, Eichelmann AK, Matuszcak C, et al. Complex
miRNAs as predictive biomarkers for diffuse large B-cell Epigenetic Regulation of Chemotherapy Resistance and
lymphoma chemotherapy resistance. Epigenomics Biohlogy in Esophageal Squamous Cell Carcinoma via
2019;11:35-51. MicroRNAs. Int J Mol Sci 2018;19:499.
8. Jayaraj R, Nayagam SG, Kar A, et al. Clinical Theragnostic 20. Chang ZW, Jia YX, Zhang WJ, et al. LncRNA-TUSC7/
Relationship between Drug-Resistance Specific miRNA miR-224 affected chemotherapy resistance of esophageal
Expressions, Chemotherapeutic Resistance, and Sensitivity squamous cell carcinoma by competitively regulating
in Breast Cancer: A Systematic Review and Meta-Analysis. DESC1. J Exp Clin Cancer Res 2018;37:56.
Cells 2019;8:1250. 21. Zhang Z, Xiong R, Li C, et al. LncRNA TUG1 promotes
9. Shen M, Dong C, Ruan X, et al. Chemotherapy- cisplatin resistance in esophageal squamous cell carcinoma
Induced Extracellular Vesicle miRNAs Promote Breast cells by regulating Nrf2. Acta Biochim Biophys Sin
Cancer Stemness by Targeting ONECUT2. Cancer Res (Shanghai) 2019;51:826-33.
© Annals of Translational Medicine. All rights reserved. Ann Transl Med 2022;10(2):92 | https://dx.doi.org/10.21037/atm-21-7032Page 12 of 12 Xie et al. Drug resistance of esophageal cancer
22. Weale ME, Depondt C, Macdonald SJ, et al. Selection DOCK2. Dermatol Clin 2017;35:11-9.
and evaluation of tagging SNPs in the neuronal- 31. Zhang Q, Davis JC, Lamborn IT, et al. Combined
sodium-channel gene SCN1A: implications for linkage- immunodeficiency associated with DOCK8 mutations. N
disequilibrium gene mapping. Am J Hum Genet Engl J Med 2009;361:2046-55.
2003;73:551-65. 32. Takahashi K, Kohno T, Ajima R, et al. Homozygous
23. Das A, Zhu B, Xie Y, et al. Interneuron Dysfunction deletion and reduced expression of the DOCK8 gene in
in a New Mouse Model of SCN1A GEFS. eNeuro human lung cancer. Int J Oncol 2006;28:321-8.
2021;8:ENEURO. 33. Wang SJ, Cui HY, Liu YM, et al. CD147 promotes Src-
24. Fei Z, Xie R, Chen Z, et al. Establishment of a Novel dependent activation of Rac1 signaling through STAT3/
Risk Score System of Immune Genes Associated With DOCK8 during the motility of hepatocellular carcinoma
Prognosis in Esophageal Carcinoma. Front Oncol cells. Oncotarget 2015;6:243-57.
2021;11:625271. 34. Liu D, Ma X, Yang F, et al. Discovery and validation of
25. Sun Y, Zhou Y, Xia J, et al. Abnormally high HIP1 methylated-differentially expressed genes in Helicobacter
expression is associated with metastatic behaviors and poor pylori-induced gastric cancer. Cancer Gene Ther
prognosis in ESCC. Oncol Lett 2021;21:79. 2020;27:473-85.
26. Li N, Lu Y, Li D, et al. All-trans retinoic acid suppresses 35. Zhang J, Huang S, Quan L, et al. Determination of
the angiopoietin-Tie2 pathway and inhibits angiogenesis Potential Therapeutic Targets and Prognostic Markers of
and metastasis in esophageal squamous cell carcinoma. Ovarian Cancer by Bioinformatics Analysis. Biomed Res
PLoS One 2017;12:e0174555. Int 2021;2021:8883800.
27. Liu X, Wu J, Zhang D, et al. Identification of Potential 36. Oshima S, Asai S, Seki N, et al. Identification of Tumor
Key Genes Associated With the Pathogenesis and Suppressive Genes Regulated by miR-31-5p and miR-31-
Prognosis of Gastric Cancer Based on Integrated 3p in Head and Neck Squamous Cell Carcinoma. Int J
Bioinformatics Analysis. Front Genet 2018;9:265. Mol Sci 2021;22:6199.
28. Zhang Z, Bao Y, Zhou L, et al. DOCK8 Serves as 37. Hummel R, Wang T, Watson DI, et al. Chemotherapy-
a Prognostic Biomarker and Is Related to Immune induced modification of microRNA expression in
Infiltration in Patients With HPV Positive Head and esophageal cancer. Oncol Rep 2011;26:1011-7.
Neck Squamous Cell Carcinoma. Cancer Control 38. Hummel R, Sie C, Watson DI, et al. MicroRNA signatures
2021;28:10732748211011951. in chemotherapy resistant esophageal cancer cell lines.
29. Ogawa R, Ishiguro H, Kuwabara Y, et al. Identification World J Gastroenterol 2014;20:14904-12.
of candidate genes involved in the radiosensitivity of 39. Chung HH, Lee CT, Hu JM, et al. NKX6.1 represses
esophageal cancer cells by microarray analysis. Dis tumorigenesis, metastasis, and chemoresistance in
Esophagus 2008;21:288-97. colorectal cancer. Int J Mol Sci 2020;21:5106.
30. Dimitrova D, Freeman AF. Current Status of Dedicator of
Cytokinesis-Associated Immunodeficiency: DOCK8 and (English Language Editor: A. Muijlwijk)
Cite this article as: Xie F, Zhang D, Qian X, Wei H, Zhou L,
Ding C, Pan W, Ye Q. Analysis of cancer-promoting genes
related to chemotherapy resistance in esophageal squamous cell
carcinoma. Ann Transl Med 2022;10(2):92. doi: 10.21037/atm-
21-7032
© Annals of Translational Medicine. All rights reserved. Ann Transl Med 2022;10(2):92 | https://dx.doi.org/10.21037/atm-21-7032You can also read