A comprehensive profile of TCF1+ progenitor and TCF1 terminally exhausted PD-1+CD8+ T cells in head and neck squamous cell carcinoma: implications ...
←
→
Page content transcription
If your browser does not render page correctly, please read the page content below
International Journal of Oral Science                                                                                                      www.nature.com/ijos

                  ARTICLE                OPEN

                  A comprehensive profile of TCF1+ progenitor and TCF1−
                  terminally exhausted PD-1+CD8+ T cells in head and neck
                  squamous cell carcinoma: implications for prognosis and
                  immunotherapy
                  Dikan Wang 1, Juan Fang1, Shuqiong Wen1, Qunxing Li1, Jinming Wang1, Lisa Yang1, Wenxiao Dai1, Huanzi Lu1, Junyi Guo1,
                  Zhongyan Shan1, Wenqiang Xie1, Xiangqi Liu1, Liling Wen1, Jie Shen2, Anxun Wang3, Qianming Chen2 and Zhi Wang 1 ✉

                     The heterogeneity of exhausted T cells (Tex) is a critical determinant of immune checkpoint blockade therapy efficacy. However,
                     few studies have explored exhausted T cell subpopulations in human cancers. In the present study, we examined samples from
                     two cohorts of 175 patients with head and neck squamous cell cancer (HNSCC) by multiplex immunohistochemistry (mIHC) to
                     investigate two subsets of Tex, CD8+PD1+TCF1+ progenitor exhausted T cells (TCF1+Texprog) and CD8+PD1+TCF1− terminally
                     exhausted T cells (TCF1−Texterm). Moreover, fresh tumor samples from 34 patients with HNSCC were examined by flow
                     cytometry and immunohistochemistry to further investigate their properties and cytotoxic capabilities and their correlation
1234567890();,:

                     with regulatory T cells (Tregs) in the tumor immune microenvironment (TIME). mIHC and flow cytometry analysis showed that
                     TCF1−Texterm represented a greater proportion of CD8+PD1+Tex than TCF1+Texprog in most patients. TCF1+Texprog produced
                     abundant TNFα, while TCF1−Texterm expressed higher levels of CD103, TIM-3, CTLA-4, and TIGIT. TCF1−Texterm exhibited a
                     polyfunctional TNFα+GZMB+IFNγ+ phenotype; and were associated with better overall survival and recurrence-free survival.
                     The results also indicated that larger proportions of TCF1−Texterm were accompanied by an increase in the proportion of Tregs.
                     Therefore, it was concluded that TCF1−Texterm was the major CD8+PD1+Tex subset in the HNSCC TIME and that these cells
                     favor patient survival. A high proportion of TCF1−Texterm was associated with greater Treg abundance.

                     International Journal of Oral Science (2022)14:8                             ; https://doi.org/10.1038/s41368-022-00160-w

                  INTRODUCTION                                                                        continuous antigen burden.6 The characteristics of exhausted
                  Therapeutic advances in immune checkpoint blockade (ICB)                            T cells are a high expression of inhibitory receptors, reduced
                  therapy have rapidly emerged in the past few years, yielding                        cytotoxic activity, and reduced proliferation potential.6,7
                  gratifying results related to the treatment of several kinds of                     Recently, researchers have made progress in understanding
                  tumors. The programmed death-1 (PD-1)-blocking antibody                             exhausted CD8+ T cells (Tex). Two subpopulations of Tex were
                  nivolumab was the first immune checkpoint inhibitor approved                         found in the TIME, progenitor exhausted T cells (Texprog) and
                  by the United States Food and Drug Administration (FDA) for                         terminally exhausted T cells (Texterm), and these subpopulations
                  metastatic head and neck squamous cell cancer (HNSCC),                              are characterized by distinct epigenetic and transcriptional
                  receiving approval in 2016 on the basis of the results of the                       states.8–11 They are distinguished by the expression of TCF1,
                  CheckMate 141 trial.1 However, due to the complex components                        which is encoded by TCF7 and plays a fundamental role in T cell
                  of the tumor immune microenvironment (TIME), the overall                            development, stemness, and memory formation.12–14 TCF1 was
                  response rates to ICB therapies for HNSCC range from just 19 to                     highly expressed in Texprog cells, but not in Texterm, thus TCF1
                  33%.1–3 The HNSCC TIME is populated by dysfunctional immune                         expression could unambiguously identify Texprog cells.13
                  cells, inhibitory cytokines, and exosomes carrying suppressive                      CD8+PD1+TCF1+ Texprog (TCF1+Texprog) possessed stem-like
                  ligands.4,5 Among all immune cell phenotypes, cytotoxic T cell                      properties and could be differentiated into Texterm but exhibited
                  exhaustion is a hallmark of many cancers and strongly affects                       relatively lower cytotoxicity. CD8+PD1+TCF1− Texterm (TCF1−
                  ICB therapy.                                                                        Texterm) expressed more cytokines and exerted strong antitumor
                     The term “T cell exhaustion”, which was originally derived                       activity. In particular, TCF1+ Texprog were discovered within the
                  from a mouse chronic virus infection model, is now commonly                         tumor region and lymph node and responded preferentially to
                  used to define a dysfunctional status of T cells stimulated by                       checkpoint blockade in melanoma.8,10,15,16

                  1
                   Hospital of Stomatology, Guanghua School of Stomatology, Guangdong Provincial Key Laboratory of Stomatology, Sun Yat-Sen University, Guangzhou, China; 2Hospital of
                  Stomatology, Key Laboratory of Oral Biomedical Research of Zhejiang Province, School of Stomatology, Zhejiang University School of Medicine, Hangzhou, China and
                  3
                   Department of Oral and Maxillofacial Surgery, First Affiliated Hospital, Sun Yat-Sen University, Guangzhou, China
                  Correspondence: Zhi Wang (wangzh75@mail.sysu.edu.cn)
                  These author contributed equally: Dikan Wang, Juan Fang, Shuqiong Wen

                  Received: 12 September 2021 Revised: 20 December 2021 Accepted: 28 December 2021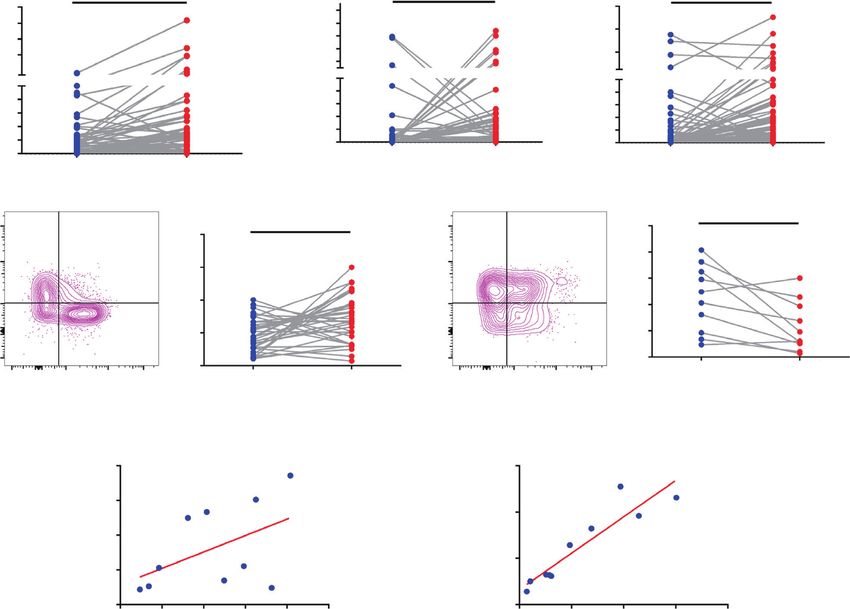
Two subsets of exhauted T cells in HNSCC
Wang et al.
2
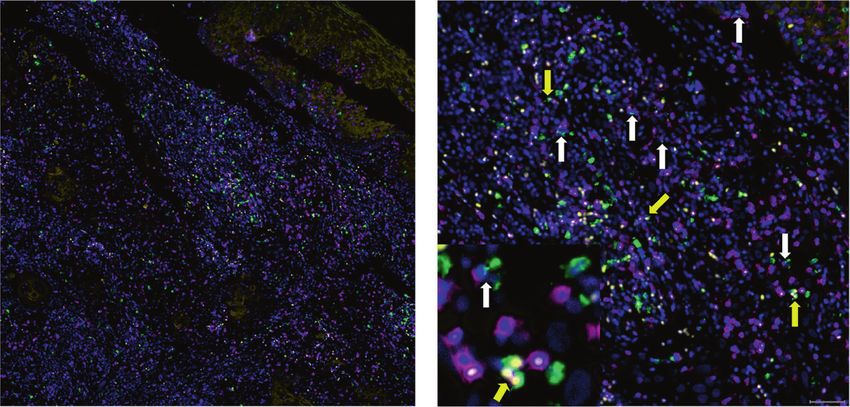
Previous studies on HNSCC focused mostly on whole tumor- TCF1-Texterm conferred better prognosis in HNSCC
infiltrating CD8+ T cells and suggested that the abundance of As CD8+PD-1+TCF1+ Texprog and CD8+PD-1+TCF1− Texterm were
infiltrating CD8+ T cells was associated with better overall survival detected in HNSCC, we investigated their prognostic value in the
(OS).17–19 Further, a subset of CD8+CD103+ tissue-resident Sun Yan-Sen University (SYSU) cohort with 102 patients (patient
memory T cells (TRM) are critical for protective immunity in clinicopathological information is presented in Table S2), based on
HNSCC.20,21 However, previous studies have shown that the the density of these two subsets in the mIHC results. We found
prognostic value of Tex is controversial. In hepatocellular that the abundance of TCF1−Texterm rather than TCF1+Texprog was
carcinoma, PD1hiCD8+ Tex was associated with poor outcomes, associated with better OS (Fig. 2a, b) and recurrence-free survival
whereas in triple-negative breast cancer, they were associated (RFS, Fig. S2a, b). Then, we performed univariate and multivariate
with a better prognosis.22–25 A possible explanation might be that OS analyses of multiple clinicopathological parameters in the
the TIME consists of distinct Tex subsets that exhibit distinct SYSU cohort. The results showed that among these variables,
cytokine production and phenotypic characteristics. Therefore, to nodal invasion, clinical-stage, radiotherapy, and TCF1−Texterm
further understand the heterogeneity and prognostic value of density were favorable for OS in the univariate log-rank test
PD1+CD8+Tex, we aimed to explore the profiles of TCF1+Texprog (Table S3). Then, these variables were entered into multivariate
and TCF1−Texterm in HNSCC. Cox regression analyses. In multivariate analyses, the TCF1−Texterm
In this study, we applied multiplex immunohistochemistry density was an independent prognostic factor for OS (Table 1).
(mIHC) and flow cytometry to investigate the comprehensive To validate the prognostic value of the TCF1−Texterm
profile of TCF1+Texprog and TCF1−Texterm in HNSCC, including population, we further applied a validation cohort with 73
their spatial distribution, prognostic value, cytokine secretion, and patients (Zhejiang University cohort, ZJU cohort, patient
correlation with regulatory T cells (Tregs) in the TIME. We found clinicopathological information is given in Table S2). Consistent
that CD8+PD1+TCF1+ Texprog and CD8+PD1+TCF1− Texterm with the results from the SYSU cohort, a high density of
coexisted in the HNSCC TIME and that the latter was the major TCF1−Texterm also predicted a better OS and RFS in the ZJU
subset. The density of tumor-infiltrating TCF1−Texterm could serve cohort, while there was no statistically significant prognostic
as an independent prognostic indicator in HNSCC. In addition, the difference between patients with high and low densities of
level of infiltrating Tregs increased as the proportion of TCF1+Texprog (Fig. 2c, d, Fig. S2c, d). Univariate and multivariate
TCF1−Texterm became higher. We propose that these findings OS analyses of multiple clinicopathological parameters in the
could provide new strategies and indications for optimal ZJU cohort also demonstrated that the TCF1−Texterm density
immunotherapeutic regimens for HNSCC patients. was indicative of prognosis (Table S3 and Table 1). These results
indicated that TCF1−Texterm density could serve as an indepen-
dent prognostic factor for HNSCC.
RESULTS
TCF1−Texterm was the major PD1+CD8+Tex subset in the HNSCC TCF1+Texprog and TCF1−Texterm exhibited distinct cytokine
TIME production and phenotypic characteristics in HNSCC
A five-color mIHC scheme that included anti-PanCK (brown), anti- Based on the different prognostic values of TCF1+Texprog and
CD8 (red), anti-PD-1 (green), anti-TCF1 (yellow), and DAPI (blue) was TCF1−Texterm, we investigated the cytokine production and
developed to comprehensively profile the spatial distribution of phenotypic profiles of these two subsets in fresh tumors. The
TCF1+Texprog and TCF1−Texterm. In this scheme, CD8+PD-1+TCF1+ production capability of interferon-γ (IFNγ), tumor necrosis factor-
cells represented TCF1+Texprog, and CD8+PD-1+TCF1− cells were α (TNFα), and granzyme B (GZMB) was analyzed. TNF-α, IFN-γ, and
TCF1−Texterm.8 Interestingly, these two subtypes were both GZMB are important cytokines that play a critical role in antitumor
observed in formalin-fixed, paraffin-embedded (FFPE) samples response. However, there are differences in their functions. TNF-α
from HNSCC patients (Fig. 1a). Then, we quantitated the numbers could promote T cell proliferation and survival and GZMB acts as
of these two subtypes by StrataQuest software.26 We found that exocytosis of granule components in the direction of the target
TCF1−Texterm were significantly more abundant than TCF1+Texprog cell, leading to a lethal hit of the target cell. We found that GZMB
in the total tumor region (Fig. 1b). To further analyze the spatial production was significantly higher in CD8+PD-1+TCF1− Texterm
distributions of these subpopulations, we deeply classified the than in CD8+PD-1+TCF1+ Texprog (Fig. 3a, b). However, there was
intratumoral and stromal regions by PanCK staining (Fig. S1a and no significant difference in IFNγ generation between these two
Fig. 1a). The results showed that both TCF1+Texprog and subsets (Fig. 3c). In contrast to the case for GZMB, the production
TCF1−Texterm were significantly enriched in the stroma rather than of TNFα was significantly higher in TCF1+Texprog than in
the intratumoral region (Fig. 1c). In addition, the number of stromal TCF1−Texterm (Fig. 3d). Moreover, TCF1−Texterm showed a higher
TCF1−Texterm was significantly higher than that of stromal proportion of cells with the TNFα+GZMB+IFNγ+ polyfunctional
TCF1+Texprog, but there was no statistical significance in the phenotype (Fig. 3e). It might indicate that highly TNFα-expressing
intratumoral region (Fig. S1b, c). TCF1+ Texprog might associate with its property of proliferation
We further performed flow cytometry to investigate these two and TCF1− Texterm produced higher GZMB, showing a direct
types of PD1+CD8+Tex in 34 fresh HNSCC tumor samples and 10 attack on the tumor cells.
paired draining lymph nodes (dLNs). The clinicopathologic In addition, we evaluated the expression of CD103, T cell
characteristics of HNSCC patients are shown in Table S1. The flow immunoglobulin and mucin-domain containing-3 (TIM-3), cyto-
cytometry gating strategy is displayed in Fig. S1d. We found toxic T lymphocyte antigen 4 (CTLA-4), lymphocyte activation
significantly more CD8+PD-1+TCF1− Texterm than CD8+PD- gene-3 (LAG-3), and T cell immunoglobulin and ITIM domain
1+TCF1+ Texprog in HNSCC tumor samples which were consistent (TIGIT) in these two subsets by flow cytometry. CD103 is a marker
with the mIHC results (Fig. 1d), whereas, in dLN, the proportion of of TRM that binds to E-cadherin on epithelial cells, and TIM-3, CTLA-
TCF1+Texprog was significantly higher than that of TCF1−Texterm 4, LAG-3, and TIGIT function as coinhibitors.5,6 The flow cytometry
(Fig. 1e). We tried to explore the correlation of Tex subsets results revealed that TCF1−Texterm expressed significantly higher
between the tumor and dLN. The results showed that levels of CD103 than that of TCF1+Texprog (Fig. 3f). We also found
TCF1−Texterm in dLNs was positively associated with TCF1−Texterm that the mean fluorescence intensity (MFI) of TIM-3, CTLA-4, and
in tumors, while there was no correlation for TCF1+Texprog (Fig. 1f). TIGIT was stronger in TCF1−Texterm, but there was no significant
All these results indicated that TCF1−Texterm was the major Tex difference in the expression of LAG-3 (Fig. 3g, h). These data
subpopulation in the HNSCC TIME and the proportion of suggested that TCF1+Texprog produced a higher level of TNFα, and
TCF1−Texterm in TIME was correlated with that in dLN. although TCF1−Texterm expressed high levels of immune
International Journal of Oral Science (2022)14:8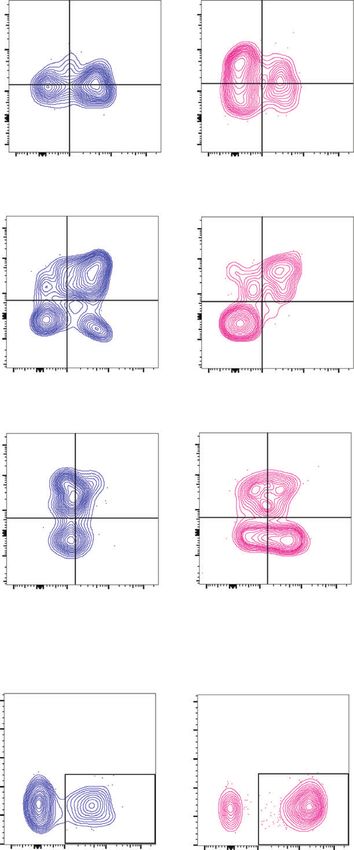
Two subsets of exhauted T cells in HNSCC
Wang et al.
3
a
Intratumoral region
DAPI
PanCK
CD8 Stromal region
PD-1
TCF1 50Pm
b c *
** *
500 140 600
400 120 400
300 100
Cells/mm2
80
Cells/mm2
200
Cells/mm2
200
60
50 50
50 40 40
40 30 30
30 20 20
20 10 10
10 0 0
0 rog rog
+ exp + exp - term - exte
rm
+ prog - term T T ex
TCF1 Tex TCF1 Tex
moral T
CF1
tromal
TCF1 ra l TCF1 T TCF1
T
Intratumo
l
Intratu S Stroma
Percentage of CD8+ T cells in dLN
d Tumor e dLN
Percentage of CD8+ T cells in tumor
*
105
80
** 105 50
TCF1+Texprog TCF1+Texprog
40
104 11.2 60 104 36.3
30
103 40 103 20
0 47.1 20 0 19.4 10
TCF1-Texterm TCF1-Texterm
TCF1
-103 -103 0
TCF1
0
-103 103 104 105 prog - term TCF1+ Texprog TCF1- Texterm
0 TCF1 Tex
+
TCF1 Tex -103 0 103 104 105
PD-1 PD-1
f
(percentage of CD8+ T cells)
(percentage of CD8 T cells)
40 r =0.53, P=0.12 60 r =0.91, P=0.0005
TCF1+ Texprog in tumor
in tumor
30
+
40
term
20
TCF Tex
20
10
-
0 0
0 10 20 30 40 50 0 10 20 30 40
TCF1+ Texprog in dLN TCF Tex
-
in dLN
term
+
(percentage of CD8 T cells) +
(percentage of CD8 T cells)
Fig. 1 CD8+PD-1+TCF1+ progenitor exhausted T cells (TCF1+Texprog) and CD8+PD-1+TCF1− terminally exhausted T cells (TCF1−Texterm) in the
head and neck squamous cell carcinoma (HNSCC) microenvironment. a Representative images of HNSCC multiplex immunohistochemistry
(mIHC) slides showing CD8+PD-1+TCF1+ Texprog (yellow arrow) and CD8+PD-1+TCF1−Texterm (white arrow) cells. b Quantitative analysis
revealed that the density of TCF1−Texterm cells was higher than that of TCF1+Texprog in the whole tumoral region (n = 102). c Quantitative
analysis revealed that progenitor and terminally exhausted T cells were more abundant in the stromal region (n = 102). d Representative
contour plots of TCF1+Texprog and TCF1−Texterm in tumor by flow cytometry and quantitative analysis showed that TCF1−Texterm were more
abundant than TCF1+Texprog in tumors (n = 34). e Representative contour plots of TCF1+Texprog and TCF1−Texterm in draining lymph nodes
(dLNs) by flow cytometry and quantitative analysis showed that TCF1+Texprog were more abundant than TCF1−Texterm in dLNs (n = 10). f Flow
cytometry results showed that TCF1−Texterm in dLNs was positively associated with TCF1−Texterm in tumors, while there was no correlation for
TCF1+Texprog (n = 10). Paired t tests were performed for the data in (b–e). Spearman’s correlation test for (f). *P < 0.05, **P < 0.01. Scale bars:
200 μm for left (a) and 50 μm for right (a)
International Journal of Oral Science (2022)14:8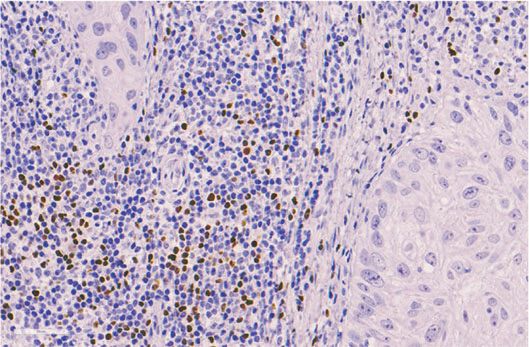
Two subsets of exhauted T cells in HNSCC
Wang et al.
4
a CD8+PD-1+TCF1+ Texprog b
CD8+PD-1+TCF1- Texterm
1.00 1.00
0.75 0.75
Overall survival
SYSU Overall survival
cohort, 0.50 0.50
N=102
0.25 0.25
Log-rank P=0.526 Log-rank P=0.005 Low
Low
High HR(95%CI) = 0.38 (0.19-0.77), Log-rank p = 0.005
High
HR(95%CI) = 1.36 (0.52-3.50), Log-rank p = 0.526
0.00 0.00
0 12 24 36 48 60 72 84 0 12 24 36 48 60 72 84
Follow-up time/month Follow-up time/month
No. at risk No. at risk
Tex prog Low 89 80 70 62 59 31 6 0 Tex term Low 21 17 11 9 9 6 3 0
Tex prog High 13 9 9 8 7 2 0 0 Tex term High 81 72 68 61 57 27 3 0
c d CD8+PD-1+TCF1- Texterm
CD8+PD-1+TCF1+ Texprog
1.00 1.00
Low Low
High High
0.75 0.75
Overall survival
Overall survival
ZJU
cohort, 0.50 0.50
N=73
0.25 0.25
Log-rank P=0.054 Log-rank P=0.003
0.00 0.00
0 12 24 36 48 60 0 12 24 36 48 60
Follow-up time/month Follow-up time/month
No. at risk No. at risk
prog
Tex Low 29 24 13 10 10 10 Tex term Low 33 27 17 12 12 12
Tex prog High 44 39 33 30 30 28 Tex term High 40 36 29 28 28 26
Fig. 2 The density of CD8+PD-1+TCF1− terminally exhausted T cells (TCF1−Texterm) indicated a favorable prognosis in head and neck
squamous cell carcinoma (HNSCC) based on the density from mIHC results. a There was no significant overall survival (OS) analysis according
to high and low densities of CD8+PD-1+TCF1+ progenitor exhausted T cells (TCF1+Texprog) in the SYSU cohort. b High density of TCF1−Texterm
predicted a better OS in the SYSU cohort. c There was no significant OS analysis according to high and low densities of TCF1+Texprog in the
ZJU cohort. d High density of TCF1−Texterm indicated a better OS in the ZJU cohort. The log-rank test was used for (a–d)
checkpoint receptors, it also expressed higher levels of GZMB, Together, these results indicated that a high proportion of
exerting a stronger antitumor response. TCF1−Texterm was associated with more tumor-infiltrating Tregs,
which might constrain the persistent antitumor activity of
A high proportion of TCF1−Texterm was associated with more Treg TCF1−Texterm.
infiltration
Tregs are increased within tumor sites of various tumor types in
humans and mice, limiting the antitumor immune response.27 DISCUSSION
Tregs promote intratumoral T cell exhaustion by modulating the Recent studies have revealed that there are at least two distinct
expression of several coinhibitors and the exhaustion-associated subsets of Tex in melanoma: CD8+PD-1+TCF1+ stem-like Texprog
transcriptomic signature of CD8+ T cells.28 We, therefore, used and CD8+PD-1+TCF1−Texterm.8,10,15 However, these Tex subsets
flow cytometry to investigate the association between the have not been explored in the context of HNSCC. In this study, we
percentages of Tregs and the ratios of TCF1+Texprog to first explored the comprehensive profile of TCF1+Texprog and
TCF1−Texterm which represented the status of PD1+CD8+ Tex TCF1−Texterm in HNSCC, paving the way to maximize the function
proportion. We found that, although not statistically significant, of Tex reinvigoration by ICB therapy.
the proportion of CD4+Foxp3+ Tregs increased as the ratio of We identified that TCF1+Texprog and TCF1−Texterm were both
TCF1+Texprog/TCF1−Texterm decreased (Fig. 4a). Then, we further detected in HNSCC by mIHC and flow cytometry. In most HNSCC
divided these patients into two groups according to the patients, TCF1−Texterm were more abundant than TCF1+Texprog in
TCF1+Texprog/TCF1−Texterm ratio in tumors, with the median tumors, consistent with the results in melanoma.29 This is partially
value as a cutoff. Tumors with a TCF1+Texprog/TCF1−Texterm due to the higher expression of CD103 on TCF1−Texterm. However,
ratio ≥ 0.6 were defined as the high ratio group and those with a TCF1+Texprog was the main Tex subtype in dLNs. It has been
TCF1+Texprog/TCF1−Texterm ratio < 0.6 were defined as the low reported that tumor dLNs could act as key orchestrators of
ratio group. We found that the levels of tumor-infiltrating Tregs antitumor responses induced by ICB therapy and generate the
were significantly higher in the low ratio group than in the TCF1+Texprog that seed the tumor.16 We also found that
high ratio group (Fig. 4b, c). To confirm the flow cytometry TCF1-Texterm expressed more GZMB and displayed a phenotype
results, we further stained Foxp3 in FFPE samples from these of greater polyfunctional TNFα+GZMB+IFNγ+ production, whereas
patients. In accordance with our findings, Foxp3 was signifi- TCF1+Texprog could produce more TNFα which plays an important
cantly expressed at higher levels in low ratio patients (Fig. 4d, e). role in T cell proliferation and survival.30,31
International Journal of Oral Science (2022)14:8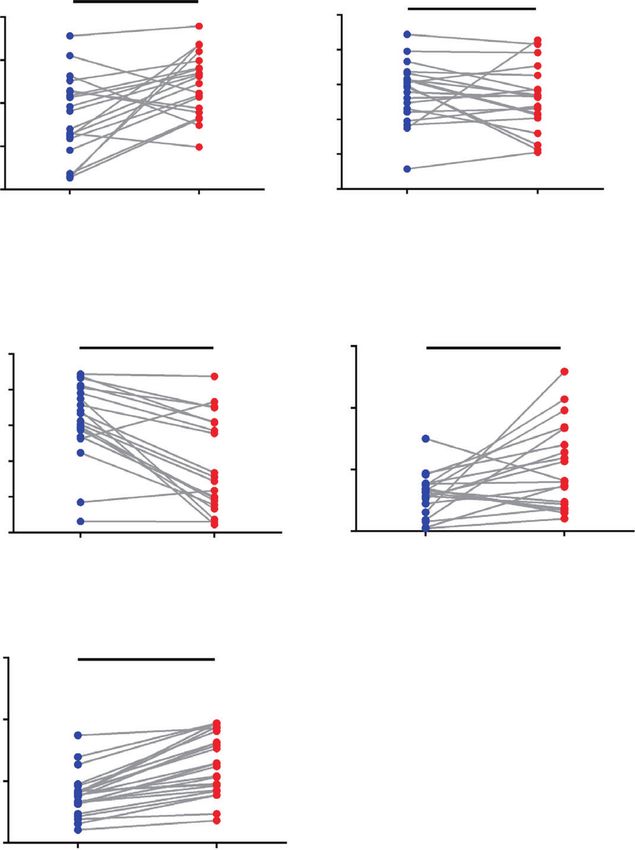
Two subsets of exhauted T cells in HNSCC
                                                                                 Wang et al.
                                                                                                                                                                5
 Table 1.   Multivariate analysis of overall survival based on the Cox’s proportional hazards model in two clinical cohorts

                                                         SYSU cohort                                              ZJU cohort
Variables                      Items                     HR (95% CI)                        P value               HR (95% CI)                        P value

Nodal invasion                 Negative                  Reference                                                Reference
                               Positive                  2.442 (0.977–6.108)                0.056                 1.915 (0.779–4.711)                0.157
Clinical stage                 Stage I/II                Reference                                                Reference
                               Stage III/IV              1.054 (0.431–2.577)                0.908                 1.389 (0.571–3.378)                0.469
Radiotherapy                   Yes                       Reference                                                –
                               No                        1.479 (0.694–3.149)                0.311                 –
Texterm density                Low                       Reference                                                Reference
(cells/mm2)                    High                      0.413 (0.190–0.900)                0.026*                0.352 (0.181–0.676)                0.002*
 Texprog CD8+PD-1+TCF1+progenitor exhausted T cells, Texterm CD8+PD-1+TCF1− terminally exhausted T cells, SYSU cohort patients with HNSCC who were
 treated with surgery at Sun Yat-Sen University, ZJU cohort patients with HNSCC who were treated with surgery at Zhejiang University, HR hazard ratio, 95% CI
 95% confidence interval, – not included, * P < 0.05

   Survival analysis revealed that a high abundance of                              In summary, the present study first identified TCF1−Texterm as
TCF1−Texterm rather than TCF1+Texprog predicted better OS and                    the major subtype in the TIME and then showed that this subtype
RFS in two clinical cohorts. However, the TCF1+Texprog levels were               is indicative of a favorable prognosis in HNSCC. The TCF1−Texterm
especially associated with better tumor regression and better                    in the tumor environment was correlated with that in dLNs, which
overall response in ICB-treated patients.8,10,32 Patients with                   showed a higher proportion of Texprog. Moreover, we found that a
melanoma who had a higher percentage of TCF1+Texprog respond                     high proportion of TCF1−Texterm was associated with more tumor-
to ICB therapy for a longer duration. Strategies aiming to increase              infiltrating Tregs. Overall, our study might provide a theoretical
the levels of progenitor and terminally exhausted T cells were                   basis for optimal ICB immunotherapy in HNSCC.
proposed by some researchers. Baharom et al. applied a self-
assembling nanoparticle vaccine that linked neoantigen peptides
to a Toll-like receptor 7/8 agonist (SNP-7/8a) to induce a higher                MATERIALS AND METHODS
proportion of CD8+PD-1+TCF1+ Texprog, resulting in a superior                    Patients and study cohorts
antitumor response in combination with a PD-L1 blockade.33 In                    A total of 175 consecutive patients’ FFPE specimens with
addition, Ptpn2 deletion in CD8+ T cells enhanced the generation                 histologically verified primary HNSCC from January 2006 to 2010
and cytotoxicity of TCF1−Texterm, promoted tumor control, and                    came from two clinical centers (Hospital of Stomatology,
improved PD-1 checkpoint blockade responses to B16 tumors.34                     Guanghua School of Stomatology, Sun Yan-Sen University, SYSU
   Even though progenitor and terminally exhausted T cells played                cohort, N = 102; The Stomatologic Hospital, School of Medicine,
important roles in the antitumor response, we noticed that                       Zhejiang University, ZJU cohort, N = 73) and 34 HNSCC patients’
CD4+Foxp3+ Tregs were elevated as TCF1+Texprog/TCF1−Texterm                      fresh tumor tissues and 10 paired dLNs during surgery between
ratio decreased. Previous studies reported that high levels of tumor-            Jan. 2020 and Jun. 2021 were obtained from the Hospital of
infiltrating Foxp3+ Tregs were associated with better prognosis and               Stomatology, Guanghua School of Stomatology, Sun Yan-Sen
locoregional control in HNSCC.35–37 However, Foxp3 is a crucial                  University. All the samples were HPV negative. All the samples
regulator of Tregs that is responsible for a substantial amount of               used in this study were approved by the ethics committee of the
their suppressive potential.38 This result indicates that the good               Hospital of Stomatology, Guanghua School of Stomatology, Sun
prognosticator, Foxp3+ Tregs, might be accompanied by high levels                Yat-sen University. Their clinical data were kept anonymous.
of TCF1-Texterm. Foxp3 expression correlated with decreased TCF1
and reduced accessibility of TCF1-bound chromatin regions.39 Treg-               Immunohistochemistry (IHC)
derived IL-10 and IL-35 can also directly induce the expression of               IHC staining was performed on FFPE samples as previously
multiple coinhibitors and drive T cell dysfunction.28 This result                described.41,42 Four-micrometer slides were undergone the
suggested that Tregs might affect the formation of TCF1+Texprog                  following procedures: deparaffinized in xylene, rehydrated in
through transcriptional regulation, resulting in an imbalance in Tex             graded alcohol, blocked in 3% hydrogen peroxide, antigen
subtypes. In addition, we found that TCF1−Texterm expressed higher               retrieval in Tris-EDTA buffer (pH 8.0). Next, the slides were
levels of TIM-3, CTLA-4, and TIGIT, which are markers of a                       incubated with Foxp3 (#98377S, Cell Signaling Technology, 1:100)
dysfunctional subset of tumor-infiltrating CD8+PD1+ T cells in                    primary antibodies at 4 °C overnight. After being treated with HRP
cancer. In a transgenic HNSCC mouse model, anti-TIM-3 monoclonal                 goat anti-rabbit secondary antibody, the slides were stained 3,3-
antibody injection induced a reduction in Tregs and increased IFN-γ              diaminobenzidine (DAB). Then Aperio AT2 scanner (Leica) was
production on CD8+ T cells, suggesting that the antitumor immune                 applied to scan the stained slides. At least three random
response was enhanced by TIM-3 blockade through relieved                         interested areas (contained both intratumoral and stromal areas)
suppression of negative immune factors.40 Therefore, increased                   of every section were chosen for quantification. Mean Foxp3 H-
Tregs and upregulated inhibitory receptors on TCF1−Texterm might                 scores were quantified with background subtraction using Aperio
construct an immunosuppressive microenvironment in the TIME,                     eSlide Manager Quantification software.43
resulting in a barrier to the efficacy of immunotherapy. These
findings indicated that ICB therapy in combination with Treg                      mIHC
deletion might serve as a new strategy to achieve a stronger T cell              Opal 7-color fluorescent IHC kit (NEL811001KT, PerkinElmer) was
immune response in the TIME when designing immunotherapy                         used to stain the multi-parametric immunofluorescence panel.
regimens for patients with HNSCC, especially for those with                      First, an initial deparaffinization procedure was performed on all
TCF1+Texprog/TCF1−Texterm ratios lower than 0.6.                                 slides, followed by fixation in 10% formalin fixation and Tris-EDTA

International Journal of Oral Science (2022)14:8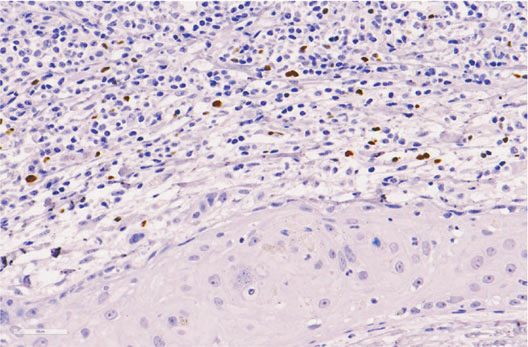
Two subsets of exhauted T cells in HNSCC
Wang et al.
6
a TCF1+ Texprog TCF1-Texterm b c
105 13.8 34.2 105 40.6 185
** ns
4 4
10 10 80 100
+
+
Percentage of GZMB
Percentage of IFNγ
80
103 103 60
0 0 60
18.9 33.2 25.2 15.7 40
-103 -103 40
GZMB
-103 0 103 104 105 -103 0 103 104 105
TNFα 20
20
0 0
105 13.3 50.5 105 13.8 29.9
TCF1+ Texprog TCF1-Texterm TCF1+ Texprog TCF1-Texterm
4 4
10 10
103 103
0 0
-103 -103
19.4 50.5 52.0 4.33 d e
****
IFNγγ
30 *
+
100
Percentage of TNFD IFNγ
3 3 4 5 3 3 4
-10 0 10 10 10 -10 0 10 10 105
TNFα
Percentage of TNFD+
80
+
20
+
105 34.7 105 20.5
GZMB
29.6 23.2 60
104 104
40
10
3
10 103 20
0 0
-103 -103 0 0
22.4 13.3 20.5 35.8 TCF1+ Texprog TCF1-Texterm TCF1+ Texprog TCF1-Texterm
IFNγ
-103 0 103 104 105 -103 0 103 104 105
GZMB
f TCF1+ Texprog TCF1-Texterm 150 ****
4
Percentage of CD103+
25×10 250K
20×104 200K 100
31.8 79.3
15×104 150K
4
10×10 100K
50
5×10⁴ 50K
FSC
0 0
-103 0 103 104 105 -103 0 103 104 105 0
CD103 TCF1+ Texprog TCF1-Texterm
g
100 100 100 100 + prog
TCF1 Tex
TCF1-Texterm
Percentage of max
80 80 80 80
60 60 60 60
40 40 40 40
20 20 20 20
0 0 0 0
3
-10 0 103 104 105 -103 0 103 104 105 -103 0 103 104 105 -103 0 103 104 105
TIM-3 CTLA-4 TIGIT LAG-3
h ns
** * ****
3000 2500 2000 1500
MFI of CTL-4
MFI of TIM-3
2000
MFI of LAG-3
MFI of TIGIT
1500
2000 1000
1500
1000
1000 1000
500
500 500
0 0 0 0
TCF1+ Texprog TCF1-Texterm TCF1+ Texprog TCF1-Texterm TCF1+ Texprog TCF1-Texterm TCF1+ Texprog TCF1-Texterm
Fig. 3 Differences in cytotoxicity activation molecules and cell surface marker expression between CD8+PD-1+TCF1+ progenitor exhausted T cells
(TCF1+Texprog) and CD8+PD-1+TCF1− terminally exhausted T cells (TCF1−Texterm) in head and neck squamous cell carcinoma (HNSCC) tumor
tissues were detected using flow cytometry. a Representative contour plots of selected cytokine markers (TNFα, GZMB, and IFNγ) gated on
TCF1+Texprog or TCF1−Texterm. b TCF1−Texterm showed higher GZMB production (n = 20). c There was no significant difference in IFNγ expression
between these two subsets of exhausted T cells (n = 20). d TCF1+Texprog showed a higher TNFα production (n = 20).
e TCF1−Texterm displayed a higher proportion of cells with the polyfunctional phenotype of TNFα+GZMB+IFNγ+ (n = 20). f Representative contour
plots of CD103 and comparison of CD103 expression among TCF1+Texprog and TCF1−Texterm (n = 24). g Mean fluorescence intensity (MFI) of TIM-3,
CTLA-4, TIGIT, and LAG-3 gated on TCF1+Texprog or TCF1−Texterm. h Quantitative analysis of TIM-3 (n = 24), CTLA-4 (n = 10), TIGIT (n = 10), and LAG-3
(n = 10) MFI between TCF1+Texprog and TCF1−Texterm. Paired t tests were performed for (b–f and h). *P < 0.05, **P < 0.01, ****P < 0.000 1, nsP > 0.05
International Journal of Oral Science (2022)14:8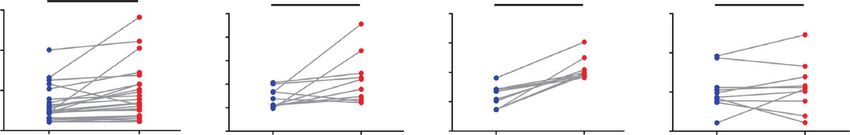
Two subsets of exhauted T cells in HNSCC
Wang et al.
7
a b
TCF1+Texprog /TCF1- Texterm ratio
50 *
Treg percentage of CD4+
4 r =-0.39, P =0.08
40
3
T cells
30
2 20
1 10
0
0 High ratio Low ratio
0 10 20 30 40 50
Treg % of CD4+ T cells TCF1+Texprog /TCF1- Texterm ratio
c High ratio Low ratio
e
60 **
105 6.36 105 18.5
Foxp3 H-scores
104 104 40
103 103
20
0 0
-103 -103 0
CD4
-103 0 103 104 105 -103 0 103 104 105 High ratio Low ratio
Foxp3
TCF1+Texprog /TCF1- Texterm ratio
d High ratio Low ratio
100X
Foxp3
400X
Fig. 4 Regulatory T cells (Tregs) increased with a higher proportion of CD8+PD-1+TCF1− terminally exhausted T cells (TCF1−Texterm). a Tregs
negatively correlated with the ratios of progenitor exhausted T cells (TCF1+Texprog) to TCF1−Texterm (n = 21). b Flow cytometry result showed
that CD4+Foxp3+Tregs were significantly increased in the low ratio group (high ratio group: n = 10, low ratio group: n = 11).
c Representative contour plots of Foxp3+Tregs among CD4+ T cells in the high/low TCF1+Texprog/TCF1−Texterm ratio groups.
d, e Representative IHC images of Foxp3 staining in FFPE samples from patients in the high/low ratio groups and quantitative Foxp3
H-score analysis showed that Foxp3 expressed higher in the low ratio group. Data are shown as the mean ± SEM. Spearman’s correlation test
was performed for a, and unpaired t tests were performed for (b, e). *P < 0.05, **P < 0.01. Scale bars: 200 μm for 100× and 50 μm for 400×
(pH = 9.0) antigen retrieval. Afterward, the slides were incubated The Opal detection fluorophores for exhausted T cells analysis
with primary antibody, secondary-HRP antibody, and Opal TSA panel was: Opal 690-CD8 (ZA-0508, ZSGB-Biotech, 1:200), Opal
dyes. Subsequently by the other cycles of staining consisted of 650-PD-1 (#86163S, Cell Signaling Technology, 1:200), Opal 570-
antigen retrieval, blocking, primary antibody and secondary-HRP TCF1 (#2203S, Cell Signaling Technology, 1:200), Opal 540-PanCK
antibody incubation, and Opal TSA dye staining. Finally, the slides (#4545S, Cell Signaling Technology, 1:500).
were mounted with Antifade Reagent (AR1109, BOSTER). DAPI was
used for the nuclear counterstain. Images of the whole tissue Tissue dissociation
specimens were acquired by the TissueFAXS platform (TissueG- Tissue dissociation was performed as the previous study.23 Tumor
nostics). TCF1+Texprog and TCF1−Texterm phenotypes were identi- tissues were cut into several pieces. One-piece was fixed in 10%
fied and quantitated using the tissue cytometry of StrataQuest formalin for IHC or mIHC verification and the other pieces were
software (V7.0.1.140, TissueGnostics).44 Threshold cut-offs incubated with 1 mg·mL−1 Collagenase IV, 0.5 mg/mL Collagenase
depicted by horizontal and/or vertical lines were determined I (Gibco) and 0.1 mg·mL−1 DNase I (Biofroxx) in complete RPMI
manually by backgating to the greyscale and multiplexed tissue 1640 (Gibco) medium with 10% FBS for 30 min at 37 °C. Digested
images for each biomarker (CD8, PD-1, TCF1).45 tissues were filtered using a 70 μm cell strainer. Lymph nodes
International Journal of Oral Science (2022)14:8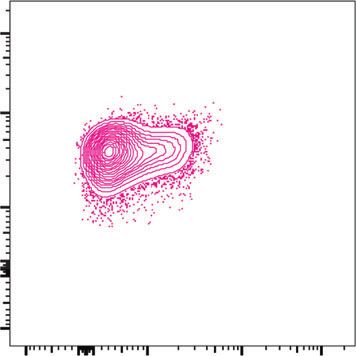
Two subsets of exhauted T cells in HNSCC
                                                                       Wang et al.
8
    were ground and filtered in the complete medium by a 40 μm cell                              and J.Y.G. contributed to data analysis and interpretation, drafted and critically
    strainer. Cells were then washed and treated with 1× red blood                              revised the paper; Z.Y.S., W.Q.X. contributed to the data acquisition, analysis and
    cell lysis buffer (BD Biosciences) for 2 min at room temperature.                           interpretation, critically revised the paper; J.M.W., X.Q.L., L.L.W., J.S., A.X.W., and Q.M.C.
    After washing with PBS (Gibco), the cell suspensions were then                              contributed to the data analysis and interpretation, drafted and critically revised the
                                                                                                paper; Z.W. contributed to conception and design, data interpretation, drafted and
    used for flow cytometry analysis.
                                                                                                critically revised the paper. All authors gave final approval and agree to be
                                                                                                accountable for all aspects of the work.
    Flow cytometry
    For intra-nuclear staining, the samples were first stained with
    Viability Ghost Dye (Tonbo Biosciences) for 15 min at room                                  ADDITIONAL INFORMATION
    temperature, then incubated with the cell surface markers: CD45                             Supplementary information The online version contains supplementary material
    (2D1, eBioscience), CD20 (2H7, eBioscience), CD3 (OKT3, Tonbo                               available at https://doi.org/10.1038/s41368-022-00160-w.
    Biosciences), CD4 (OKT4, Biolegend), CD8 (SK1, eBioscience), PD-1
    (J505, eBioscience), CD103 (Ber-ACT8, Biolegend), TIM-3 (F38-2E2,                           Competing interests: The authors declare no competing interests.
    eBioscience), TIGIT (VSTM3, Biolegend), LAG-3 (7H2C65, Biolegend)
    for 30 min at 4 °C. Afterward, Foxp3/Transcription Factor Staining
    Buffer Set (Tonbo Biosciences) was applied according to the                                 REFERENCES
    manufacturer’s instructions for the next nuclear molecules
                                                                                                 1. Ferris, R. L. et al. Nivolumab for recurrent squamous-cell carcinoma of the head
    staining. TCF1 (#2203S, Cell Signaling Technology, 1:400) was                                   and neck. N. Engl. J. Med. 375, 1856–1867 (2016).
    stained for 45 min at room temperature. Lastly, Alexa Fluor 488                              2. Massarelli, E. et al. Combining immune checkpoint blockade and tumor-specific
    donkey anti-rabbit secondary antibody (#2156521, Thermo Fisher                                  vaccine for patients with incurable human papillomavirus 16-related cancer: a
    Scientific, 1:500), CTLA-4 (14D3, eBioscience), and Foxp3 (PCH101,                               phase 2 clinical trial. JAMA Oncol. 5, 67–73 (2019).
    eBioscience) were stained.                                                                   3. Kudo, T. et al. Nivolumab treatment for oesophageal squamous-cell carcinoma:
       For cytokine detection, the samples were stimulated for 5 h with                             an open-label, multicentre, phase 2 trial. Lancet Oncol. 18, 631–639 (2017).
    a cell stimulation cocktail (Tonbo Biosciences) at 37 °C, 5% CO2.                            4. Whiteside, T. L. Head and neck carcinoma immunotherapy: facts and hopes. Clin.
    Then the samples were washed with PBS and stained with Viability                                Cancer Res. 24, 6–13, https://doi.org/10.1158/1078-0432.CCR-17-1261 (2018).
                                                                                                 5. Mei, Z., Huang, J., Qiao, B. & Lam, A. K. Immune checkpoint pathways in immu-
    Ghost Dye. Next incubated with the membrane molecules: CD3,
                                                                                                    notherapy for head and neck squamous cell carcinoma. Int. J. Oral. Sci. 12, 16 (2020).
    CD4, CD8, and PD-1. Followed by Foxp3/Transcription Factor                                   6. Blank, C. U. et al. Defining ‘T cell exhaustion’. Nat. Rev. Immunol. 19, 665–674
    Staining Buffer Set application and TCF1 staining. Lastly, the cell                             (2019).
    suspensions were incubated with donkey anti-rabbit secondary                                 7. Thommen, D. S. & Schumacher, T. N. T cell dysfunction in cancer. Cancer Cell 33,
    antibody, TNFα (MAB11, eBioscience), GZMB (CB11, eBioscience),                                  547–562 (2018).
    IFNγ (4S.B3, Biolegend) overnight. Stained cells were washed and                             8. Miller, B. C. et al. Subsets of exhausted CD8(+) T cells differentially mediate tumor
    resuspended in PBS. All the samples were acquired on BD                                         control and respond to checkpoint blockade. Nat. Immunol. 20, 326–336 (2019).
    LSRFortessa (BD Biosciences). Flow cytometry data were analyzed                              9. Sade-Feldman, M. et al. Defining T cell states associated with response to
    by FlowJo software (Tree Star).                                                                 checkpoint immunotherapy in melanoma. Cell 175, 998–1013 (2018). e1020.
                                                                                                10. Siddiqui, I. et al. Intratumoral Tcf1(+)PD-1(+)CD8(+) T cells with stem-like
                                                                                                    properties promote tumor control in response to vaccination and checkpoint
    Statistical analysis                                                                            blockade immunotherapy. Immunity 50, 195–211 (2019).
    All results were summarized as mean ± SEM, and statistical                                  11. Zeng, Z., Wei, F. & Ren, X. Exhausted T cells and epigenetic status. Cancer Biol.
    analysis was performed with Prism 7.0 (Graphpad Software).                                      Med. 17, 923–936 (2020).
    Differences between groups were evaluated by paired or unpaired                             12. Escobar, G., Mangani, D. & Anderson, A. C. T cell factor 1: a master regulator of
    two-tailed Student’s t test. To determine the optimal cutoff point                              the T cell response in disease. Sci. Immunol. https://doi.org/10.1126/sciimmunol.
    for the high- and low-density groups in our cohort and validation                               abb9726 (2020).
    cohort, we used the maximally selected rank statistics from the                             13. Zhao, X., Shan, Q. & Xue, H. H. TCF1 in T cell immunity: a broadened frontier. Nat.
    “maxstat” R package.46,47 The cutoff point for RFS was set to the                               Rev. Immunol. https://doi.org/10.1038/s41577-021-00563-6 (2021).
                                                                                                14. Wen, S. et al. TCF-1 maintains CD8(+) T cell stemness in tumor microenviron-
    same as the value for OS analysis. Survival analysis was performed
                                                                                                    ment. J. Leukoc. Biol. 110, 585–590 (2021).
    and presented by using the Kaplan–Meier method. The difference                              15. Jansen, C. S. et al. An intra-tumoral niche maintains and differentiates stem-like
    in survival curves was tested by the log-rank test. The correlation                             CD8 T cells. Nature 576, 465–470 (2019).
    analysis between groups was determined by Spearman’s correla-                               16. Dammeijer, F. et al. The PD-1/PD-L1-checkpoint restrains T cell immunity in
    tion test. P < 0.05 was considered statistically significant (*P < 0.05,                         tumor-draining lymph nodes. Cancer Cell 38, 685–700 (2020).
    **P < 0.01, ***P < 0.001, ****P < 0.000 1, nsP > 0.05).                                     17. Nguyen, N. et al. Tumor infiltrating lymphocytes and survival in patients with
                                                                                                    head and neck squamous cell carcinoma. Head Neck 38, 1074–1084 (2016).
                                                                                                18. Fang, J. et al. Prognostic significance of tumor infiltrating immune cells in oral
                                                                                                    squamous cell carcinoma. BMC Cancer 17, 375 (2017).
    DATA AVAILABILITY
                                                                                                19. Balermpas, P. et al. CD8+ tumour-infiltrating lymphocytes in relation to HPV
    Data are available upon reasonable request. All data relevant to the study are
                                                                                                    status and clinical outcome in patients with head and neck cancer after post-
    included in the article or uploaded as supplementary information.
                                                                                                    operative chemoradiotherapy: a multicentre study of the German cancer con-
                                                                                                    sortium radiation oncology group (DKTK-ROG). Int. J. Cancer 138, 171–181 (2016).
                                                                                                20. Xiao, Y. et al. CD103(+) T and dendritic cells indicate a favorable prognosis in oral
    ACKNOWLEDGEMENTS                                                                                cancer. J. Dent. Res. 98, 1480–1487 (2019).
    This work was supported by the National Natural Science Foundations of China (Nos.          21. Hewavisenti, R. et al. CD103+ tumor-resident CD8+ T cell numbers underlie
    81972532, 81991500, 82101017, 81902778, and 81500864) and Guangdong Basic and                   improved patient survival in oropharyngeal squamous cell carcinoma. J.
    Applied Basic Research Foundation (2020A1515110741). We thank the reviewers’                    Immunother. Cancer https://doi.org/10.1136/jitc-2019-000452 (2020).
    thoughtful remarks and ideas for improving our work. We thank Hongzhe Sun and               22. Ma, J. et al. PD1(Hi) CD8(+) T cells correlate with exhausted signature and poor
    Yadong Zhu from TissueGnostics for their technical assistance in mIHC analysis. And             clinical outcome in hepatocellular carcinoma. J. Immunother. Cancer 7, 331
    we thank all the patients for their understanding, trust, and willingness to provide            (2019).
    their samples for this study.                                                               23. Kansy, B. A. et al. PD-1 status in CD8(+) T cells associates with survival and anti-
                                                                                                    PD-1 therapeutic outcomes in head and neck cancer. Cancer Res. 77, 6353–6364
                                                                                                    (2017).
    AUTHOR CONTRIBUTIONS                                                                        24. Liu, X. et al. PD-1(+) TIGIT(+) CD8(+) T cells are associated with pathogenesis and
    D.K.W., J.F., and S.Q.W. contributed to design, data acquisition, analysis and                  progression of patients with hepatitis B virus-related hepatocellular carcinoma.
    interpretation, drafted and critically revised the paper; Q.X.L., L.S.Y., W.X.D., H.Z.L.,       Cancer Immunol. Immunother. 68, 2041–2054 (2019).

                                                                                                           International Journal of Oral Science (2022)14:8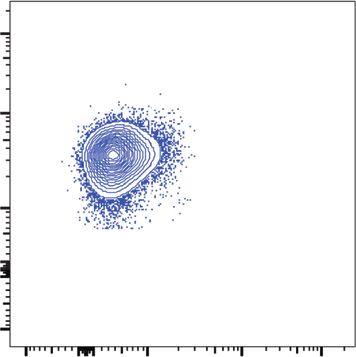
Two subsets of exhauted T cells in HNSCC
                                                                                              Wang et al.
                                                                                                                                                                                            9
25. Guo, L. et al. Tumoral PD-1hiCD8+ T cells are partially exhausted and predict             39. van der Veeken, J. et al. The transcription factor Foxp3 shapes regulatory T cell
    favorable outcome in triple-negative breast cancer. Clin. Sci. 134, 711–726 (2020).           identity by tuning the activity of trans-acting intermediaries. Immunity 53,
26. Kaneko, N. et al. Loss of Bcl-6-expressing T follicular helper cells and germinal             971–984 (2020). e975.
    centers in COVID-19. Cell 183, 143–157 (2020). e113.                                      40. Liu, J. F. et al. Blockade of TIM3 relieves immunosuppression through reducing
27. Sharabi, A. et al. Regulatory T cells in the treatment of disease. Nat. Rev. Drug             regulatory T cells in head and neck cancer. J. Exp. Clin. Cancer Res. 37, 44 (2018).
    Discov. 17, 823–844, https://doi.org/10.1038/nrd.2018.148 (2018).                         41. Song, J. J. et al. Foxp3 overexpression in tumor cells predicts poor survival in oral
28. Sawant, D. V. et al. Adaptive plasticity of IL-10(+) and IL-35(+) Treg cells                  squamous cell carcinoma. BMC Cancer 16, 530 (2016).
    cooperatively promotes tumor T cell exhaustion. Nat. Immunol. 20, 724–735                 42. Li, Q. et al. Prognostic value of tertiary lymphoid structure and tumour infiltrating
    (2019).                                                                                       lymphocytes in oral squamous cell carcinoma. Int. J. Oral. Sci. 12, 24 (2020).
29. Beltra, J. C. et al. Developmental relationships of four exhausted CD8(+) T cell          43. Mao, L. et al. gamma-Secretase inhibitor reduces immunosuppressive cells and
    subsets reveals underlying transcriptional and epigenetic landscape control                   enhances tumour immunity in head and neck squamous cell carcinoma. Int. J.
    mechanisms. Immunity 52, 825–841 (2020).                                                      Cancer 142, 999–1009 (2018).
30. Shi, M., Ye, Z., Umeshappa, K. S., Moyana, T. & Xiang, J. Alpha tumor necrosis            44. Blenman, K. R. M. & Bosenberg, M. W. Immune cell and cell cluster phenotyping,
    factor contributes to CD8(+) T cell survival in the transition phase. Biochem.                quantitation, and visualization using in silico multiplexed images and tissue.
    Biophys. Res. Commun. 360, 702–707 (2007).                                                    Cytom. Cytom. A 95, 399–410 (2019).
31. van Horssen, R., Ten Hagen, T. L. & Eggermont, A. M. TNF-alpha in cancer treat-           45. Zhang, S. M. et al. KDM5B promtes immune evasion by recruiting SETDB1 to
    ment: molecular insights, antitumor effects, and clinical utility. Oncologist 11,             silence retroelements. Nature 598, 682–687, (2021).
    397–408 (2006).                                                                           46. Lausen, B. & Schumacher, M. Maximally selected rank statistics. Biometrics 48,
32. Held, W., Siddiqui, I., Schaeuble, K. & Speiser, D. E. Intratumoral CD8(+) T cells            73–85 (1992).
    with stem cell-like properties: Implications for cancer immunotherapy. Sci. Transl.       47. Hothorn, T. & Lausen, B. Maximally selected rank statistics in R. R. N. 2, 3–5 (2002).
    Med. https://doi.org/10.1126/scitranslmed.aay6863 (2019).
33. Baharom, F. et al. Intravenous nanoparticle vaccination generates stem-like TCF1
    (+) neoantigen-specific CD8(+) T cells. Nat. Immunol. 22, 41–52 (2021).                                       Open Access This article is licensed under a Creative Commons
34. LaFleur, M. W. et al. PTPN2 regulates the generation of exhausted CD8(+) T cell                              Attribution 4.0 International License, which permits use, sharing,
    subpopulations and restrains tumor immunity. Nat. Immunol. 20, 1335–1347                  adaptation, distribution and reproduction in any medium or format, as long as you give
    (2019).                                                                                   appropriate credit to the original author(s) and the source, provide a link to the Creative
35. Seminerio, I. et al. Infiltration of FoxP3+ regulatory T cells is a strong and inde-       Commons license, and indicate if changes were made. The images or other third party
    pendent prognostic factor in head and neck squamous cell carcinoma. Cancers               material in this article are included in the article’s Creative Commons license, unless
    https://doi.org/10.3390/cancers11020227 (2019).                                           indicated otherwise in a credit line to the material. If material is not included in the
36. Badoual, C. et al. Prognostic value of tumor-infiltrating CD4+ T-cell subpopula-           article’s Creative Commons license and your intended use is not permitted by statutory
    tions in head and neck cancers. Clin. Cancer Res. 12, 465–472 (2006).                     regulation or exceeds the permitted use, you will need to obtain permission directly
37. Shang, B., Liu, Y., Jiang, S. J. & Liu, Y. Prognostic value of tumor-infiltrating FoxP3+   from the copyright holder. To view a copy of this license, visit http://creativecommons.
    regulatory T cells in cancers: a systematic review and meta-analysis. Sci. Rep. 5,        org/licenses/by/4.0/.
    15179 (2015).
38. Lu, L., Barbi, J. & Pan, F. The regulation of immune tolerance by FOXP3. Nat. Rev.
    Immunol. 17, 703–717 (2017).                                                              © The Author(s) 2022

International Journal of Oral Science (2022)14:8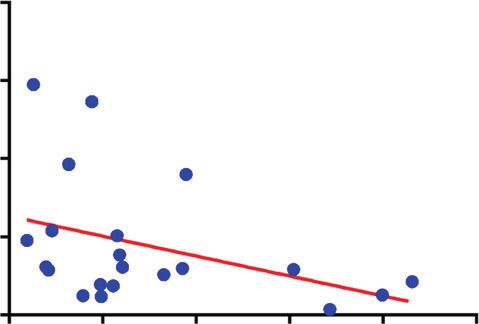
You can also read