RBL2/DREAM mediated repression of the Aurora kinase A/B pathway determines therapy responsiveness and outcome in p53 WT NSCLC
←
→
Page content transcription
If your browser does not render page correctly, please read the page content below
www.nature.com/scientificreports
OPEN RBL2/DREAM‑mediated repression
of the Aurora kinase A/B pathway
determines therapy responsiveness
and outcome in p53 WT NSCLC
Lei Duan1,2*, Ricardo E. Perez3, Sarah Calhoun1,2 & Carl G. Maki1,2*
Wild-type p53 is a stress-responsive transcription factor and potent tumor suppressor. P53 activates
or represses genes involved in cell cycle progression or apoptosis in order to arrest the cell cycle or
induce cell death. Transcription repression by p53 is indirect and requires repressive members of the
RB-family (RB1, RBL1, RBL2) and formation of repressor complexes of RB1-E2F and RBL1/RBL2-
DREAM. Many aurora kinase A/B (AURKA/B) pathway genes are repressed in a p53-DREAM-dependent
manner. We found heightened expression of RBL2 and reduced expression of AURKA/B pathway
genes is associated with improved outcomes in p53 wild-type but not p53 mutant non-small cell
lung cancer (NSCLC) patients. Knockdown of p53, RBL2, or the DREAM component LIN37 increased
AURKA/B pathway gene expression and reduced paclitaxel and radiation toxicity in NSCLC cells. In
contrast, pharmacologic inhibition of AURKA/B or knockdown of AURKA/B pathway components
increased paclitaxel and IR sensitivity. The results support a model in which p53-RBL2-DREAM-
mediated repression of the AURKA/B pathway contributes to tumor suppression, improved tumor
therapy responses, and better outcomes in p53 wild-type NSCLCs.
The tumor suppressor protein p53 is a stress-responsive transcription factor and key determinant of cancer
therapy responses1–8. P53 is activated by chemotherapy, radiation, and other DNA damaging stresses. Activated
p53 then initiates transcription programs that arrest the cell cycle or induce apoptosis. P53 is wild-type in ~ 50%
of non-small cell lung cancers (NSCLCs)9. Not surprisingly, p53 wild-type status has been associated with
improved therapy responses and better outcome in NSCLC in several studies7,9–12. However, other studies have
reported no such association between p53 status and NSCLC o utcome7,13–16. The reason for these differences is
unclear. Factors that determine whether p53 wild-type status associates with improved therapy responses and
better outcome in NSCLC (and other cancers) are unknown.
As a transcription factor, p53 can bind the promoter regions of different genes to activate their expression17–20.
Genes directly activated by p53 are typically involved in cell cycle arrest and apoptosis, such as CDKN1A (p21)
and BBC3 (Puma). However, p53 can also repress transcription of an increasingly large number of g enes21–23.
Transcriptional repression by p53 is indirect. Thus, p53 induces expression of p21 that inhibits cyclin-CDK
complexes, leading to hypophosphorylation and inactivation of the pocket proteins RB1, p130, and p107. The
hypophosphorylated pocket proteins bind to E2F factors forming RB-E2F and DREAM transcriptional repressor
complexes24–26. The DREAM complex is composed of DP, p130/p107, E2F4/5, and MuvB. LIN37 is a MuvB pro-
tein required for DREAM complex-mediated gene repression26,27. The DREAM complex is recruited to cell-cycle
genes with E2F and CHR motifs in their promoters and represses their e xpression28. E2F and CHR motifs are
typical characteristics of genes with peak expression in S and M phases, respectively. Nearly 300 cell cycle genes
have been identified that are repressed through the p53-DREAM pathway25,26. Thus, the DREAM complex can
function with RB proteins to induce cell cycle arrest and in this way may play important roles in p53-mediated
tumor suppression.
Many genes in the Aurora kinase (AURK) pathway are repressed by p53-DREAM26. Aurora kinases A and B
(AURKA/B) are ser/thr kinases essential for the onset and progression of m itosis29,30. AURKA/B phosphorylate
G2/M phase substrates to affect different steps in mitosis, including mitotic spindle assembly, centrosome separa-
tion, and others. Both AURKA and B have oncogenic activity, and their high expression is associated with worse
1
Department of Anatomy and Cell Biology, Rush University Medical Center, 600 S. Paulina Ave, AcFac 507,
Chicago, IL 60612, USA. 2Rush University Medical Center, Chicago, IL 60612, USA. 3Robert H. Lurie Comprehensive
Cancer Center of Northwestern University, Chicago, IL, USA. *email: Lei_Duan@Rush.edu; Carl_Maki@rush.edu
Scientific Reports | (2022) 12:1049 | https://doi.org/10.1038/s41598-022-05013-4 1
Vol.:(0123456789)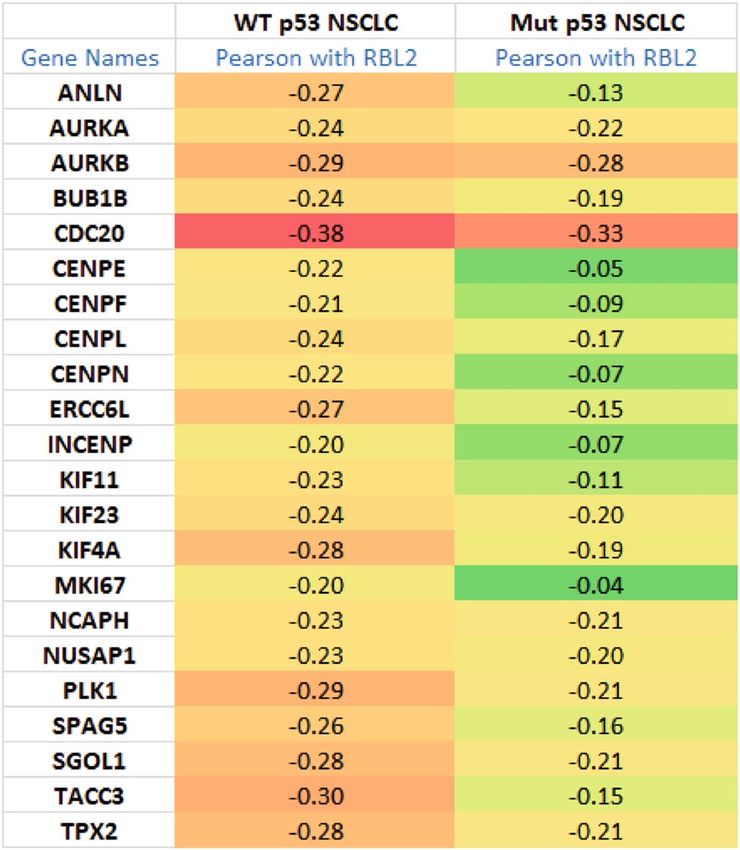
www.nature.com/scientificreports/

                                                                                 RBL2                                RB1                               RBL1
                                                            1.00
                                                                                P=0.015                                  P=0.301                          P=0.12
                                                            0.75

                                                                                                                                                                          WT p53
                                     Survival probability
                                                            0.50

                                                            0.25

                                                            0.00
                                                            1.00
                                                                                 P=0.28                                  P=0.29                          P=0.19

                                                                                                                                                                          Mutant p53
                                                            0.75

                                                            0.50

                                                            0.25

                                                            0.00
                                                                   0    2K      4K     6K      8K      0     2K     4K        6K   8K     0     2K     4K      6K      8K

                                                                                                       Time lapsed (days)
                                                                              High expression (≥median)                       Low expression (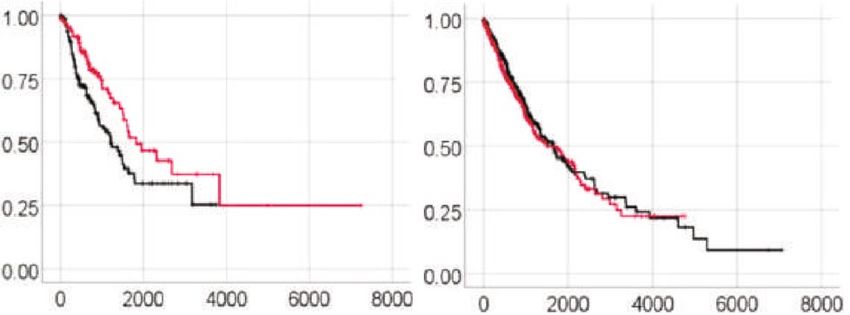
www.nature.com/scientificreports/
Table 1. Negative correlation of RBL2 with AURKA/B pathway genes in NSCLC.
supports the idea that RBL2-mediated repression of the AURKA/B pathway genes is largely WT p53-dependent.
Consistent with this, expression levels of these genes are significantly higher in mutant p53 tumors than that in
WT p53 tumors (Supplementary Table S3). Interestingly, expression of AURKA gene positively associates with
the other AURKA/B pathway genes in WT p53 NSCLC indicated by Pearson coefficient (˃ 0.6). However, this
positive correlation is greatly decreased in mutant p53 NSCLC (Supplementary Table S4).
High expression of cell cycle genes like AURKA/B is well-known to be associated with poor survival across
different cancers39. We asked if a correlation exists between expression of these AURKA/B pathway genes and
survival in WT p53 and mutant p53 NSCLC patients (Fig. 2A). The results showed high expression of each of
the genes associates with poor survival in WT p53 patients but not in mutant p53 patients. Later results in Fig. 3
show expression of AURKA/B pathway genes is increased in NSCLC cells upon knockdown of p53, RBL2, or
the essential DREAM component LIN37, confirming that these genes are repressed by RBL2-DREAM. These
results suggest RBL2-DREAM mediated repression of AURKA/B pathway genes is important for p53-mediated
tumor suppression and improved outcome in NSCLC. As expected, expression of p53 activated genes CDKN1A
(p21), MDM2, and BBC3 (Puma) did not correlate with NSCLC patient outcome in TCGA when the cases were
separated by p53 status (Supplementary Fig. S1). The results indicate expression changes of these p53 targets do
not by themselves influence NSCLC survival.
Although RB1 expression does not associate with outcomes in WT p53 NSCLC, we noticed that E2F1 expres-
sion negatively correlated with RBL2 (Supplementary Table S2) consistent with reports the E2F1 gene is repressed
by RBL240. Kaplan–Meier analysis showed that high expression of E2F1 also associated with significantly reduced
survival in WT p53 but not mutant p53 NSCLC patients (Fig. 2B). These results suggest that high expression of
RBL2 might contribute to improved outcomes in WT p53 NSCLC patients in part by repressing E2F1 expression.
p53, RBL2, and LIN37 regulate AURK pathway gene expression and therapy sensitivity in
WT p53 NSCLC cell lines. We speculated RBL2-mediated repression of AURKA/B pathway genes could
improve outcome in p53 WT NSCLC patients by increasing cancer cell and tumor sensitivity to NSCLC therapy
agents. To test this, we first examined RNAseq data from the Cancer Cell Line Encyclopedia (CCLE) to stratify
p53 WT NSCLC cell lines based on their relative expression of RBL2. Using median RBL2 expression as a ref-
erence, we found H1666 cells express high levels of RBL2 (expression above the median), H460 cells express
relatively low RBL2, and HTB53 and A549 cells have RBL2 expression levels at or near the median (Table 2A).
We further analyzed the CCLE RNAseq data and found expression of AURKA/B pathway factors is inversely
correlated with expression of RBL2. Thus, in H1666 cells that have high RBL2 expression, all 22 AURKA/B path-
way genes were expressed below the median while in H460 cells (low RBL2 expression), 18 out of 22 AURKA/B
genes were expressed above the median (Table 2A). HTB53 and A549 cells showed intermediate expression of
the AURKA/B pathway genes (in HTB53 11 out of 22 AURKA/B genes were expressed above the median, and in
A549 14 out of 22 AURKA/B genes were expressed above the median) (Table 2A).
The findings in Table 2A support a correlation between high RBL2 expression and low expression of
AURKA/B genes in p53 WT NSCLC cell lines. To examine this further, we knocked down p53 or RBL2 in
Scientific Reports | (2022) 12:1049 | https://doi.org/10.1038/s41598-022-05013-4 3
Vol.:(0123456789)www.nature.com/scientificreports/
A.
ANLN AURKA AURKB BUB1B CDC20 CENPE CENPF CENPL
P=0.000 P=0.002 P=0.004 P=0.001 P=0.008 P=0.002 P=0.048 P=0.114
WT p53
Survival probability
Mutant p53
P=0.468 P=0.75 P=0.317 P=0.969 P=0.672 P=0.737 P=0.938 P=0.482
CENPN ERCC6L INCENP KIF11 KIF23 KIF4A MKI67 NCAPH
P=0.002 P=0.002 P=0.001 P=0.001 P=0.001 P=0.001 P=0.003 P=0.000
WT p53
Survival probability
P=0.942 P=0.872 P=0.051 P=0.891 P=0.371 P=0.836 P=0.66 P=0.149
Mutant p53
NUSAP1 PLK1 SPAG5 SGOL1 TACC3 TPX2
P=0.003 P=0.000 P=0.001 P=0.01 P=0.009 P=0.000
WT p53
Survival probability
P=0.21 P=0.85 P=0.89 P=0.647 P=0.11 P=0.618
Mutant p53
Time lapsed (days)
High expression (≥median) Low expression (www.nature.com/scientificreports/
A. H1666 H1666
2.5 2.5
2
Relative mRNA
2
Relative mRNA
1.5 1.5
1 1
0.5 0.5
0 0
AURKA
AURKB
CENPE
CENPF
CENPN
INCENP
KIF4A
KIF23
NCAPH
NUSAP1
RBL2
SGOL1
SPAG5
MKI67
ERCC6L
TACC3
PLK1
AURKA
AURKB
CENPE
CENPF
CENPN
INCENP
KIF4A
KIF23
NCAPH
NUSAP1
SGOL1
SPAG5
p53
MKI67
ERCC6L
TACC3
PLK1
Ctrl siRNA p53 siRNA-p p53 siRNA-s Ctrl siRNA RBL2 siRNA-p RBL2 siRNA-s
H1666 H2030
2.5 2.5
Relative mRNA
Relative mRNA
2 2
1.5 1.5
1 1
0.5 0.5
0 0
AURKA
AURKB
CENPE
CENPF
CENPN
INCENP
KIF4A
KIF23
NCAPH
NUSAP1
SGOL1
SPAG5
RBL2
MKI67
ERCC6L
TACC3
PLK1
AURKA
AURKB
CENPE
CENPF
CENPN
INCENP
KIF4A
KIF23
NCAPH
NUSAP1
SGOL1
SPAG5
LIN37
MKI67
ERCC6L
TACC3
PLK1
Ctrl siRNA LIN37 siRNA-p LIN37 siRNA-s Ctrl siRNA RBL2-siRNA-p RBL2 siRNA-s
H2030
2
Relative mRNA
1.5
1
0.5
0
AURKA
AURKB
CENPE
CENPF
CENPN
INCENP
KIF4A
KIF23
NCAPH
NUSAP1
SGOL1
SPAG5
LIN37
MKI67
ERCC6L
PLK1
TACC3
Ctrl siRNA LIN37-siRNA-p LIN37 siRNA-s
B. H460
H460
2.5 1.6
1.4
Relative mRNA
Relative mRNA
2 1.2
1.5 1
0.8
1 0.6
0.4
0.5 0.2
0 0
AURKA
AURKB
CENPE
CENPF
CENPN
INCENP
KIF4A
KIF23
NCAPH
RBL2
NUSAP1
SGOL1
SPAG5
MKI67
ERCC6L
TACC3
PLK1
AURKA
AURKB
CENPE
CENPF
CENPN
INCENP
KIF4A
KIF23
NCAPH
NUSAP1
SGOL1
SPAG5
p53
MKI67
ERCC6L
TACC3
PLK1
Ctrl siRNA p53 siRNA-p p53 siRNA-s Ctrl siRNA RBL2 siRNA-p RBL2 siRNA-s
C. A549
3
2.5
Relative mRNA
2
1.5
1
0.5
0
AURKA
AURKB
CENPE
CENPF
CENPN
INCENP
KIF4A
KIF23
NCAPH
NUSAP1
SGOL1
SPAG5
MKI67
ERCC6L
TACC3
PLK1
p53+/+ p53-/-
Figure 3. Depletion of p53/RBL2/LIN37 increases expression of the AURKA/B pathway genes. (A,B) H1666,
H2030, H460 were transfected with control siRNA, RBL2 siRNA (pooled and single), p53 siRNA (pooled
and single), or LIN37 siRNA (pooled and single) for 24 h and then analyzed for gene expression by qPCR.
(C) p53+/+ and p53−/− cells were analyzed the indicated gene expression. Average relative mRNA (three
independent experiments, one sample each) of the indicated genes are presented with SD indicated. Statistical
analyses are shown in Supplementary Table S5–S12.
Scientific Reports | (2022) 12:1049 | https://doi.org/10.1038/s41598-022-05013-4 5
Vol.:(0123456789)www.nature.com/scientificreports/
Table 2. A. WT p53 NSCLC cell lines with different expression levels of RBL2 and AURKA pathway genes. B.
RBL2 and AURKA pathway genes in H1666 vs H2030 cell lines.
expression levels of a majority of the AURKA/B pathway genes while modestly increasing expression in 4–5 of
the genes (Fig. 3A). Finally, we compared expression of these AURKA/B pathway genes in A549 cells in which
p53 is either intact (p53+/+ or Crispr-deleted (p53−/−). A549 p53−/− cells showed higher expression of the
AURKA/B pathway genes (Fig. 3C). In total, the results indicate AURKA/B genes are repressed by p53-RBL2
DREAM also in NSCLC cell lines.
Next we compared the sensitivity of these NSCLC cell lines to two NSCLC therapy agents, paclitaxel (PTX)
and irradiation (IR). First, H1666, HTB53, A549, H460 cells were treated with increasing doses of PTX and cell
proliferation and viability analyzed by MTT assay. The results showed that H1666 (high RBL2 and low AURKA/B
pathway gene expression) are most sensitive to PTX while H460 cells (low RBL2 and high AURKA/B pathway
gene expression) are most resistant (Fig. 4A). HTB53 and A549 cells showed an intermediate level of sensitivity.
Next, we treated the cells with different doses of PTX and IR and analyzed colony forming ability in H1666,
HTB53, H460, A549 p53+/+ and A549 p53−/− cells. H1666 cells were again found to be most sensitive among
the cell lines, showing a pronounced reduction in colony formation in response to both PTX and IR (Fig. 4B,C
and Supplementary Fig. S2). In contrast, H460 cells were most resistant, while HTB53 and A549 p53+/+ showed
intermediate reductions in colony formation in response to both PTX and IR (Fig. 4B,C, Supplementary Fig. S2).
Compared to A549 p53+/+ cells, A549 p53−/− cells had significantly increased colonies in response to PTX or
IR (Fig. 4B,C). These results suggest high expression of RBL2 and low expression of AURKA/B pathway genes is
associated with PTX and IR sensitivity, while low expression of RBL2 and high expression of AURKA/B pathway
genes is associated with PTX and IR resistance. The PTX and IR sensitivity is in part p53-dependent.
Lastly, we wished to test directly if p53-RBL2-DREAM-mediated repression confers therapy sensitivity in
NSCLC cells. To this end, we siRNA-depleted p53, RBL2, or LIN37 in H1666 cells, treated the cells with PTX
or IR, and monitored colony forming ability. As shown in Fig. 5A–C and Fig. S3, knockdown of p53, RBL2, or
LIN37 significantly increased colony formation in response to PTX or IR in H1666 cells. This supports the idea
that p53-RBL2 DREAM confer PTX and IR sensitivity.
Aurora kinase inhibition induces p53 and increases therapy sensitivity in p53 WT NSCLC
cells. AURKA and AURKB have been reported to phosphorylate and activate MDM241,42, leading to p53
degradation. We reasoned that if high expression of AURKA/B contribute to therapy resistance in p53 WT
NSCLC cells, then inhibition of AURKA/B would sensitize the cells to therapy and this would occur in a man-
ner that is at least partially p53-dependent. To test this, we treated the relatively insensitive H460 cells with
Scientific Reports | (2022) 12:1049 | https://doi.org/10.1038/s41598-022-05013-4 6
Vol:.(1234567890)www.nature.com/scientificreports/
A. PTX response
1.2
Cell lines IC50 (μM)
Relative MTT absorbance
1 H1666 0.00014
HTB53 0.00075
0.8 A549 0.0016
H460 0.0075
0.6
0.4
0.2
0
0.000002
0.000005
0.001
0.002
0.005
0
0.0001
0.0002
0.0005
0.1
0.2
0.5
1
0.00001
0.00002
0.00005
0.01
0.02
0.05
PTX (μM):
H460 A549 HTB53 H1666
B.
H460 HTB53 H1666 A549 p53+/+ A549 p53-/-
120 140.0 120.0 120
% Colony formation
100 120.0 100.0 100
80 100.0 80.0 80
80.0
60 60.0 60
60.0
40 40.0 40
40.0
20 20.0 20.0 20
0 0.0 0.0 0
C.
H460 HTB53 H1666 A549 p53+/+ A549 p53-/-
120 120.0 120.0 120
% Colony formation
100 100.0 100.0 100
80 80.0 80.0 80
60 60.0 60.0 60
40 40.0 40.0 40
20 20.0 20.0 20
0 0.0 0.0 0
NT 2GY 4GY 6GY NT 2GY 4GY 6GY NT 2GY 4GY 6GY NT 2GY 4GY 6GY
Figure 4. Cells with high RBL2/low AURKA/B pathway genes are sensitive to PTX and irradiation therapies. (A)
The indicated cell lines were plated in 96-well plates and treated with the indicated doses of PTX for 72 h and then
analyzed with MTT. Relative average (8 technical replicate from one experiment) MTT absorbance is presented
with SD indicated. (B) The indicated cell lines were treated with increasing doses of PTX (μM) for 48 h and then
allowed to recover in drug-free media for 2–4 weeks. % average (3 technical replicate from one experiment)
formed colonies are presented with SD indicated. There are significant differences (p < 0.05) between H460 and
A549 p53+/+ cells treated with 1 μM, 5 μM, and 10 μM of PTX. There are significant differences (p < 0.01) between
H460/A549 and HTB53/H1666 cells treated with all doses of PTX. There are significant differences (p < 0.05)
between HTB53 and H1666 cells treated with all doses of PTX. There are significant differences (p < 0.05) between
A549 p53+/+ and A549 p53−/− cells treated with 1 μM, 5 μM, and 10 μM of PTX. (C) The indicated cell lines
were treated with 2 Gy, 4 Gy, or 6 Gy irradiation and then allowed to recover for 2–4 weeks. % average (3 technical
replicate from one experiment) formed colonies are presented with SD indicated. There is no significant difference
(p > 0.05) between H460 and A549 treated with all the doses of irradiation. There are significant differences
(p < 0.01) between H460/A549 and HTB53/H1666 cells treated with all doses of irradiation. There are significant
differences (p < 0.05) between HTB53 and H1666 cells treated with all doses of irradiation. There are significant
differences (p < 0.05) between A549 p53+/+ and A549 p53−/− cells treated with all doses of irradiation.
Scientific Reports | (2022) 12:1049 | https://doi.org/10.1038/s41598-022-05013-4 7
Vol.:(0123456789)www.nature.com/scientificreports/
A. C.
Relative mRNA
1.2 1.2 1.2
% Colony formation
120.0
100.0 1 1 1
0.8 0.8 0.8
80.0
0.6 0.6 0.6
60.0 0.4 0.4
0.4
40.0 0.2 0.2
0.2
20.0 0 0
0
0.0
Ctrlsi
LIN37si-p
LIN37si-s
Ctrlsi
RBL2si-p
RBL2si-s
Ctrlsi
p53si-p
p53si-s
Vehicle PTX 0.2 PTX 0.5 PTX 1
D.
ALS: – – – + + +
B.
4GY: – + – – + –
PTX: – – + – – +
% Colony formation
120.0
100.0 150 pTACC3
80.0 (S558)
60.0 150 TACC3
40.0
20.0 p53
0.0 50
Relative p53 signal: 1 1.8 2.4 2.5 2.5 3.6
50 Actin
30
Vehicle 2 Gy 4 Gy H460
E. F.
H460 H460 H460 H460
H460
% Colony formation
120
% Colony formation
120.0 1.2
120 120
% Colony formation
100
% Colony formation
100.0 1
100 100 0.8
80 80.0
80 80 0.6
60 60 60.0
60 0.4
40 40 40.0 0.2
40
20 20 20.0 0
20 0 0 0.0
0
Vehicle ALS Ctrl siRNA
INCENP siRNA
G. p53 +/+ p53 -/- H.
ALS: – + – + – + – + A549 A549
4GY: – – + + – – + +
% Colony formation
120 120.0
50 p53 100 100.0
80 80.0
Relative p53 signal: 1 3.9 1.9 4.4 0 0 0 0
60 60.0
50 40
Actin 40.0
30 20 20.0
p53 +/+ p53 -/- 0 0.0
ALS: – + – + – + – +
PTX: – – + + – – + +
50 p53
p53 +/+ p53 -/- p53 +/+ p53 -/-
Relative p53 signal: 1 3.5 3.6 3.7 0 0 0 0
50 Actin
30
Scientific Reports | (2022) 12:1049 | https://doi.org/10.1038/s41598-022-05013-4 8
Vol:.(1234567890)www.nature.com/scientificreports/
◂Figure 5. p53/RBL2 regulates response to PTX and irradiation. Alisertib sensitizes cells to PTX/irradiation
partially dependent on p53. (A,B) H1666 and cells were transfected with control siRNA, RBL2 siRNA (pooled
and single), p53 siRNA (pooled and single), and LIN37 siRNA (pooled and single), then treated with the
indicated doses of PTX (μM) for 48 h or irradiation. Cells were allowed to recover in drug-free media for
2–4 weeks. % average (three technical replicate from one experiment) formed colonies are presented with
SD indicated. Statistical analyses are shown in Supplementary Table S13. Reduced gene expression in siRNA
transfected cells is shown in (C). (D) H460 cells were treated with PTX (1 μM) or irradiation (4 Gy) in the
absence or presence of alisertib (ALS, 0.1 μM) for 24 h. Lysates were immunoblotted for the indicated proteins
(original immunoblot images are shown in Supplementary Fig. S5, representative images of at least two
independent experiments). (E) and (F) H460 cells were treated with PTX (5 μM) or irradiation with or without
ALS (50 nM) for 48 h (E). H460 cells were transfected with control siRNA or INCENP siRNA and then treated
with PTX (5 μM) or irradiation (F). Cells were allowed to recover in drug-free media for 2 weeks. % average
(three technical replicate from one experiment) formed colonies are presented with SD indicated. Statistical
analyses are shown in Supplementary Table S14 and S15. (G) p53+/+ and p53−/− A549 cells treated with
PTX (1 μM) or irradiation (4 Gy) with or without ALS (0.1 μM) for 24 h. Lysates were immunoblotted for the
indicated proteins (original immunoblot images are shown in Supplementary Fig. S5, representative images of at
least two independent experiments). (H) p53+/+ and p53−/− A549 cells treated with PTX (5 μM) or irradiation
(4 Gy) with or without ALS (0.1 μM) for 48 h. % average (three technical replicate from one experiment) formed
colonies are presented with SD indicated. Statistical analyses are shown in Supplementary Table S16.
either vehicle or the AURKA/B inhibitor alisertib in combination with PTX or IR. The microtubule stabil-
ity regulator TACC protein is a substrate of AURKA43. We monitored phosphorylation of TACC3 to confirm
Alisertib was active. As shown in Fig. 5D, TACC phosphorylated at S558 (AURKA phosphorylation site) was
increased in H460 cells treated with PTX and IR but not in cells co-treated with Alisertib, confirming Alisertib
inhibited AURKA. Importantly, Alisertib significantly sensitized H460 cells to both PTX and IR (Fig. 5E and
Supplementary Fig. S4A–D), consistent with the idea that high AURKA/B promote therapy resistance in these
cells. To examine this further, we tested if knockdown of an AURKA/B pathway factor would increase PTX/
IR sensitivity. INCENP (Inner Centromere Protein) plays an important role in the aurora kinase pathway by
activating AURKB. As shown in Fig. 5F and Supplementary Fig. S4E–H, INCENP knockdown also significantly
reduced colony formation in H460 cells basally and in combination with PTX or IR, further supporting that
the AURKA/B pathway contributes to therapy resistance. Notably, p53 levels were modestly increased in PTX/
IR-treated A549 cells, but increased to a higher level in cells treated with Alisertib alone or Alisertib plus PTX/
IR (Fig. 5G). The increase in p53 by Alisertib treatment is consistent with AURKA/B maintaining p53 at low
levels. Lastly, we found that alisertib stabilized p53 in A549 p53+/+ cells (Fig. 5G) and sensitized these cells to
PTX and IR to a slightly greater extent than A549 p53−/− cells (Fig. 5H and Supplementary Fig. S6). This is
consistent with the idea that p53 contributes to therapy-sensitization by Alisertib. In total, the results support
p53-RBL2-mediated repression of AURK pathway genes contributes to improved therapy responses and better
patient outcome in p53 WT NSCLCs.
Discussion
P53 functions as a tumor suppressor by activating or repressing genes involved in cell cycle progression and apop-
tosis. Wild-type p53 is activated in response to chemotherapeutic drug treatment, radiation, and other stresses.
Accordingly, p53 wild-type status has been associated in several studies with improved tumor therapy responses
and better patient outcomes. However, other studies have reported no such association. The reason for these dif-
ferences is unclear, but could result from reduced expression of p53 effector molecules in p53 wild-type cancers
or heightened expression of p53 negative regulators, such as MDM2. The ability of p53 to repress transcription
requires repressive members of the RB-family (RBL1, RBL2) and formation of a transcription repressor complex
termed DREAM. However, the role of RBL1/2 and DREAM in p53-mediated tumor therapy responses and/or
patient outcomes has not been established. Results from the current study indicate transcription repression via
RBL2-DREAM contributes to tumor therapy responses and improved patient outcomes in p53 WT NSCLC.
High RBL2 expression was associated with better outcome in p53 wild-type but not p53 mutant NSCLCs.
This supports the idea that RBL2 contributes to p53-mediated tumor suppression in this cancer. Uxa et al. identi-
fied 268 genes that are repressed through the p53-DREAM pathway. From these we identified 140 genes whose
expression is inversely correlated with RBL2. The inverse correlation with RBL2 suggests these genes may be
repressed in a RBL2-DREAM-dependent way. Notably, however, although the inverse correlation of these 140
genes with RBL2 is stronger in WT p53 tumors than mutant tumors, 82 of the genes remain negatively correlated
with RBL2 in mutant p53 tumors (Supplementary Table S2). This implies that RBL2 can also repress transcription
of genes in a manner independent of WT p53. Indeed, in G0 and early G1 phase, the CDK inhibitor p27 can bind
and inactivate cyclin E-CDK2 complexes and block CDK2-mediated phosphorylation of p107/p130 which is
p53-independent44. Interestingly, Kim et al. recently showed that DREAM complex can repress a subset of genes
in a p53-independent manner, indicating other factors such as PAF can additionally regulate DREAM activity to
repress cell cycle genes45. Future studies may reveal more factors and mechanisms underlying p53-independent
DREAM complex activities. It is noteworthy that in the TCGA dataset RBL2 mRNA levels have a significantly
negative correlation with AURKA pathway gene levels in WT p53 cases. However, in a fraction of cases both
RBL2 and AURKB pathway gene levels are high, suggesting the ability of RBL2 to repress transcription is not
purely determined by gene expression levels. Other regulatory factors that control the phosphorylation of RBL2
and/or its localization may affect the ability of RBL2 to repress transcription.
Scientific Reports | (2022) 12:1049 | https://doi.org/10.1038/s41598-022-05013-4 9
Vol.:(0123456789)www.nature.com/scientificreports/
22 of the genes we identified are involved in the AURKA/B pathway that regulates mitosis. Some of these
genes have been found in previous studies to be associated with prognosis in NSCLC patients46–51, though their
relationship with wild-type p53 has not been indicated. Importantly, we found expression of each of these 22
genes associates with outcome only in wild-type p53 NSCLC patients but not mutant p53 patients. Thus, reduced
expression of these 22 genes is significantly associated with improved outcome in p53 wild-type but not mutant
NSCLCs, while heightened expression of these genes associates with worse outcome in p53 wild-type but not
mutant NSCLC patients. The results suggest p53 and RBL2-mediated repression of these AURKA/B pathway
genes may contribute to tumor suppression and improved outcome in patients with p53 wild-type NSCLC
tumors. How might heightened expression of AURKA/B and pathway genes lead to worse outcome in p53 wild-
type NSCLCs? Both AURKA and AURKB have been reported to phosphorylate p53 and/or MDM2, leading to
inhibition of p53 through degradation. Consistent with that, our results showed that Alisertib stabilized p53.
This stabilization likely resulted from either a block in AURKA/B-mediated phosphorylation and activation
of MDM2, or from mitotic stress caused by Alisertib that could stabilize p53. Thus, it is reasonable to believe
that high expression of AURKA/B may suppress p53 function to promote worse prognosis in the wild-type
p53 patients. Presumably, high expression of other AURKA/B pathway genes contribute to worse outcome by
stimulating mitosis and overall aggressiveness. However, if high expression of AURK pathway genes contributes
to worse outcome by increasing mitosis and aggressiveness, then one might expect this would be true regardless
of p53 status, which was not the case (Fig. 2). We speculate this is due to the coordinated regulation of these
genes that seems to occur in p53 wild-type tumors. Specifically, we found that all 22 genes are coordinately high
or low in p53 wild-type NSCLCs indicated by positive correlation between AURKA and the other AURKA/B
pathway genes (Supplementary Table S4), while in p53 mutant cases the genes are randomly expressed at high or
low levels and in a non-coordinated way. One possibility is that the AURKA/B pathway genes and the proteins
they encode need to be coordinately upregulated in order to efficiently increase mitosis and aggressiveness to
impact patient outcome.
Some of the AUKRA/B pathway genes in our 22 member gene set have previously been implicated in promot-
ing resistance to c hemotherapies32,52–55. We compared p53 wild-type NSCLC cell lines that express high RBL2
and low AURKA/B pathway genes with cell lines that express low RBL2 and high AURKA/B pathway genes for
their sensitivity to PTX and IR. Cells with high RBL2 and low AURKA/B pathway expression showed increased
PTX and IR sensitivity. Furthermore, knockdown of p53 RBL2, or LIN37 increased the AURKA/B pathway
gene expression and conferred PTX and IR resistance to these cells. By contrast, pharmacologic inhibition of
AURKA/B or knockdown of INCENP (AURKA/B pathway factor) increased PTX and IR sensitivity in cells with
low RBL2 and high AURKA/B pathway expression (H460 cells). These results indicate that p53-RBL2-DREAM
mediated gene repression of the AURKA/B pathway contribute to NSCLC therapy response (PTX, IR). The
AURKA/B inhibitor Alisertib increased p53 levels and, consistent with others findings35,36, we found alisertib
sensitized NSCLC cells to PTX and IR in a manner that was at least partly p53-dependent. Finally, it is worth
noting that besides the AURKA/B pathways genes, the remaining 118 genes that are repressed by the p53-RBL2-
DREAM pathway may also be important for therapy responsiveness and outcome in NSCLC.
In summary, our study has found RBL2-DREAM mediated repression of AURKA/B pathway genes associates
with improved therapy responses and better outcomes in p53 WT NSCLC. Future studies using large cohorts of
clinical patients may establish RBL2 and AURKA/B as predictive markers for therapy sensitivity and prognosis
in WT p53 NSCLC patients.
Methods
Cell lines and reagents. NSCLC cell lines H1666, HTB53, A549, and H460 are acquired from ATCC
Crispr p53 KO A549 (p53−/−) cells and control parental A549 (p53+/+) cells are a generous gift from Dr. Wil-
liam Hahn56 (Dana-Farber Cancer Institute). Cells were grown in DMEM medium, with 10% fetal bovine serum
(FBS), penicillin (100 U/mL) and streptomycin (100 µg/mL). Alisertib and paclitaxel were obtained from Selleck
Chemicals.
TCGA and CCLE RNAseq databases and bioinformatics analysis. P53 mutation status was obtained
from the Pan-lung TCGA57 in cbioportal (www.Cbioportal.org). NSCLC Gene expression and survival data
were downloaded from proteinatlas (proteinatlas.org/pathology/lung + cancer). All 994 patients from this data-
set were tested for association of p53 status or gene expression levels with survival by Kaplan–Meier curve (IBM
SPSS). Patients with ≥ median gene expression levels (FKPM) are taken as high expression (~ 50% of patients)
and < median are taken as low expression. Gene expression correlation is analyzed with Pearson co-efficiency
using Microsoft Excel.
CCLE RNAseq gene expression (RPKM) database58 for 1019 cell lines (CCLE RNAseq genes rpkm 20180929.
gct.gz) was downloaded from https://portals.broadinstitute.org/ccle/data under Current Data. The RBL2/
AURKA/B pathway gene expression was extracted from the database.
All methods were carried out in compliance with relevant guidelines and regulations.
Immunoblotting. Whole cell extracts were prepared by scraping cells in lysis buffer (150 mM NaCl, 5 mM
EDTA, 0.5% NP40, 50 mM Tris, pH 7.5), resolved by sodium dodecyl sulfate polyacrylamide gel electrophoresis
(SDS-PAGE) and transferred to polyvinylidene difluoride membranes (Thermo Fisher Scientific). Antibodies
to p53 (DO-1, SC-126) and β-actin (C4, SC-47778) were from Santa Cruz. Antibodies phospho-TACC3 (S558,
#8842) and TACC3 (#8069) were from Cell Signaling. Primary antibodies were detected with goat anti-mouse
or goat anti-rabbit secondary antibodies conjugated to horseradish peroxidase (Life Technologies), using Clarity
chemiluminescence (BIO-RAD).
Scientific Reports | (2022) 12:1049 | https://doi.org/10.1038/s41598-022-05013-4 10
Vol:.(1234567890)www.nature.com/scientificreports/
siRNA‑mediated transient knockdown. Pooled p53 siRNA, RBL2 siRNA, LIN37 siRNA and INCENP
siRNA (On-target plus smart pool) and Control siRNA (On-target plus siControl non-targeting pool) were
purchased from Dharmacon. Single siRNA for p53 (GAGGUUGGCUCUGACUGUA), RBL2 (CACUAACUG
GUGUUAGGUA), LIN37 (CUCAGACACCCACAAUAAG) were obtained from Sigma-Aldrich. Cells were
transfected according to the manufacturer’s guidelines using DharmaFECT I reagent.
RNA isolation and real‑time quantitative PCR analysis. Total RNA was prepared using Total RNA
Mini Kit (IBI Scientific, IA); the first cDNA strand was synthesized using High Capacity cDNA Reverse Tran-
scription Kit (Applied Biosystems, CA). Manufacturers’ protocols were followed in each case. The PCR primers
for the indicated genes are listed in Supplementary Table S5. SYBR green PCR kit (Applied Biosystems) was used
according to the manufacturer’s instructions. AB7300 system was used as follows: activation at 95 °C; 2 min, 40
cycles of denaturation at 95 °C; 15 s and annealing/extension at 60 °C; 60 s, followed by melt analysis ramping
from 60 to 95 °C. Relative gene expression was determined by the ΔΔCt method using β-Actin to normalize.
PCR reaction was conducted in technical triplicate and average CT values were used to calculate relative expres-
sion of genes.
Exposure of cells to irradiation. Cells were exposed to X-ray irradiation at room temperature in a
RS-2000 X-ray Biological System (Rad Source Technologies, Buford, GA) at a dose rate of 2.64 Gy/min. Cells
were treated with the following doses: 2, 4, 6 Gy.
Colony formation assay. Cells were plated in 6-well plates with 200 cells/well in triplicate for 24 h. Cells
were then treated with paclitaxel for 24 h or irradiation once and then released of drugs. Cell were allowed to
recover for 2–5 weeks to form colonies. Colonies were stained with 1% methylene blue (Sigma) in ethanol and
number of positive colonies was counted. Experiments are conducted in triplicate and repeated at least one more
time. Average value from one representative experiment is presented with SD indicated as error bars. For siRNA
transfected cells, cells were detached 24 h after transfection and then plated accordingly for different treatments.
Statistical analysis. One-way analysis of variance (ANOVA) and Student’s t-test were used to determine
the statistical significance of differences among experimental groups. Student’s t-test was used to determine the
statistical significance between control and experimental groups. For Kaplan–Meier survival analysis, Log-Rank
test was used to determine significance between patient groups with high or low expression of the genes.
Received: 16 September 2021; Accepted: 28 December 2021
References
1. Gudkov, A. V. & Komarova, E. A. The role of p53 in determining sensitivity to radiotherapy. Nat. Rev. Cancer 3, 117–129 (2003).
2. Kastenhuber, E. R. & Lowe, S. W. Putting p53 in context. Cell 170, 1062–1078 (2017).
3. Meek, D. W. Tumour suppression by p53: A role for the DNA damage response?. Nat. Rev. Cancer 9, 714–723 (2009).
4. Mirzayans, R., Andrais, B., Scott, A. & Murray, D. New insights into p53 signaling and cancer cell response to DNA damage:
Implications for cancer therapy. J. Biomed. Biotechnol. 2012, 170325 (2012).
5. Pirollo, K. F., Bouker, K. B. & Chang, E. H. Does p53 status influence tumor response to anticancer therapies?. Anticancer Drugs
11, 419–432 (2000).
6. Vazquez, A., Bond, E. E., Levine, A. J. & Bond, G. L. The genetics of the p53 pathway, apoptosis and cancer therapy. Nat. Rev. Drug
Discov. 7, 979–987 (2008).
7. Viktorsson, K., De Petris, L. & Lewensohn, R. The role of p53 in treatment responses of lung cancer. Biochem. Biophys. Res. Com-
mun. 331, 868–880 (2005).
8. Weller, M. Predicting response to cancer chemotherapy: The role of p53. Cell Tissue Res. 292, 435–445 (1998).
9. Mogi, A. & Kuwano, H. TP53 mutations in nonsmall cell lung cancer. J. Biomed. Biotechnol. 2011, 583929 (2011).
10. Kandioler, D. et al. Growing clinical evidence for the interaction of the p53 genotype and response to induction chemotherapy in
advanced non-small cell lung cancer. J. Thorac. Cardiovasc. Surg. 135, 1036–1041 (2008).
11. Gu, J. et al. TP53 mutation is associated with a poor clinical outcome for non-small cell lung cancer: Evidence from a meta-analysis.
Mol. Clin. Oncol. 5, 705–713 (2016).
12. Ahrendt, S. A. et al. p53 mutations and survival in stage I non-small-cell lung cancer: Results of a prospective study. J. Natl. Cancer
Inst. 95, 961–970 (2003).
13. Ma, X. et al. Prognostic and predictive effect of TP53 mutations in patients with non-small cell lung cancer from adjuvant cisplatin-
based therapy randomized trials: A LACE-bio pooled analysis. J. Thorac. Oncol. 11, 850–861 (2016).
14. Ko, J. L. et al. MDM2 mRNA expression is a favorable prognostic factor in non-small-cell lung cancer. Int. J. Cancer 89, 265–270
(2000).
15. Kosaka, T., Yatabe, Y., Onozato, R., Kuwano, H. & Mitsudomi, T. Prognostic implication of EGFR, KRAS, and TP53 gene mutations
in a large cohort of Japanese patients with surgically treated lung adenocarcinoma. J. Thorac. Oncol. 4, 22–29 (2009).
16. Molina-Vila, M. A. et al. Nondisruptive p53 mutations are associated with shorter survival in patients with advanced non-small
cell lung cancer. Clin. Cancer Res. 20, 4647–4659 (2014).
17. Beckerman, R. & Prives, C. Transcriptional regulation by p53. Cold Spring. Harb. Perspect. Biol. 2, a000935 (2010).
18. Miyashita, T. & Reed, J. C. Tumor suppressor p53 is a direct transcriptional activator of the human bax gene. Cell 80, 293–299
(1995).
19. Harms, K., Nozell, S. & Chen, X. The common and distinct target genes of the p53 family transcription factors. Cell Mol. Life Sci.
61, 822–842 (2004).
20. Sullivan, K. D., Galbraith, M. D., Andrysik, Z. & Espinosa, J. M. Mechanisms of transcriptional regulation by p53. Cell Death Differ.
25, 133–143 (2018).
Scientific Reports | (2022) 12:1049 | https://doi.org/10.1038/s41598-022-05013-4 11
Vol.:(0123456789)www.nature.com/scientificreports/
21. Ho, J. & Benchimol, S. Transcriptional repression mediated by the p53 tumour suppressor. Cell Death Differ. 10, 404–408 (2003).
22. Murphy, M. E. p53, transcriptional, and drug sensitivity: Fresh perspectives on an old activity. Cell Cycle 9, 4432 (2010).
23. Hafner, A., Bulyk, M. L., Jambhekar, A. & Lahav, G. The multiple mechanisms that regulate p53 activity and cell fate. Nat. Rev. Mol.
Cell Biol. 20, 199–210 (2019).
24. Engeland, K. Cell cycle arrest through indirect transcriptional repression by p53: I have a DREAM. Cell Death Differ. 25, 114–132
(2018).
25. Fischer, M., Quaas, M., Steiner, L. & Engeland, K. The p53–p21-DREAM-CDE/CHR pathway regulates G2/M cell cycle genes.
Nucleic Acids Res. 44, 164–174 (2016).
26. Uxa, S. et al. DREAM and RB cooperate to induce gene repression and cell-cycle arrest in response to p53 activation. Nucleic Acids
Res. 47, 9087–9103 (2019).
27. Mages, C. F., Wintsche, A., Bernhart, S. H. & Muller, G. A. The DREAM complex through its subunit Lin37 cooperates with Rb
to initiate quiescence. Elife 6, e26876 (2017).
28. Fischer, M., Grossmann, P., Padi, M. & DeCaprio, J. A. Integration of TP53, DREAM, MMB-FOXM1 and RB-E2F target gene
analyses identifies cell cycle gene regulatory networks. Nucleic Acids Res. 44, 6070–6086 (2016).
29. Carmena, M. & Earnshaw, W. C. The cellular geography of aurora kinases. Nat. Rev. Mol. Cell Biol. 4, 842–854 (2003).
30. Fu, J., Bian, M., Jiang, Q. & Zhang, C. Roles of Aurora kinases in mitosis and tumorigenesis. Mol. Cancer Res. 5, 1–10 (2007).
31. Carvajal, R. D., Tse, A. & Schwartz, G. K. Aurora kinases: New targets for cancer therapy. Clin. Cancer Res. 12, 6869–6875 (2006).
32. Tang, A. et al. Aurora kinases: Novel therapy targets in cancers. Oncotarget 8, 23937–23954 (2017).
33. Galetta, D. & Cortes-Dericks, L. Promising therapy in lung cancer: Spotlight on Aurora kinases. Cancers (Basel) 12, 3371 (2020).
34. Sasai, K., Treekitkarnmongkol, W., Kai, K., Katayama, H. & Sen, S. Functional significance of Aurora kinases-p53 protein family
interactions in cancer. Front. Oncol. 6, 247 (2016).
35. Tentler, J. J. et al. p53 family members regulate phenotypic response to aurora kinase A inhibition in triple-negative breast cancer.
Mol. Cancer Ther. 14, 1117–1129 (2015).
36. Liu, N. et al. Inhibition of Aurora A enhances radiosensitivity in selected lung cancer cell lines. Respir. Res. 20, 230 (2019).
37. Kettenbach, A. N. et al. Quantitative phosphoproteomics identifies substrates and functional modules of Aurora and Polo-like
kinase activities in mitotic cells. Sci. Signal 4, rs5 (2011).
38. Sardon, T. et al. Uncovering new substrates for Aurora A kinase. EMBO Rep. 11, 977–984 (2010).
39. Whitfield, M. L., George, L. K., Grant, G. D. & Perou, C. M. Common markers of proliferation. Nat. Rev. Cancer 6, 99–106 (2006).
40. Araki, K., Nakajima, Y., Eto, K. & Ikeda, M. A. Distinct recruitment of E2F family members to specific E2F-binding sites mediates
activation and repression of the E2F1 promoter. Oncogene 22, 7632–7641 (2003).
41. Katayama, H. et al. Phosphorylation by aurora kinase A induces Mdm2-mediated destabilization and inhibition of p53. Nat. Genet.
36, 55–62 (2004).
42. Lim, Y. et al. Phosphorylation by Aurora B kinase regulates caspase-2 activity and function. Cell Death Differ. 28, 349–366 (2021).
43. Lioutas, A. & Vernos, I. Aurora A kinase and its substrate TACC3 are required for central spindle assembly. EMBO Rep. 14, 829–836
(2013).
44. Fischer, M. & Muller, G. A. Cell cycle transcription control: DREAM/MuvB and RB-E2F complexes. Crit. Rev. Biochem. Mol. Biol.
52, 638–662 (2017).
45. Kim, M. J. et al. PAF remodels the DREAM complex to bypass cell quiescence and promote lung tumorigenesis. Mol. Cell 81,
1698-1714 e6 (2021).
46. Zhang, W. et al. Centromere and kinetochore gene misexpression predicts cancer patient survival and response to radiotherapy
and chemotherapy. Nat. Commun. 7, 12619 (2016).
47. Long, X., Zhou, W., Wang, Y. & Liu, S. Prognostic significance of ANLN in lung adenocarcinoma. Oncol. Lett. 16, 1835–1840
(2018).
48. Chen, H. et al. Requirement for BUB1B/BUBR1 in tumor progression of lung adenocarcinoma. Genes Cancer 6, 106–118 (2015).
49. Kato, T. et al. Overexpression of KIF23 predicts clinical outcome in primary lung cancer patients. Lung Cancer 92, 53–61 (2016).
50. Wang, J. et al. TACC3 as an independent prognostic marker for solid tumors: A systematic review and meta-analysis. Oncotarget
8, 75516–75527 (2017).
51. Wei, D. M. et al. Augmented expression of Ki-67 is correlated with clinicopathological characteristics and prognosis for lung cancer
patients: An up-dated systematic review and meta-analysis with 108 studies and 14,732 patients. Respir. Res. 19, 150 (2018).
52. Mignogna, C. et al. Aurora Kinase A expression predicts platinum-resistance and adverse outcome in high-grade serous ovarian
carcinoma patients. J. Ovarian Res. 9, 31 (2016).
53. Shah, K. N. et al. Aurora kinase A drives the evolution of resistance to third-generation EGFR inhibitors in lung cancer. Nat. Med.
25, 111–118 (2019).
54. Liu, Z., Sun, Q. & Wang, X. PLK1, a potential target for cancer therapy. Transl. Oncol. 10, 22–32 (2017).
55. Al-Khafaji, A. S. et al. Aurora B expression modulates paclitaxel response in non-small cell lung cancer. Br. J. Cancer 116, 592–599
(2017).
56. Giacomelli, A. O. et al. Mutational processes shape the landscape of TP53 mutations in human cancer. Nat. Genet. 50, 1381–1387
(2018).
57. Cancer Genome Atlas, N. Comprehensive molecular portraits of human breast tumours. Nature 490, 61–70 (2012).
58. Barretina, J. et al. The Cancer Cell Line Encyclopedia enables predictive modelling of anticancer drug sensitivity. Nature 483,
603–607 (2012).
Author contributions
L.D.: conceptualization, experimentation, manuscript drafting. R.E.P. and S.C.: experimentation. C.G.M.: con-
ceptualization, manuscript revision. All authors reviewed the manuscript.
Funding
This study was funded in part by National Cancer Institute (Grant no. R01CA200232-05) to C.G.M.
Competing interests
The authors declare no competing interests.
Additional information
Supplementary Information The online version contains supplementary material available at https://doi.org/
10.1038/s41598-022-05013-4.
Correspondence and requests for materials should be addressed to L.D. or C.G.M.
Reprints and permissions information is available at www.nature.com/reprints.
Scientific Reports | (2022) 12:1049 | https://doi.org/10.1038/s41598-022-05013-4 12
Vol:.(1234567890)www.nature.com/scientificreports/
Publisher’s note Springer Nature remains neutral with regard to jurisdictional claims in published maps and
institutional affiliations.
Open Access This article is licensed under a Creative Commons Attribution 4.0 International
License, which permits use, sharing, adaptation, distribution and reproduction in any medium or
format, as long as you give appropriate credit to the original author(s) and the source, provide a link to the
Creative Commons licence, and indicate if changes were made. The images or other third party material in this
article are included in the article’s Creative Commons licence, unless indicated otherwise in a credit line to the
material. If material is not included in the article’s Creative Commons licence and your intended use is not
permitted by statutory regulation or exceeds the permitted use, you will need to obtain permission directly from
the copyright holder. To view a copy of this licence, visit http://creativecommons.org/licenses/by/4.0/.
© The Author(s) 2022
Scientific Reports | (2022) 12:1049 | https://doi.org/10.1038/s41598-022-05013-4 13
Vol.:(0123456789)You can also read