Analysis of Spatial-Temporal Characteristics of Operations in Public Transport Networks Based on Multisource Data - Hindawi.com
←
→
Page content transcription
If your browser does not render page correctly, please read the page content below

Hindawi
Journal of Advanced Transportation
Volume 2021, Article ID 6937228, 15 pages
https://doi.org/10.1155/2021/6937228

Research Article
Analysis of Spatial-Temporal Characteristics of Operations in
Public Transport Networks Based on Multisource Data

 Hui Zhang,1 Yanjun Liu,1 Baiying Shi ,1 Jianmin Jia,1 Wei Wang ,2 and Xiang Zhao3
 1
 School of Transportation Engineering, Shandong Jianzhu University, Jinan 250101, China
 2
 School of Economics, Ocean University of China, Qingdao 266100, China
 3
 Institute of Computing Technology, China Academy of Railway Sciences, Beijing 100044, China

 Correspondence should be addressed to Baiying Shi; shibaiying@sdjzu.edu.cn

 Received 26 June 2021; Accepted 30 August 2021; Published 9 September 2021

 Academic Editor: Yong Wang

 Copyright © 2021 Hui Zhang et al. This is an open access article distributed under the Creative Commons Attribution License,
 which permits unrestricted use, distribution, and reproduction in any medium, provided the original work is properly cited.
 Operational efficiency and stability are two critical aspects to measure bus systems. Influenced by many stochastic factors, buses
 always suffer from delay and bunching. Traditional studies focus on a single route and lack research on the systematic evaluation of
 bus network. In this paper, we propose a data-driven framework to analyze the efficiency and stability based on small granularity
 GPS trajectory data from the perspective of entire bus network. The IC card data and route data are used to extract the boarding
 passenger number and topological structure, respectively. The results show that the average headway of stations follows a
 lognormal distribution. Moreover, the distribution of arrival efficiency of stations is inhomogeneous and a small number of
 stations have large values. In addition, the relationships among average headway of stations, boarding passenger number, bus
 number, and complex network indicators are revealed. It is found that the average headway of station is negatively correlated with
 other indicators, which implies that complex network connections and more passenger flows could weaken the efficiency of bus
 operations. This paper provides a way to evaluate the operational performance of bus networks and could give help for monitoring
 and optimizing the daily operation of bus systems.

1. Introduction spread all over the network. So, it is imperative to construct a
 robust public transport system to provide better service.
Nowadays, public transport plays a growing role in allevi- The development of public transport information
ating traffic congestion and reducing greenhouse gas technology provides a powerful tool to monitor and manage
emission. Building effective, convenient, and stable public the transportation system. The Automatic Vehicle Location
transport has become a crucial step to solve urban traffic (AVL) system and Automatic Passenger Count (APC)
problems in many countries. The efficiency and stability of system could record the travel trajectory and passenger
public transport are two core problems that are concerned information. In recent years, many studies focused on travel
by both travelers and operators. Affected by many stochastic time, delay, and reliability of buses based on AVL data [5–7].
factors such as weather, congestion, passenger flow, and To address these problems, numerous control strategies have
drivers’ behavior, bus delay and bunching occur in many been proposed, like speed control [8], holding strategies
routes during the operation time [1–4]. Bus bunching is that [9, 10], and skip-stop strategies [11]. The prediction methods
the adjacent buses belonging to the same route are too close give great help to improve the control effects, which is better
to each other. Bus bunching could impact the uniformity of than traditional models without predictions [12]. High-
buses and lead to big interval from the other buses, which resolution bus GPS data could also be used to identify
enhance passengers’ waiting time and result in low effi- congestion hotspots in the urban street [13]. The APC data
ciency. In some bus systems with dense stations and large are commonly used to extract OD information, estimate
passenger flow, a small disturbance of buses in a route may waiting time, and find missing transfers [14–16]. Recently,

2 Journal of Advanced Transportation

some researchers use APC data to identify public transit In this study, we conduct a data-driven framework to
corridors and transit network flow characteristics [17, 18]. measure the operational status of bus network-based in-
Typically, the bus operational status can be achieved by AVL corporating GPS trajectory data, IC card data, and route
data incorporating APC data [19]. data. First, we propose average headway of station and
 Essentially, the delay and bunching of bus are caused by average arrival rate of station to assess the stability and
small disturbances such as more boarding passengers and efficiency of bus network. Second, the relationships among
bad traffic condition of road. These small disturbances may the two proposed indicators, boarding passengers, bus
spread, superpose, and amplify, which results in heavy supply, and topological structure are studied. This paper
disorder of the entire bus system. The public transit system is aims to construct a framework based on multisource data to
a complex spatiotemporal network embedded in compli- evaluate the operation of bus systems. The rest paper is
cated urban surroundings [5]. Understanding the mecha- organized as follows. Section 2 gives the literature review.
nism of bus operation is conducive to enhance the efficiency Section 3 proposes evaluation indicators of bus network
of transit service. Most researches have focused on a single performance. Section 4 introduces the data used in this
route [8, 20], and few studies pay attention to the whole paper. Section 5 shows the results. Section 6 concludes the
transit network’s operational stability. The structures and paper.
dynamics of bus networks are so complicated. In the past
years, researchers studied the bus networks from complex 2. Literature Review
network perspective using line information and IC card data
[21–23]. They pay main attention to the structure charac- 2.1. Application of Locator Data in Transportation Area.
teristics of bus such as community structure and “small The GPS trajectory data are space-time continuum, which is
world.” the foundation to study bus operation status and residents’
 Recently, there are many researches focusing on extract activity. In transportation area, it has been widely applied in
bus network characteristics by merging AVL data and APC travelers’ behavior, estimation of traffic demand, traffic
data. Chen et al. used IC card data and GPS data to estimate status, and traffic model optimization. The GPS trajectory
passenger boarding and alighting station of the entire bus data are playing a more and more important role in traffic
and found that passenger flow is mainly distributed in an planning and management. In some areas, it has become an
east-west belt-shaped downtown area [19]. Sui et al. con- alternative to traditional traffic survey.
structed a layered network model to depict public transport At present, the studies of travelers’ behavior and esti-
network, OD flows, and transfer flows [24]. The data-driven mation of traffic demand concentrated on taxi trajectory
methods appear to analyze the whole bus network per- data and mobile phone data. Tang et al. divided the studied
formance in recent years. Zhang et al. studied the average area into small cells and estimated the distribution of OD
headway and headway deviation of the entire bus network [32]. Zhang et al. utilized complex network theory to reveal
in Jinan, China, and found that the two indicators follow the urban traffic demand based on taxi trajectory data [33].
lognormal distributions [25]. Iliopoulou et al. used AVL Mobile data are a good source to study travelers’ behavior,
data to identify spatiotemporal patterns of bus bunching by which is a research hotspot [34, 35]. Dockless bike sharing is
clustering method. However, they did not study the pas- an emerging traffic mode, which plays a significant role in
senger flow factor due to the lack of APC data [26]. connecting with other traffic modes. The trip data can be
Nowadays, network-based studies using big data have been used to analyze travelers’ behavior, traffic demand estima-
successfully applied in many transportation systems tion, and bicycle rebalance [36–38]. In the transit area, there
[27–31]. are many researches that focus on travel time prediction and
 Most aforementioned studies focus on the operational delay [5, 39]. The GPS trajectory data could reflect the
performance of a single route using AVL data. However, operational status of bus, which is crucial for operation
there is limited research for the whole network. Actually, the management. Besides that, the trajectory data can be used to
operational performance of bus network is more significant detect the travelers’ behavior incorporating IC card. Tu et al.
in bus network design and optimization of operation. For studied the dynamic characteristics of multimode travel by
example, planners consider passenger flow, network struc- trajectory data, IC card data, and taxi trajectory data [40].
ture, accessibility, and transfer when designing or adding Tang et al. used GPS trajectory data and smart card data to
new routes. They rarely consider the operation performance optimize the timetable of the bus line [41]. The GPS tra-
systematically. Therefore, there exist many stations having jectory data could also be used to identify transportation
very bad operation performance. Passengers should wait a mode by GIS information and machine learning methods
long time or suffer from bus bunching at these stations. This [42, 43].
is a big problem for bus systems. At present, the network-
based studies of bus network concentrated on the topo-
logical structure rather than operational performance. How 2.2. Operational Stability of Public Transport. The opera-
to evaluate the bus operation performance and find the hub tional stability of public transport has drawn much at-
stations is the key to solve the problem. To fill this gap, this tention since the AVL and APC devices were applied.
paper designs proper indicators based on GPS trajectory Chepuri et al. pointed out that the travel times during peak
data to evaluate the operational performance of the entire hours followed normal distributions [44]. Fan and
bus network. Machemehl verified the relationship between the waiting

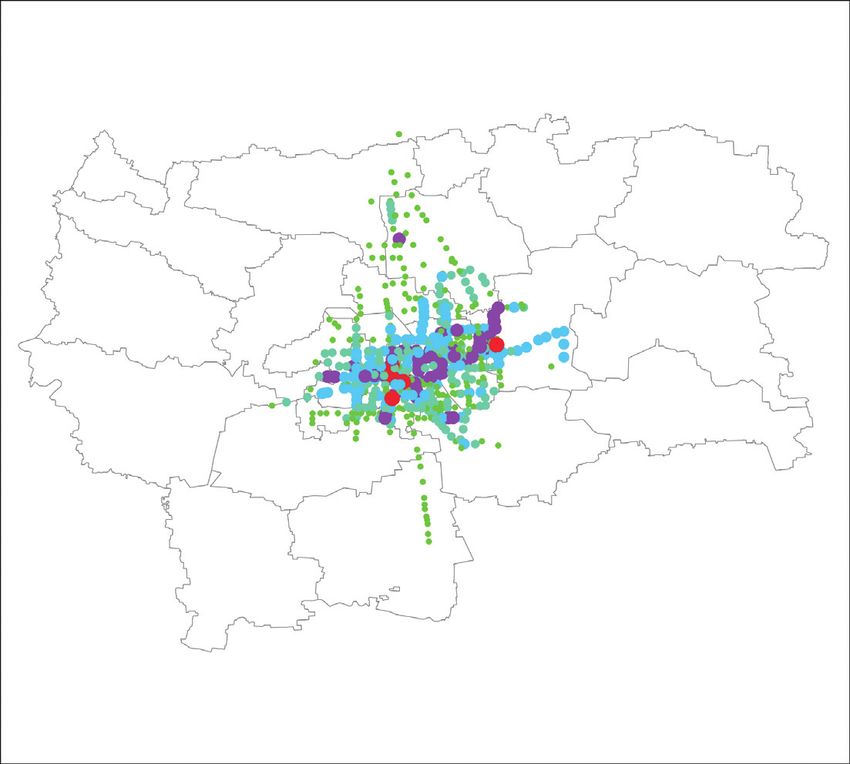
Journal of Advanced Transportation 3

time of passengers and headway deviation and they found a 3. Evaluation Indicators of Bus
positive relationship between them [45]. The travel time of Network Performance
bus contains running time and stopping time. Studies show
that the running time is affected by traffic conditions of The performance of a bus network is significant in daily
roads and traffic signals [46, 47]. Kieu et al. analyzed the operations. Reliability and efficiency are two key indicators
distribution of transit travel time used transit signal pri- to measure the performance of bus systems. Headway is an
ority data and found that they followed lognormal dis- important indicator to study the reliability. The headway
tributions [48]. The stopping time comprises door opening, between adjacent buses varies, affected by many stochastic
door closing, and the time of passengers boarding and factors such as traffic congestion and bad weather. The GPS
alighting. Research shows that the time of stopping could trajectory data are a feasible source to detect the operational
account for 26% of total travel time [49]. Generally, the status of buses. Figure 1 shows the GPS trajectory data of bus
main factor that impacts the stopping time is the number of routes. Traditional studies mainly focus on the operational
boarding and alighting passengers [50]. Ji et al. claimed that status of a single route. In this paper, we use the average
enlarging the platform areas and installed guide guardrails headway of stations and the average arrival rate of stations to
could reduce the variation of dwell time, but not the time evaluate the operational performance of bus networks. We
[51]. Passengers’ arrival times are related to the headway. intend to extract the macroscopic operation status of bus
When the headway is smaller than 12 minutes, passengers networks by mining the GPS trajectory data.
arrive randomly [45]. Chepuri et al. proposed new reli-
ability indicators to measure the bus route by trajectory
 3.1. Average Headway of Stations. The bus run is considered
data from both route level and segment level [52]. Paudel
 as a series of events that comprises section running, arrivals,
revealed that high volumes of bus ridership could cause a
 and departures. Headway is the time difference between two
significant increase in the variance of bus service
 successive vehicles belonging to the same routes. It is defined
reliability [53].
 as [25]
 ⎨ 0,
 i,j ⎧
 j � 1,
2.3. Evaluation of Transit System. The service quality of the ΔHk � ⎩ i,j+1
 i,j (1)
 hk − hk , otherwise,
transit system is influenced by many components such as
transit network structure and management level. The i,j
 where ΔHk is the headway between vehicle j and the former
transit systems are fragile when they meet periodic pas-
 vehicle of line i at station k; set the headway for the first
senger flow fluctuations and other stochastic factors. It is i,j
 vehicle as 0; hk is the arrival time of vehicle j of line i at
necessary to grasp the operational status of the transit
 station k.
system. Traditional studies focused on a single route rather
 Generally, the headways of buses are even according to
than the entire network. From the evaluation of transit
 their schedule timetable when they depart at original sta-
network perspective, there have been various researches in
 tions. The headways fluctuate due to the complicated ex-
the past years. Zhang et al. constructed the evaluation
 ternal environment and drivers’ factors. Sometimes, the
framework which includes convenience, comfort, security,
 headway between two consecutive buses is smaller than the
reliability, and facility level according to survey data [54].
 plan headway. When the headway is too small that two
Lots of studies analyzed transit network topology struc-
 consecutive buses arrive at the same time, the bus bunching
ture using complex network theory [55–57]. Sun et al.
 appears. On the contrary, there is larger headway. Figure 2
estimated the transit ridership by points of interest [58].
 shows the four kinds of bus operation status. Bus bunching
Chen et al. used GPS trajectory data and IC card data to
 and large headway disturb the balance of operation, which
estimate the number of boarding and alighting passengers
 could result in long waiting time for passengers.
and the distributions of passenger flow [19]. Illiopoulou
 In this paper, the average headway of stations during
et al. used the clustering method to distinguish different
 time period t is defined as
types of bus bunching [26]. Zuo et al. proposed a holistic
accessibility measurement considering land use, timeta- mt nit i,j
 t ΔHk
ble, and individual factors to evaluate the bus system [59]. ΔHk � t , (2)
Zhang et al. identified the bus station patterns based on i�1 j�1 sk
network structure, operational status, and POI data [60].
 where mt is the number of routes that stop at station k, nit is
Wei et al. highlighted the bus lines value and proposed a
 the number of buses of route i during time period t, and stk is
“line-line” network to examine the spatial characteristics
 the total number of buses that stop at station k during time
of cross-administration bus lines [61]. Bree et al. studied
 period t.
the relationship between transit ridership and local ac-
cessibility and found that it was more closely to predict
public transit ridership when including gravity-based 3.2. Average Arrival Rate of Stations. Bus operational effi-
accessibility in the model [62]. All in all, there were many ciency is crucial for passengers, which could reflect the
studies on the evaluation of transit system, but there is quality of service. In this paper, we introduce the average
little study focus on the operational status of the entire arrival rate of stations to measure the operational efficiency
transit network. of the entire bus network. It is defined as the mean value of
4 Journal of Advanced Transportation

 N
 Line Z1 Line 71 Line 29
 Line Y6 Line 7 Line 2
 Line Y3 Line 69 Line 19
 Line Y1 Line 66 Line 17
 Line K4 Line 61 Line 12
 Line K3 Line 601 Line 11
 Line K2 Line 6 Line 105
 Line K1 Line 5 Line 104
 Line C1 Line 4 Line 103
 Line 99 Line 36 Line 102
 Line 9 Line 33 Line 101
 Line 8 Line 31 Line 10
 Line 72 Line 3 Line 1

 0 2 4 8 12 16
 KM

 Figure 1: GPS trajectory points of bus lines.

time of the nearest bus that runs to a station at a certain time. indicators to study the relationship between bus network
This index is correlated with the position of the buses. When structure and operational performance.
a bus delays, the operational efficiency decreases. It is known
that the time of sending GPS message is out of synchro-
nization. To solve the problem, we introduce a small time 3.3.1. Node Degree. Node degree is defined as the number of
period and choose the last GPS message in the time period. nodes that are connected with the node. Typically, nodes
 The average arrival rate of stations is defined as with a very large degree account for a very small proportion.
 It is defined as
 ⎪
 ⎧ 1
 ⎪
 ⎪
 ⎪ k L Oi k c Δt
 , tkij − tcij ≥ 0, N
 ⎪
 ⎨ 1/sΔt i�1 j�1 tij − tij + Δt cijk ki � eij ,
 t (4)
 λk � ⎪ j≠i
 ⎪
 ⎪
 ⎪
 ⎪
 ⎩ 0, tkij − tcij < 0, where ki denotes the degree of node i, eij is the connection
 (3) status between node i and node j, and eij � 1 means that there
 exist connections between node i and node j; otherwise eij � 0.
where L is the number of bus routes, Oi is the number of buses
of i-th route that running to k station, Δt is the given time
period, Δt ≥ max(tsend ), tsend is the time interval of sending 3.3.2. Betweenness. In transportation networks, transport
message, tkij is the arrival time of i-th route of j-th vehicle at efficiency is very crucial. Betweenness is another index to
station k, tcij is the last message time of i-th route of j-th vehicle evaluate the importance of nodes in propagation. It is cal-
in the time period t + Δt, and skΔt is the number of buses that culated as follows:
runs to station k. cΔt ijk � 1 if i-th route of j-th vehicle is running σ st (v)
to station k; otherwise, cΔt CB (v) � , (5)
 ijk � 0. Figure 3 shows the sketch map
of arrival efficiency of bus station. s ≠ t σ st

 where CB (v) is the betweenness value of node v, σ st is the
 number of shortest paths going from s to t, and σ st (v) is the
3.3. Structural Measures. In many complex networks, the number of the shortest paths going from s to t through the
structure of network has an important impact on system node v.
functions. Some nodes with a large degree or betweenness
play a critical role in system dynamics. During the past two
decades, there are many studies focusing on the topological 3.3.3. Clustering Coefficient. Clustering coefficient reflects
structure of public transport networks such as bus and the connections among the neighbors of a node. It is
metro. In this part, we introduce four main network-based defined as
Journal of Advanced Transportation 5

 Case 1: Normal headway Normal headway
 Plan headway
 3rd bus 2nd bus 1st bus

 Case 2: Small headway Normal headway
 Small deviation

 3rd bus 2nd bus 1st bus

 Case 3: Smaller headway Large headway
 Large deviation

 3rd bus 2nd bus 1st bus

 Bunching Large headway
 Case 4:
 Bunching
 3rd bus 2nd bus 1st bus

 Figure 2: Four kinds of bus operation status.

 +4
 tki,j+1
 +5 tki,j+1
 tki,j+1 +3
 tki,j+1
 tci,j+1 +2
 tki,j+1
 tcuv tcij
 1 k–1 k tki,j k+1 k+2 n
 ∆t ∆t ∆t
 tku,v +1
 tku,v
 +2
 tku,v

 GPS points of route i in ∆t GPS points of route u in ∆t
 The last GPS point of route i in ∆t The last GPS point of route u in ∆t
 Figure 3: Sketch map of arrival efficiency of bus station.

 C vi �
 2ei
 ,
 4. Data Description
 (6)
 m i mi − 1
 The data were collected on October 25, 2018, in Xuchang,
where C(vi ) is the clustering coefficient of node vi , ei is the China. Xuchang is a famous historical city that is located in the
number of edges among local neighbors of node vi , and mi is central Henan Province. The studied bus network of Xuchang
the connection degree of neighbors of node vi . comprises 39 routes and 629 stations. Figure 4 exhibits the bus
 network of Xuchang, China. There are three kinds of data that
 contain GPS trajectory data, IC card data, and bus routes data.
3.3.4. PageRank. PageRank is widely used to measure node Table 1 shows the basic information of bus route data,
importance in many networks. PageRank could grasp the which includes line number, direction, station index, station
global topological information. Thus, we introduce the name, longitude, and latitude. Direction “0” represents the
PageRank algorithm to achieve the importance of nodes, upstream route and “1” represents the downstream route.
which is defined as The bus network can be constructed by the bus route in-
 N a
 formation. It is noted that the station index in the table is
 1 ji given for a route. In this paper, each station will be given a
 pi � (1 − p) + p ∗ out ∗ pj , (7)
 N j�1 kj unique index when generating the bus network. Table 2 gives
 the main information of GPS trajectory data, which contains
where pi denotes the influence score of ith node, p is the line number, bus number, date, time, longitude, latitude,
damping coefficient, kout
 j means the out-degree of jth node, station index, and direction. The GPS devices of bus send a
and aji is the adjacency matrix. message every 10–15 seconds. The station index “0” means

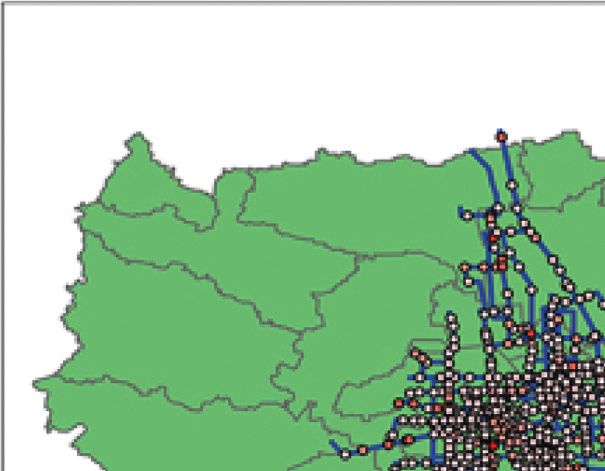
6 Journal of Advanced Transportation

 N

 0 5 10 20 km

 Bus station
 Bus route

 Figure 4: Bus network of Xuchang, China.

 Table 1: Illustration of bus routes data of Xuchang.
Line no. Direction Station index Station name Longitude Latitude
1 0 1 Huilong Guoji 113.7723 34.0141
1 0 2 Shiba Zhongxue 113.7761 34.0150
. . .. . . . . .. . . . . .. . . . . .. . . . . .. . . . . .. . .
1 0 36 Shangmaocheng 113.8607 33.9769
2 1 1 Gongjiao Gongsi 113.8808 34.0675
2 1 2 Dazhang Shequ 113.8777 34.0648
. . .. . . . . .. . . . . .. . . . . .. . . . . .. . . . . .. . .
Direction: “0” represents upstream route and “1” represents downstream route.

 Table 2: Main information of GPS trajectory data.
Line no. Bus no. Date Time Longitude Latitude Station index Direction
1 1511 2018/10/25 6 : 38 : 17 113.7723 34.0141 0 0
1 1511 2018/10/25 6 : 38 : 31 113.7725 34.0142 0 0
. . .. . . . . .. . . . . .. . . . . .. . . . . .. . . . . .. . . . . .. . . . . .. . .
1 1511 2018/10/25 6 : 40 : 27 113.7761 34.0150 2 0
. . .. . . . . .. . . . . .. . . . . .. . . . . .. . . . . .. . . . . .. . . . . .. . .
1 113.7812 34.0161 0 0
. . .. . . . . .. . . . . .. . . . . .. . . . . .. . . . . .. . . . . .. . . . . .. . .
Station index: “0” represents nonstation.

that the buses are running in the sections between stations. Table 3: Information of IC card data.
The running status of each bus can be achieved by the GPS Card no. Line no. Bus no. Date Time Direction
trajectory data. In addition, we can get the departure and
 EB3F10 1 1511 2018/10/25 7 : 27 : 16 0
arrival information of stations for each bus. Table 3 intro- 000F2A 1 1511 2018/10/25 7 : 36 : 28 0
duces the main information of IC card, which comprises EB278D 1 1511 2018/10/25 8 : 28 : 06 0
card number, line number, bus number, date, time, and . . .. . . . . .. . . . . .. . . . . .. . . . . .. . . . . .. . .
direction. We can obtain the boarding number of passengers
by joining with GPS trajectory data.
 The data were preprocessed to eliminate the outliers. The The performance of the bus network could be calculated by
duplicated and missing values are removed. Moreover, the the proposed indicators with given data. Then the statistical
longitudes and latitudes out of the studied area are removed. analysis and visualization will be done. In this paper, we use
The bus network will be constructed by the bus routes data. ArcGIS 10.3 to visualize the data.

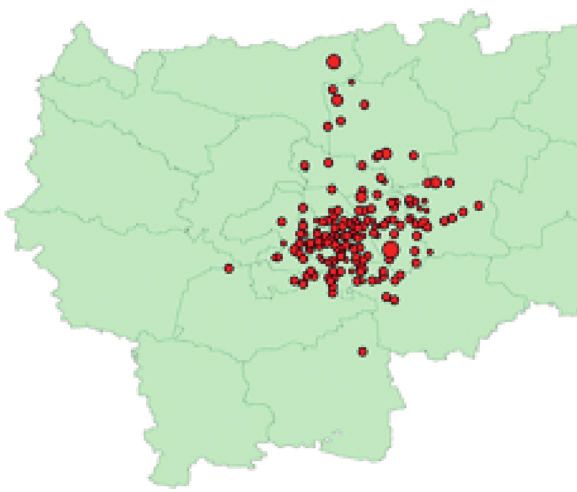
Journal of Advanced Transportation 7

5. Results

 Number of passengers
 6000

5.1. Traffic Demand and Bus Vehicle. Passenger flow and bus 4000
supply of bus play critical roles in daily management. On one
 2000
hand, bus will delay at stations if there are a large number of
boarding and alighting passengers. On the other hand, bus 0
 0 4 8 12 16 20 24
operational efficiency will enhance if the operational com-
 Hour in a day
pany provides more buses. Figure 5 shows the number of 600

 Number of vehicles
boarding passengers and bus vehicles during different hours
 400
in a day. We can see that the distributions of boarding
passengers exhibit two obvious peaks in morning and af- 200
ternoon. During the morning peak (7 : 00–9 : 00) and
evening peak (16 : 00–18 : 00), there are many commuters. 0
 0 4 8 12 16 20 24
The peaks are not sharp; that is because some elder people
 Hour in a day
prefer to travel to avoid peak hours [63]. The number of bus
distributions is smooth and the large value appears in the Figure 5: Number of passengers and vehicles of bus system per
morning peak hours. hour in a day.
 Figure 6 shows the distributions of bus number and
boarding passenger number of stations in a day. As we can Traditional headway studies mostly focus on single
see that the bus number of stations follows a lognormal routes. The situation of the entire network headway is not
distribution and the boarding passenger number of sta- very clear. Understanding the headway condition of bus
tions follows an exponential distribution. The results in- networks could provide a macroscopic view for planner and
dicate that the stations that have a large value of bus manager when making schedules and strategies. In this
number and boarding passenger number account for small paper, we use the proposed average headway of stations to
proportions. In bus networks, the lognormal and expo- evaluate the whole network headway conditions. Figure 9
nential distributions are ubiquitous. It is reported the shows the distributions of average headway of stations in
average dwell time and headway deviation of stations different time periods: (a) 8 : 00–9 : 00, (b) 10 : 00–11 : 00, (c)
follow lognormal distributions [25]. Bus network struc- 12 : 00–13 : 00, (d) 14 : 00–15 : 00, (e) 16 : 00–17 : 00 , and (f )
ture could have some impacts on the results. A small 18 : 00–19 : 00. The red curve is the fitted curves of lognor-
proportion of stations in the bus network have more mal. We can see that the average station headways follow
connections and most stations have a few connections. lognormal distributions with obvious right tails. Most values
The degree of stations follows power-law distributions or are concentrated between 100 seconds and 1000 seconds.
exponential distributions [55]. Stations with large values more than 1000 seconds account
 Figure 7 shows the spatial distributions of bus number for a small proportion.
and boarding passenger numbers. We can see that the Figure 10 shows the average headway of station values of
stations with large values are located in the central city. The all stations in a day. We can see that there are some stations
stations with a large number of boarding passengers are that have very large values. The top five stations are Ruix-
more concentrated. Operators should pay more attention to ianglu-Gongnonglu, Xuchang Shiyan School, Jianglijijie,
the balance of operational status of the bus network. Yangguangdadao Dongkou, and Nongji Wuliuyuan. In
 addition, there is a large difference in the deviation of the
 values in different hours in a day among the stations. The
5.2. Average Headway of Stations. Bus headway is an im- standard deviations range from 6.32 to 2780.
portant index to measure the operational efficiency and
reliability. The headway of a route is changing according to
many stochastic factors such as the number of boarding and 5.3. Average Arrival Rate of Station. The average arrival rate
alighting passengers, traffic signal, and weather conditions. of station is an index to measure the instantaneous opera-
For passengers, a stable and small headway is expected. tional efficiency of stations, which can be achieved by the
Unstable headway will disturb passengers’ travel plan and high dense GPS trajectory data. In this part, we mainly
large headway will enhance the waiting time. For operators, consider the buses that run to the nearest station. Figure 11
stable headway could enhance the efficiency of bus routes. shows the average arrival rate of station that there exit buses
There are a large number of studies focusing on strategies to running to them at 8 : 00, 10 : 00, 12 : 00, 14 : 00, 16 : 00, and
keep the headway stable by holding bus, skipping stations, 18 : 00. As we can see, the distributions of the values are
and controlling signals [64–66]. Bus bunching is a serious inhomogeneous. A small number of stations have large
problem about headway stability in daily operation, which values, while most stations have small values. In the morning
means two or more buses of one route arrive at the same and evening peak hours, there are many stations that have a
station simultaneously. Figure 8 exhibits the running maps large value. The reason is that there are more buses running
of route 9 and route 16. As can be seen, there are many buses on the road in those time periods. For one station, the
running with small headways in route 16 during the average arrival rate is changing as time goes. The indicator
morning and evening peak hours. could measure the station service quality instantaneously.

8 Journal of Advanced Transportation

 0.1

 Proportion
 0.05

 0
 500 1000 1500 2000
 Bus number
 0.4

 Proportion
 0.2

 0
 500 1000 1500 2000 2500
 Boarding passenger number
 Figure 6: Distributions of bus number and boarding passenger number.

 Bus number Passenger number
 1087 - 2447 181 - 349 975 - 2597 90 - 252
 588 - 1086 4 - 180 502 - 974 1 - 89
 350 - 587 253 - 501
 (a) (b)

 Figure 7: Maps of spatial distributions of (a) bus number and (b) passenger number.

Operators could make the targeted policy to enhance the people to use the public transport. The headway control could
arrival efficiency of stations by providing more buses. not pay attention to a single route but the entire bus network.
 Figure 12 shows the mean value of the average arrival rate
of station at different hours of a day. We can see that the
values are large in the peak hours and small in the off-peak 5.4. Topological Structural Characteristics. In many complex
hours. The value is very small after 20 : 00, because most networks, the topology structure is of significance in system
routes stop running on the road. It is noted that there are function. We introduce node degree, betweenness, clus-
some time periods that have larger values. Due to some tering coefficient, and PageRank index to evaluate the
stochastic factors, the headways are affected and lose ho- structural characteristics of the studied bus network. Fig-
mogeneity. Operators should provide a more robust timetable ure 13 shows the spatial distributions of the four indicators.
to keep the values stable. As we know, the stability of headway There is a small proportion of stations that have very large
plays an important role in residents’ travel mode choice. High values of the four indicators, which are concentrated on the
operation efficiency and stable headway could attract more center of the city. Take node degree, for example; there is

Journal of Advanced Transportation 9

 30
 30
 25
 25

 20
 20
 Stations

 Stations
 15
 15

 10 10

 5 5

 6:00 8:00 10:00 12:00 14:00 16:00 18:00 20:00 6:00 8:00 10:00 12:00 14:00 16:00 18:00 20:00
 Time Time
 (a) (b)

 Figure 8: Running maps of (a) route 9 and (b) route 16.

 0.06 0.06

 0.04 0.04
 Proportion

 Proportion

 0.02 0.02

 0 0
 0 500 1000 1500 0 500 1000 1500
 Average station headway Average station headway
 (a) (b)
 0.06 0.06

 0.04 0.04
 Proportion

 Proportion

 0.02 0.02

 0 0
 0 500 1000 1500 0 500 1000 1500
 Average station headway Average station headway
 (c) (d)
 0.06 0.06

 0.04 0.04
 Proportion

 Proportion

 0.02 0.02

 0 0
 0 500 1000 1500 0 500 1000 1500
 Average station headway Average station headway
 (e) (f )

Figure 9: Average station headway distributions in different time periods: (a) 8 : 00–9 : 00, (b) 10 : 00–11 : 00, (c) 12 : 00–13 : 00, (d) 14 :
00–15 : 00, (e) 16 : 00–17 : 00, and (f ) 18 : 00–19 : 00.
10 Journal of Advanced Transportation

 2000

 100
 1500
 200

 Stations
 300 1000

 400

 500
 500

 600
 0
 5 10 15 20
 Time of a day
 Figure 10: Heatmap of average headway of stations in a day.

 0.500001 - 1.000000 0.000051 - 0.100000 0.500001 - 1.000000 0.000061 - 0.080000 0.500001 - 1.000000 0.000091 - 0.105263
 0.250001 - 0.500000 0.000010 - 0.000050 0.200001 - 0.500000 0.000010 - 0.000060 0.200001 - 0.500000 0.000010 - 0.000090
 0.100001 - 0.250000 0.080001 - 0.200000 0.105261 - 0.200000

 (a) (b) (c)

 0.500001 - 1.000000 0.000041 - 0.105263 0.333334 - 1.000000 0.000031 - 0.105263 0.500001 - 1.000000 0.000041 - 0.069767
 0.250001 - 0.500000 0.000010 - 0.000040 0.200001 - 0.333333 0.000010 - 0.000030 0.200001 - 0.500000 0.000010 - 0.000040
 0.105264 - 0.250000 0.105264 - 0.200000 0.069768 - 0.200000

 (d) (e) (f)

 Figure 11: Average arrival rate of stations: (a) 8 : 00, (b) 10 : 00, (c) 12 : 00, (d) 14 : 00, (e) 16 : 00, and (f ) 18 : 00.

only 5.2% of stations that the degree is larger than 8. The top 5.5. Relationship between Indicators. To explore the rela-
five stations are Gaotiedong Zhan, Keyunbei Zhan, Beihai tionship among passengers, operational performance, and
Park, Railway station, and Jianan Hospital. Those stations the connections of stations, Figure 14 shows the heatmap of
are transport hub which attract numerous passengers. the Pearson correlation coefficient among these indicators.
Journal of Advanced Transportation 11

 0.05

 Average arrival efficiency
 0.04

 0.03

 0.02

 0.01

 0
 0 1 2 3 4 5 6 7 8 9 10 11 12 13 14 15 16 17 18 19 20 21 22 23
 Time of a day

 Figure 12: Mean value of average arrival rate of stations in a day.

 N N

 16 - 23 4-5 0.163580 - 0.435869 0.007203 - 0.026673
 9 - 15 1-3 0.060714 - 0.163579 0.000000 - 0.007202
 6-8 0.026674 - 0.060713
 (a) (b)

 N N

 0.500001 - 1.000000 0.035715 - 0.127273 0.001586 - 0.003013 0.000490 - 0.000687
 0.250001 - 0.500000 0.000000 - 0.035714 0.000971 - 0.001585 0.000278 - 0.000489
 0.127274 - 0.250000 0.000688 - 0.000970
 (c) (d)

Figure 13: Distributions of bus topological structure properties: (a) degree, (b) betweenness, (c) clustering coefficient, and (d) PageRank.

As can be seen, the boarding number is strongly correlated which means that a better network connection could attract
with the bus number. Moreover, the boarding number is more passenger flows. It is remarkable that the average
positively correlated with topology structure indicators, headway of station is negative with boarding passenger
12 Journal of Advanced Transportation

 Correlation between variables 1.00

 Boarding Number 1 0.74 0.47 0.37 0.016 0.38 -0.15

 0.75
 Bus Number 0.74 1 0.52 0.43 0.0077 0.44 -0.25

 Degree 0.47 0.52 1 0.71 0.04 0.97 -0.17
 0.50

 Betweenness 0.37 0.43 0.71 1 -0.046 0.71 -0.071

 0.25
 CC 0.016 0.0077 0.04 -0.046 1 -0.02 -0.067

 PageRanks 0.38 0.44 0.97 0.71 -0.02 1 -0.14 0.00

 AHS -0.15 -0.25 -0.17 -0.071 -0.067 -0.14 1

 Betweenness -0.25
 Boarding Number

 Degree

 CC

 PageRanks

 AHS
 Bus Number

 Figure 14: Correlations of main indicators.

number, which demonstrates that the passenger number is a route data. We build average headway of station and arrival
critical factor to disturb the stability of operation. For the efficiency of station to evaluate the bus network operation.
network structure, the PageRank index has a strong positive The results show that the bus number and boarding pas-
correlation with node degree. Clustering coefficient could senger number of bus network follow lognormal and ex-
reflect the local connections. The figure shows clustering ponential distributions. Moreover, the average headway of
coefficient nearly has no correlations with other indicators, stations follows a lognormal distribution. There exist some
which indicates that local connections hardly impact the stations, where the average headway of the station is very
operation. Operators should pay more attention to the entire large during the operation time. Managers should arrange
network. We can see that the average headway of station is more buses for the routes that serve these stations. The
negatively correlated with other indicators, which implies distributions of the average arrival rate of stations are in-
that complex network connections and more passenger homogeneous. A small number of stations have large values,
flows could weaken the efficiency of bus operation. while most stations have small values. We test the rela-
 tionships among passengers, operational performance, and
6. Conclusions the connections of stations. It is found that the average
 headway of station is negatively correlated with other in-
Bus system is a complicated spatiotemporal network, which dicators, which implies that complex network connections
plays a key role in alleviating traffic congestions. Under- and large passenger flows could weaken the efficiency of bus
standing the operational status of the whole network is of operation. In addition, the boarding number is strongly
significance for improving the service quality. The bus correlated with bus number. The boarding number is pos-
system often suffers from delay and bunching due to many itively correlated with topology structure indicators, which
factors such as traffic condition of road, weather, traffic light, means that a better network connection could attract more
and number of boarding and alighting passengers. Any passengers to use public transport.
disturbance of bus operation could cause the cascade re- This paper will promote the study of stability and effi-
action from stops to a route, even to the entire network. The ciency of bus system from a single route to the entire
efficiency and stability are two key indicators to measure the network, which has important theoretical and practical
bus operation. meaning for bus systematic management and control. The
 To evaluate the operational performance of the bus limitations of this study are as follows. This paper did not
network, this paper proposes a spatiotemporal analysis of the involve the number of alighting passengers due to data
bus network based on GPS trajectory data, IC card data, and limitation. The external factors, such as traffic condition and
Journal of Advanced Transportation 13

weather, have not been considered in the paper. In the future [11] Q. Huang, B. Jia, R. Jiang, and S. Qiang, “Simulation-based
study, more factors will be considered and prediction model optimization in a bidirectional $A/B$ skip-stop bus service,”
will be studied. IEEE Access, vol. 5, pp. 15478–15489, 2017.
 [12] S. J. Berrebi, E. Hans, N. Chiabaut, J. A. Laval, L. Leclercq, and
 K. E. Watkins, “Comparing bus holding methods with and
Data Availability without real-time predictions,” Transportation Research Part
 C: Emerging Technologies, vol. 87, pp. 197–211, 2018.
The data are available by contacting the corresponding [13] N. B. Stoll, T. Glick, and M. A. Figliozzi, “Using high-reso-
author. lution bus GPS data to visualize and identify congestion hot
 spots in urban arterials,” Transportation Research Record:
Conflicts of Interest Journal of the Transportation Research Board, vol. 2539, no. 1,
 pp. 20–29, 2016.
The authors declare there are no conflicts of interest. [14] J. Seo, S. H. Cho, D. K. Kim, and P. Y. J. Park, “Analysis of
 overlapping origin-destination pairs between bus stations to
 enhance the efficiency of bus operations,” IET Intelligent
Acknowledgments Transport Systems, vol. 14, no. 6, pp. 545–553, 2020.
 [15] A. Webb, P. Kumar, and A. Khani, “Estimation of passenger
This work was supported by the National Natural Science waiting time using automatically collected transit data,” Public
Foundation of China (42001396 and 41901396) and the Transport, vol. 12, no. 2, pp. 299–311, 2020.
Beijing Jingwei Information Technology Co., Ltd. Scientific [16] L. Liu and H. J. Miller, “Measuring risk of missing transfers in
Research Project (DZYF20-02). public transit systems using high-resolution schedule and
 real-time bus location data,” Urban Studies, 2020.
 [17] T. Zhang, Y. Li, H. Yang, C. Cui, J. Li, and Q. Qiao, “Iden-
References tifying primary public transit corridors using multi-source big
 [1] C. R. Sekhar, T. Iryo, and Y. Asakura, “Analysis of travel-time transit data,” International Journal of Geographical Infor-
 variation over multiple sections of Hanshin expressway in mation Science, vol. 34, no. 6, pp. 1137–1161, 2020.
 Japan,” Current Science, vol. 102, no. 11, pp. 1527–1533, 2012. [18] J. Li, P. Zheng, and W. Zhang, “Identifying the spatial
 [2] N. Julio, R. Giesen, and P. Lizana, “Real-time prediction of bus distribution of public transportation trips by node and
 travel speeds using traffic shockwaves and machine learning community characteristics,” Transportation Planning and
 algorithms,” Research in Transportation Economics, vol. 59, Technology, vol. 43, no. 3, pp. 325–340, 2020.
 pp. 250–257, 2016. [19] F. Chen, J. Zhang, Z. Wang, S. Shi, and H. Liu, “Passenger
 [3] A. H. F. Chow, S. Li, and R. Zhong, “Multi-objective optimal travel characteristics and bus operational states: a study based
 control formulations for bus service reliability with traffic on IC card and GPS data in Yinchuan, China,” Transportation
 signals,” Transportation Research Part B: Methodological, Planning and Technology, vol. 42, no. 8, pp. 825–847, 2019.
 vol. 103, pp. 248–268, 2017. [20] H. Zhang, B. Y. Shi, S. G. Song, Q. M. Zhao, X. M. Yao, and
 [4] S. M. H. Moosavi, A. Ismail, and A. Balali, “Evaluating bus W. Wang, “Statistical analysis of the stability of bus vehicles
 dwell time at key stops using automatic data collection sys- based on GPS trajectory data,” Modern Physics Letters B,
 tems,” ITE Journal-Institute of Transportation Engineers, vol. 33, no. 3, Article ID 1950015, 2019.
 vol. 87, no. 11, pp. 45–49, 2017. [21] H. Zhang, C. Zhuge, and X. Yu, “Identifying hub stations and
 [5] Y. Park, J. Mount, L. Liu, N. Xiao, and H. J. Miller, “Assessing important lines of bus networks: a case study in Xiamen,
 public transit performance using real-time data: spatiotem- China,” Physica A: Statistical Mechanics and Its Applications,
 poral patterns of bus operation delays in Columbus, Ohio, vol. 502, pp. 394–402, 2018.
 USA,” International Journal of Geographical Information [22] Z. Neal, “Is the urban world small? The evidence for small
 Science, vol. 34, no. 2, pp. 367–392, 2020. world structure in urban networks,” Networks and Spatial
 [6] Y. J. Deng, X. Luo, X. B. Hu, Y. F. Ma, and R. Ma, “Modeling Economics, vol. 18, no. 3, pp. 615–631, 2018.
 and prediction of bus operation states for bunching analysis,” [23] T. N. Maeda, J. Mori, I. Hayashi, T. Sakimoto, and I. Sakata,
 Journal of Transportation Engineering Part A, vol. 146, no. 9, “Comparative examination of network clustering methods for
 Article ID 04020106, 2020. extracting community structures of a city from public
 [7] A. Khadhir, B. A. Kumar, and L. D. Vanajakshi, “Analysis of transportation Smart Card Data,” IEEE Access, vol. 7,
 global positioning system based bus travel time data and its pp. 53377–53391, 2019.
 use for advanced public transportation system applications,” [24] Y. Sui, F. Shao, X. Yu, R. Sun, and S. Li, “Public transport
 Journal of Intelligent Transportation Systems, vol. 25, no. 1, network model based on layer operations,” Physica A: Sta-
 pp. 58–76, 2021. tistical Mechanics and Its Applications, vol. 523, pp. 984–995,
 [8] Y. J. Deng, X. H. Liu, X. B. Hu, and M. Zhang, “Reduce bus 2019.
 bunching with a real-time speed control algorithm consid- [25] H. Zhang, H. Cui, and B. Shi, “A data-driven analysis for
 ering heterogeneous roadway conditions and intersection operational vehicle performance of public transport network,”
 delays,” Journal of Transportation Engineering Part A, vol. 146, IEEE Access, vol. 7, pp. 96404–96413, 2019.
 no. 7, Article ID 04020048, 2020. [26] C. A. Iliopoulou, C. P. Milioti, E. I. Vlahogianni, and
 [9] J. Argote-Cabanero, C. F. Daganzo, and J. W. Lynn, “Dynamic K. L. Kepaptsoglou, “Identifying spatio-temporal patterns of
 control of complex transit systems,” Transportation Research bus bunching in urban networks,” Journal of Intelligent
 Part B: Methodological, vol. 81, pp. 146–160, 2015. Transportation Systems, vol. 24, no. 4, pp. 365–382, 2020.
[10] J.-D. Schmöcker, W. Sun, A. Fonzone, and R. Liu, “Bus [27] J. J. Tang, Z. T. Li, F. Gao, and F. Zong, “Identifying critical
 bunching along a corridor served by two lines,” Transportation metro stations in multiplex network based on D-S evidence
 Research Part B: Methodological, vol. 93, pp. 300–317, 2016. theory,,” Physica A, vol. 574, Article ID 126018, 2021.
14 Journal of Advanced Transportation

[28] A. A. De Bona, M. D. Rosa, K. V. O. Fonseca, and R. Luders, trajectory data in India,” Journal of Transportation Engi-
 “A reduced model for complex network analysis of public neering Part A, vol. 144, no. 5, Article ID 04018012, 2018.
 transportation systems,” Physica A, vol. 567, Article ID [45] W. Fan and R. B. Machemehl, “Do transit users just wait for
 125715, 2021. buses or wait with strategies?” Transportation Research Re-
[29] Y. Wang, Y. Y. Yuan, X. Y. Guan, M. Z. Xu, L. Wang, and cord: Journal of the Transportation Research Board, vol. 2111,
 H. Z. Wang, “Collaborative two-echelon multicenter vehicle no. 1, pp. 169–176, 2009.
 routing optimization based on state-space-time network [46] S. S. Moghaddam, R. Noroozi, J. M. Casello, and B. Hellinga,
 representation,” Journal of Cleaner Production, vol. 258, “Predicting the mean and variance of transit segment and
 Article ID 120590, 2020. route travel times,” Transportation Research Record: Journal of
[30] Y. Wang, S. G. Peng, X. S. Zhou, M. Mahmoudi, and L. Zhen, the Transportation Research Board, vol. 2217, no. 1, pp. 30–37,
 “Green logistics location-routing problem with eco-pack- 2011.
 ages,” Transportation Research Part E, vol. 143, Article ID [47] A. Gal, A. Mandelbaum, F. Schnitzler, A. Senderovich, and
 102118, 2020. M. Weidlich, “Traveling time prediction in scheduled
[31] T. Li and L. Rong, “Impacts of service feature on vulnerability transportation with journey segments,” Information Systems,
 analysis of high-speed rail network,” Transport Policy, vol. 110, vol. 64, pp. 266–280, 2017.
 pp. 238–253, 2021. [48] L. M. Kieu, A. Bhaskar, and E. Chung, “Public transport
[32] J. Tang, S. Zhang, X. Chen, F. Liu, and Y. Zou, “Taxi trips travel-time variability definitions and monitoring,” Journal of
 distribution modeling based on entropy-maximizing theory: a Transportation Engineering, vol. 141, no. 1, Article ID
 case study in Harbin city-China,” Physica A: Statistical Me- 04014068, 2015.
 chanics and Its Applications, vol. 493, pp. 430–443, 2018. [49] R. Rajbhandari, S. I. Chien, and J. R. Daniel, “Estimation of
[33] H. Zhang, L. Zhang, F. Che, J. Jia, and B. Shi, “Revealing urban bus dwell times with automatic passenger counter informa-
 traffic demand by constructing dynamic networks with taxi tion,” Transportation Research Record: Journal of the Trans-
 trajectory data,” IEEE Access, vol. 8, pp. 147673–147681, 2020. portation Research Board, vol. 1841, no. 1, pp. 120–127, 2003.
[34] L. Ni, X. Wang, and X. Chen, “A spatial econometric model [50] A. Tirachini, “Bus dwell time: the effect of different fare
 for travel flow analysis and real-world applications with collection systems, bus floor level and age of passengers,”
 massive mobile phone data,” Transportation Research Part C: Transportmetrica: Transportation Science, vol. 9, no. 1,
 Emerging Technologies, vol. 86, pp. 510–526, 2018. pp. 28–49, 2013.
[35] M. G. Demissie, S. Phithakkitnukoon, and L. Kattan, “Trip [51] Y. Ji, L. Gao, D. Chen, X. Ma, and R. Zhang, “How does a static
 distribution modeling using mobile phone data: emphasis on measure influence passengers’ boarding behaviors and bus
 intra-zonal trips,” IEEE Transactions on Intelligent Trans- dwell time? Simulated evidence from Nanjing bus stations,”
 portation Systems, vol. 20, no. 7, pp. 2605–2617, 2019. Transportation Research Part A: Policy and Practice, vol. 110,
[36] H. Zhang, C. X. Zhuge, J. M. Jia, B. Y. Shi, and W. Wang, pp. 13–25, 2018.
 “Green travel mobility of dockless bike-sharing based on trip [52] A. Chepuri, S. Joshi, S. Arkatkar, G. Joshi, and A. Bhaskar,
 data in big cities: a spatial network analysis,” Journal of “Development of new reliability measure for bus routes using
 Cleaner Production, vol. 313, Article ID 127930, 2021. trajectory data,” Transportation Letters, vol. 12, no. 6,
[37] Z. Tian, J. Zhou, and M. Wang, “Dynamic evolution of de- pp. 363–374, 2020.
 mand fluctuation in bike-sharing systems for green travel,” [53] J. Paudel, “Bus ridership and service reliability: the case of
 Journal of Cleaner Production, vol. 231, pp. 1364–1374, 2019. public transportation in Western Massachusetts,” Transport
[38] Y. L. Lu, U. Benlic, and Q. H. Wu, “An effective memetic Policy, vol. 100, pp. 98–107, 2021.
 algorithm for the generalized bike-sharing rebalancing [54] C. Zhang, Z. Juan, Q. Luo, and G. Xiao, “Performance
 problem,” Engineering Applications of Artificial Intelligence, evaluation of public transit systems using a combined eval-
 vol. 95, Article ID 103890, 2020. uation method,” Transport Policy, vol. 45, pp. 156–167, 2016.
[39] Z. Gurmu and W. Fan, “Artificial neural network travel time [55] X. P. Yang, S. W. Lu, W. F. Zhao, and Z. Y. Zhao, “Exploring
 prediction model for buses using only GPS data,” Journal of the characteristics of an intra-urban bus service network: a
 Public Transportation, vol. 17, no. 2, pp. 45–65, 2014. case study of Shenzhen, China,” ISPRS International Journal
[40] W. Tu, R. Cao, Y. Yue, B. Zhou, Q. Li, and Q. Li, “Spatial of Geo-Information, vol. 8, no. 11, Article ID 486, 2019.
 variations in urban public ridership derived from GPS tra- [56] G. L. Jia, R. G. Ma, and Z. H. Hu, “Urban transit network
 jectories and smart card data,” Journal of Transport Geogra- properties evaluation and optimization based on complex
 phy, vol. 69, pp. 45–57, 2018. network theory,” Sustainability, vol. 11, p. 2007, 2019.
[41] J. Tang, Y. Yang, W. Hao, F. Liu, and Y. Wang, “A data-driven [57] Y. J. Wang, Y. Deng, F. Ren et al., “Analysis the spatial
 timetable optimization of urban bus line based on multi- configuration of urban bus networks based on the geospatial
 objective genetic algorithm,” IEEE Transactions on Intelligent network analysis method,” Cities, vol. 96, Article ID 102406,
 Transportation Systems, vol. 22, no. 4, pp. 2417–2429, 2021. 2020.
[42] R. Zhang, P. Xie, C. Wang, G. Y. Liu, and S. H. Wang, [58] L.-S. Sun, S.-W. Wang, L.-Y. Yao, J. Rong, and J.-M. Ma,
 “Classifying transportation mode and speed from trajectory “Estimate of transit ridership based on spatial analysis and
 data via deep multi-scale learning,” Computer Networks, precise land use data,” Transportation Letters, vol. 8, no. 3,
 vol. 162, Article ID 106861, 2019. pp. 140–147, 2016.
[43] J. Li, X. Pei, X. Wang, D. Yao, Y. Zhang, and Y. Yue, [59] Y. Zuo, Z. Liu, and X. Fu, “Measuring accessibility of bus
 “Transportation mode identification with GPS trajectory data system based on multi-source traffic data,” Geo-Spatial In-
 and GIS information,” Tsinghua Science and Technology, formation Science, vol. 23, no. 3, pp. 248–257, 2020.
 vol. 26, no. 4, pp. 403–416, 2021. [60] H. Zhang, X. Li, L. Zhang, W. Wang, J. Jia, and B. Shi,
[44] A. Chepuri, J. Ramakrishnan, S. Arkatkar, G. Joshi, and “Discovering station patterns of urban transit network with
 S. S. Pulugurtha, “Examining travel time reliability-based multisource data: empirical evidence in Jinan, China,” KSCE
 performance indicators for bus routes using GPS-based bus Journal of Civil Engineering, vol. 25, no. 2, pp. 680–691, 2021.
Journal of Advanced Transportation 15

[61] S. Wei, W. Zheng, and L. Wang, “Understanding the
 configuration of bus networks in urban China from the
 perspective of network types and administrative division
 effect,” Transport Policy, vol. 104, pp. 1–17, 2021.
[62] S. Bree, D. Fuller, and E. Diab, “Access to transit? Validating
 local transit accessibility measures using transit ridership,”
 Transportation Research Part A: Policy and Practice, vol. 141,
 pp. 430–442, 2020.
[63] W. Y. Szeto, L. Yang, R. C. P. Wong, Y. C. Li, and S. C. Wong,
 “Spatio-temporal travel characteristics of the elderly in an
 ageing society,” Travel Behaviour and Society, vol. 9, pp. 10–
 20, 2017.
[64] K. Gkiotsalitis and E. C. Van Berkum, “An analytic solution
 for real-time bus holding subject to vehicle capacity limits,”
 Transportation Research Part C, vol. 121, Article ID 102815,
 2020.
[65] X. M. Chen, X. M. Han, L. Yu, and C. H. Wei, “Does operation
 scheduling make a difference: tapping the potential of opti-
 mized design for skipping-stop strategy in reducing bus
 emissions,” Sustainability, vol. 9, no. 10, p. 1737, 2017.
[66] Y. Bie, X. Xiong, Y. Yan, and X. Qu, “Dynamic headway
 control for high-frequency bus line based on speed guidance
 and intersection signal adjustment,” Computer-Aided Civil
 and Infrastructure Engineering, vol. 35, no. 1, pp. 4–25, 2020.
You can also read