Answering the Call for Affordable, Reliable, Lower Carbon Energy - 4Q 2021 EARNINGS / FEBRUARY 23, 2022 - Investors

Page created by Alicia Ortega
 
CONTINUE READING
Answering the Call for Affordable, Reliable, Lower Carbon Energy - 4Q 2021 EARNINGS / FEBRUARY 23, 2022 - Investors
Answering the Call
                                                                  for Affordable, Reliable,
                                                                    Lower Carbon Energy
                                                                      4Q 2021 EARNINGS / FEBRUARY 23, 2022

                                          H A Y N E S V I L L E

E A G L E   F O R D

                      M A R C E L L U S
Answering the Call for Affordable, Reliable, Lower Carbon Energy - 4Q 2021 EARNINGS / FEBRUARY 23, 2022 - Investors
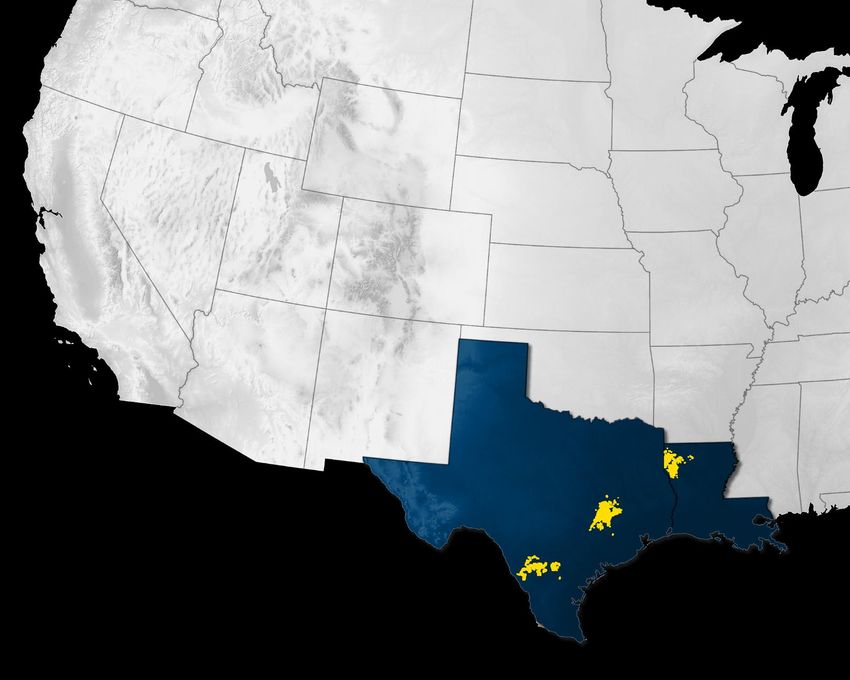
Forward-Looking Statements
This presentation includes “forward-looking statements” within the meaning of Section 27A of the Securities Act of 1933 and Section 21E of the Securities Exchange Act of 1934. Forward-looking
statements are statements other than statements of historical fact. They include statements that give our current expectations, management’s outlook guidance or forecasts of future events,
expected natural gas and oil growth trajectory, projected cash flow and liquidity, our ability to enhance our cash flow and financial flexibility, dividend plans, future production and commodity mix,
plans and objectives for future operations, ESG initiatives, the ability of our employees, portfolio strength and operational leadership to create long-term value, and the assumptions on which such
statements are based. Although we believe the expectations and forecasts reflected in our forward-looking statements are reasonable, they are inherently subject to numerous risks and
uncertainties, most of which are difficult to predict and many of which are beyond our control. No assurance can be given that such forward-looking statements will be correct or achieved or that
the assumptions are accurate or will not change over time.

Factors that could cause actual results to differ materially from expected results include those described under “Risk Factors” in Item 1A of our annual report on Form 10-K and any updates to
those factors set forth in Chesapeake’s subsequent quarterly reports on Form 10-Q or current reports on Form 8-K (available at http://www.chk.com/investors/sec-filings). These risk factors
include: the ability to execute on our business strategy following emergence from bankruptcy; the impact of the COVID-19 pandemic and its effect on our business, financial condition, employees,
contractors and vendors, and on the global demand for oil and natural gas and U.S. and world financial markets; risks related to the acquisition of Chief E&D Holdings, LP and affiliates of Tug Hill,
Inc. (together, “Chief”), including our ability to successfully integrate the business of Chief into the company and achieve the expected synergies from the Chief acquisition within the expected
timeframe; the volatility of oil, natural gas and NGL prices; the limitations our level of indebtedness may have on our financial flexibility; our inability to access the capital markets on favorable
terms; the availability of cash flows from operations and other funds to fund cash dividends, to finance reserve replacement costs or satisfy our debt obligations; write-downs of our oil and natural
gas asset carrying values due to low commodity prices; our ability to replace reserves and sustain production; uncertainties inherent in estimating quantities of oil, natural gas and NGL reserves
and projecting future rates of production and the amount and timing of development expenditures; our ability to generate profits or achieve targeted results in drilling and well operations;
leasehold terms expiring before production can be established; commodity derivative activities resulting in lower prices realized on oil, natural gas and NGL sales; the need to secure derivative
liabilities and the inability of counterparties to satisfy their obligations; adverse developments or losses from pending or future litigation and regulatory proceedings, including royalty claims;
charges incurred in response to market conditions; drilling and operating risks and resulting liabilities; effects of environmental protection laws and regulations on our business; legislative and
regulatory initiatives further regulating hydraulic fracturing; our need to secure adequate supplies of water for our drilling operations and to dispose of or recycle the water used; impacts of
potential legislative and regulatory actions addressing climate change; federal and state tax proposals affecting our industry; potential OTC derivatives regulation limiting our ability to hedge
against commodity price fluctuations; competition in the oil and gas exploration and production industry; a deterioration in general economic, business or industry conditions; negative public
perceptions of our industry; limited control over properties we do not operate; pipeline and gathering system capacity constraints and transportation interruptions; terrorist activities and cyber-
attacks adversely impacting our operations; and an interruption in operations at our headquarters due to a catastrophic event.

In addition, disclosures concerning the estimated contribution of derivative contracts to our future results of operations are based upon market information as of a specific date. These market
prices are subject to significant volatility. Our production forecasts are also dependent upon many assumptions, including estimates of production decline rates from existing wells and the
outcome of future drilling activity. We caution you not to place undue reliance on our forward-looking statements that speak only as of the date of this presentation, and we undertake no obligation
to update any of the information provided in this presentation, except as required by applicable law. In addition, this presentation contains time-sensitive information that reflects management’s
best judgment only as of the date of this presentation.

                         4Q’21 Earnings – February 23, 2022                                                                                                                                          2
Answering the Call for Affordable, Reliable, Lower Carbon Energy - 4Q 2021 EARNINGS / FEBRUARY 23, 2022 - Investors
YE’21 Highlights: Delivering Strategic Priorities

➤ Disciplined capital investment
   • Focused on highest ROR opportunities                                    4Q’21 adjusted free cash flow
                                                                                                             (1)
                                                                                                                      FY’21 adjusted free cash flow

   • ~35% reinvestment of adjusted EBITDAX(1) in 2021                        $372mm                                   $1,258mm
➤ Return cash to shareholders
   • Base dividend initiated and increased
                                                                             4Q’21 adjusted EBITDAX                FY’21 adjusted EBITDAX
                                                                                                      (1)

   • Variable dividend program announced
   • Share and warrant repurchase program announced                          $687mm                                $2,145mm
➤ Maintain balance sheet strength $9B of adjusted free cash flow projected through 2026(2)               $52mm                             $119mm
➤ Achieve net-zero direct GHG emissions by 2035
   • First company to certify its Haynesville operations as                  Balance sheet cash                       MiQ and EO100TM rating
     Responsibly Sourced Gas
   • ~1,800 continuous methane emissions monitoring devices
                                                                             $905mm                                   Grade “A”
                                                                             as of 12/31/2021                         for legacy Haynesville operations
     installed in Haynesville and Marcellus at YE’21

                (1) A non-GAAP measure as defined in the appendix
                (2) Incorporates 2/18/2022 strip pricing from 2022 to 2026

                4Q’21 Earnings – February 23, 2022                                                                                                        3
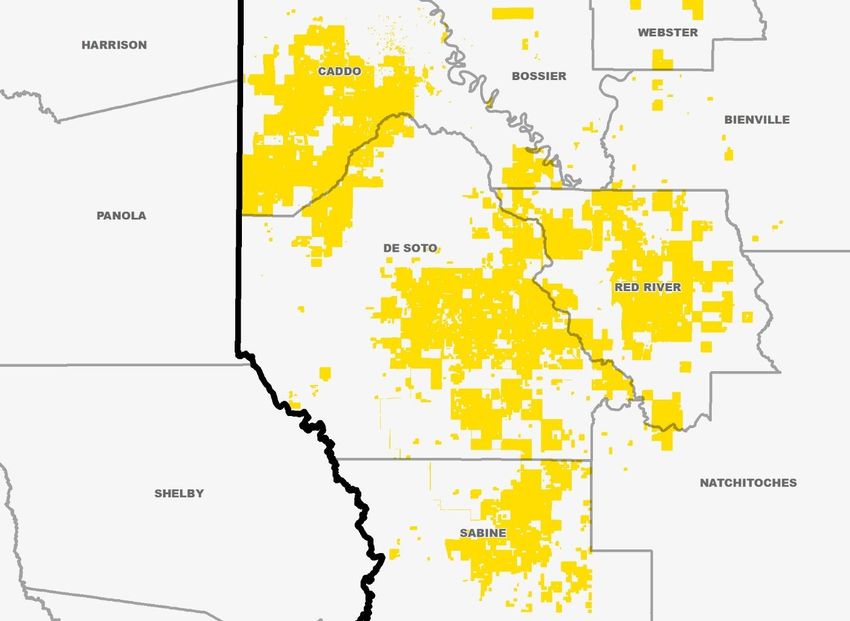
Answering the Call for Affordable, Reliable, Lower Carbon Energy - 4Q 2021 EARNINGS / FEBRUARY 23, 2022 - Investors
2022 Value Drivers

                                                                                                       Delivering

                                                                                                       ~6 bcf/d
         Adjusted free cash flow(1)

         $1.9B – $2.1B                                                                                              (2)
                                                                                                       certified RSG volumes by year-end 2022

         Reinvestment rate

         ~42%
                                                                                   PF net debt-to-2022E EBITDAX ratio(3)         Preserving

                                                                                   ~0.7x
                                                                                                                                 balance
                                                                                                                                 sheet
                                                                                                                                 strength
         estimated for 2022

         Total dividends payable in 2022E                                                              Share repurchase authorization

         $0.9B – $1.1B                                                                                 through year-end 2023

         $1.7675 per share payable in March 2022                                                       $1B
        (1) Assumes projections and outlook as of February 23, 2022
        (2) Responsibly Sourced Gas, pro forma for Chief and Powder River Basin transactions
        (3) A non-GAAP measure as defined in the appendix

        4Q’21 Earnings – February 23, 2022                                                                                                      4
Answering the Call for Affordable, Reliable, Lower Carbon Energy - 4Q 2021 EARNINGS / FEBRUARY 23, 2022 - Investors
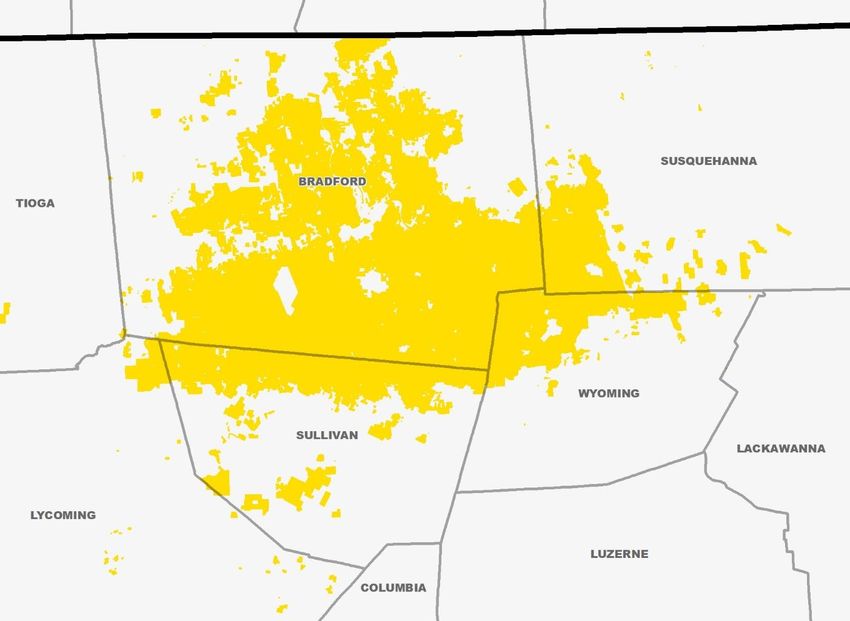
Best-in-Class Dividend Program

                Variable dividend payments commence, leading to double-digit cash returns
                                                                                                                                                                                                (1)

➤ $1.7675 per share payable in March 2022
   • $0.4375 base dividend                                                                                                                   2022E TOTAL DIVIDEND YIELD
                                                                                                                                                                             (2)
                                                                                                                                                                                                                  ~18%
                                                                                                                                                                                                             with buyback(3)
   • $1.33 variable dividend
                                                                                                                                                                                                                   13%
➤ Quarterly base dividend expected to increase 14%                                                                                                                                                          11%
  to $0.50 per share payable in June 2022                                                                                                                                                             9%
                                                                                                                                                                                         8%    8%
                                                                                                                                                                                   7%
➤ Anticipate paying $0.9B – $1.1B in total dividends
  in 2022 (~13% current yield)(1)                                                                                                                                     3%
   • 2Q’22E projected total dividends paid of $225mm – $275mm                                                                                                   2%
                                                                                                                                                    1%    1%
   • Total estimated dividends of >$5B over the next five years(1)                                                                             0%
                                                                                                                                              SWN   MRO   OVV   EQT   FANG         DVN   EOG   CTRA   PXD   CHK CHK PF
➤ $1B buyback program authorized through YE’23

                (1) Based on 2/18//2022 strip price and CHK stock price
                (2) Total dividend yield is calculated as projected base and variable dividends per common share divided by 2/18/2022 share price
                (3) Assumes $500 million of common shares repurchased during 2022

                4Q’21 Earnings – February 23, 2022                                                                                                                                                                  5
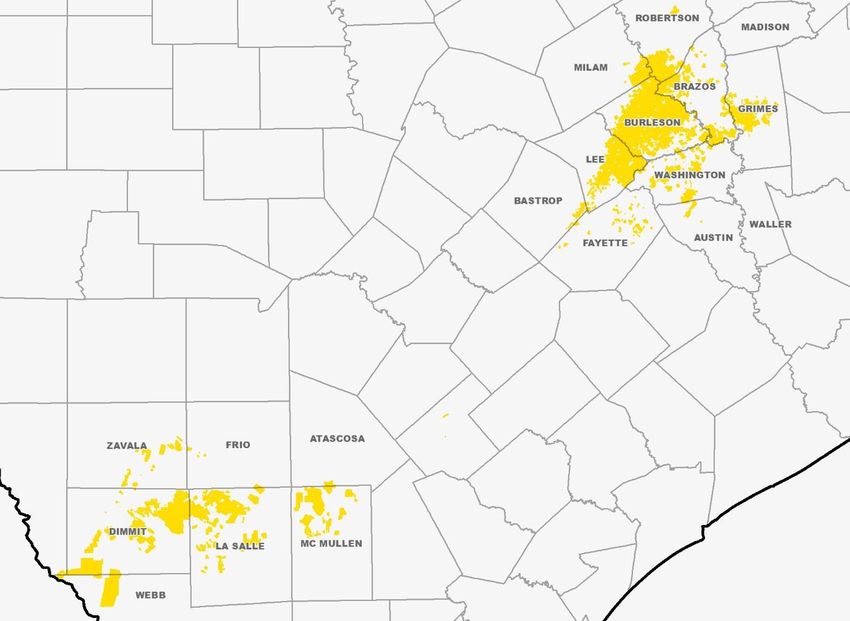
Answering the Call for Affordable, Reliable, Lower Carbon Energy - 4Q 2021 EARNINGS / FEBRUARY 23, 2022 - Investors
2022 Projected Plan
  ’22E Activity

                                                                                                                                                              2021 Actual and 2022E Projected Results

                                                                                                                                                                         4Q’21        FY’21      1Q’22E             FY’22E

                                                                                                                                         Oil Production (mbo/d)           62            71       58 – 62             51 – 56
                                                                          Marcellus
                                                                                                                                         Gas Production (bcf/d)           2.7          2.2       3.0 – 3.1          3.6 – 3.7
                                                                          ~650,000 net acres
                                                                          ~50% WI, ~40% NRI                                              Total Production (mboe/d)        539          462      585 – 595           670 – 690
                                                                          4 – 5 active rigs
                                                                          80 – 95 wells drilled & TIL’d                                  Adj. EBITDAX ($mm)              $687         $2,145   $825 – $900       $3,800 – $4,000
                                                                          $650 – $750 cost/lateral foot
                                                                                                                                         Capex ($mm)                     $268          $746    $360 – $390       $1,500 – $1,800

                                                                                                                                         Dividends Paid ($mm)             $52          $119    $210 – $215        $900 – $1,100

                                        Oklahoma City Headquarters
Eagle Ford                                                                                                                             ’22E Production Outlook          ’22E EBITDAX Outlook               ’22E Capital Plan
~610,000 net acres
~80% WI, ~65% NRI
1 – 4 active rigs                                                           Haynesville
45 – 65 wells drilled & TIL’d
                                                                            ~350,000 net acres
$625 – $725 cost/lateral foot
                                                                            ~85% WI, ~70% NRI
                                                                            5 – 6 active rigs
                                                                            60 – 75 wells drilled & TIL’d
                                                                            $1,100 – $1,200 cost/lateral foot

                                                                                                                                                            Marcellus           Haynesville    Eagle Ford

                                (1) All values assume 9 months of Chief and 3 months of PRB – assumed March 2022 close for each deal

                                4Q’21 Earnings – February 23, 2022                                                                                                                                                      6
Answering the Call for Affordable, Reliable, Lower Carbon Energy - 4Q 2021 EARNINGS / FEBRUARY 23, 2022 - Investors
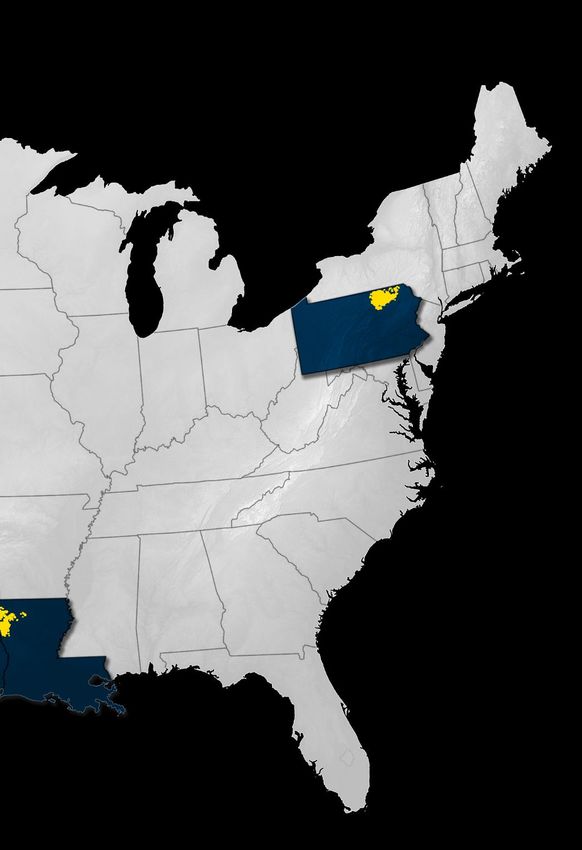
Marcellus: 2022 Overview

➤ $1.80/mcf PV-10 breakeven                                                                                                            0   3        6
                                                                                                                                                   Miles
                                                                                                                                                           12

➤ Anticipated 2022 ROR ~150% at $3/$62 flat

➤ Pricing assumption
    •   ($0.60) – ($0.70)/mcf annual average in-basin to NYMEX pricing
    •   Potential for premium realizations in winter months

                              4Q’21              1Q’22E             FY’22E
Net Production (bcf/d)          1.3              1.2 – 1.3          1.9 – 2.0
Wells Drilled                    13               10 – 12           80 – 95
Wells TIL’d                      14               14 – 16           80 – 95
Rigs                             3                 2–3                4–5

 ’22E Production Outlook      ’22E EBITDAX Outlook           ’22E Capital Plan

                                                                                 Cost assumptions (net)         4Q’21   1Q’22E        FY’22E

                                                                                 LOE ($/mcf)                    $0.09               $0.05 – $0.10

                                                                                 GP&T ($/mcf)                   $0.69               $0.55 – $0.65

                                                                                 Total Capital (accrued, $mm)    $77    $50 – $60   $425 – $525

                     4Q’21 Earnings – February 23, 2022                                                                                        7
Answering the Call for Affordable, Reliable, Lower Carbon Energy - 4Q 2021 EARNINGS / FEBRUARY 23, 2022 - Investors
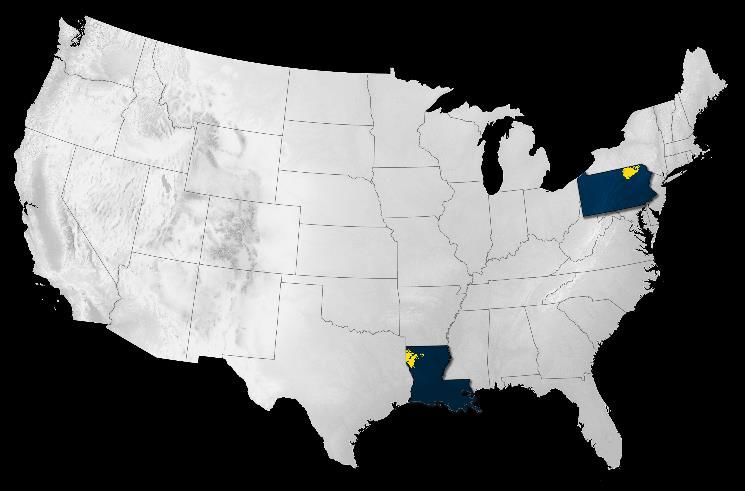
Haynesville: 2022 Overview

➤ $1.95/mcf PV-10 breakeven

➤ Anticipated 2022 ROR ~105% at $3/$62 flat

➤ Pricing assumption
    •   ($0.30) – ($0.40)/mcf annual average in-basin to NYMEX pricing

                               4Q’21             1Q’22E             FY’22E
Net Production (bcf/d)          1.2              1.5 – 1.6          1.6 – 1.7
Wells Drilled                    14               12 – 14           60 – 75
Wells TIL’d                      16               20 – 22           60 – 75
Rigs                             5                 5–6                5–6

 ’22E Production Outlook      ’22E EBITDAX Outlook           ’22E Capital Plan

                                                                                                                                        0   3       6   12
                                                                                                                                                Miles

                                                                                 Cost assumptions (net)         4Q’21    1Q’22E         FY’22E

                                                                                 LOE ($/mcf)                    $0.25                 $0.20 – $0.30

                                                                                 GP&T ($/mcf)                   $0.47                 $0.45 – $0.55

                                                                                 Total Capital (accrued, $mm)   $137    $215 – $225   $675 – $775

                     4Q’21 Earnings – February 23, 2022                                                                                         8
Answering the Call for Affordable, Reliable, Lower Carbon Energy - 4Q 2021 EARNINGS / FEBRUARY 23, 2022 - Investors
Eagle Ford: 2022 Overview

➤ $37/bo PV-10 breakeven

➤ Anticipated 2022 ROR ~110% at $3/$62 flat

➤ Pricing assumption
    •   $0.50 – $0.90/bbl annual average in-basin premium to NYMEX pricing

                               4Q’21              1Q’22E              FY’22E
Net Production (mboe/d)          92               90 – 100           90 – 100
Wells Drilled                     1               15 – 20             45 – 65
Wells TIL’d                       5                 0–5               45 – 65
Rigs                             0.5                2–3                1–4

 ’22E Production Outlook     ’22E EBITDAX Outlook            ’22E Capital Plan

                                                                                                                                         0   10    20     40
                                                                                                                                                  Miles

                                                                                 Cost assumptions (net)         4Q’21   1Q’22E         FY’22E

                                                                                 LOE ($/boe)                    $6.25               $5.75 – $6.25

                                                                                 GP&T ($/boe)                   $9.29               $9.00 – $10.00

                                                                                 Total Capital (accrued, $mm)    $34    $75 – $85    $375 – $475

                    4Q’21 Earnings – February 23, 2022                                                                                        9
Answering the Call for Affordable, Reliable, Lower Carbon Energy - 4Q 2021 EARNINGS / FEBRUARY 23, 2022 - Investors
Reducing Direct GHG and Methane Emissions

                                                                      5.5                             0.09%
              0                                            GHG intensity goal for 2025,      Methane intensity goal for 2025,
    Routine flaring on wells                                  achieved in 2021                    achieved in 2021

                                                                     5.0                            0.08%
 completed in 2021 and beyond,
    enterprise-wide by 2025
                                                              (tCO2e/gross mboe produced)         (volume methane emissions/
                                                                                                  volume gross gas produced)

                                                   ➤ Advancing Our Sustainability Commitments

            100% RSG certified in Haynesville;                                              Intend to invest >$30mm in ESG initiatives,
            projected to be 100% RSG certified                                              including retrofitting >19,000 pneumatic
            in Marcellus by YE 2022                                                         devices by end of 2022, reducing reported
                                                                                            GHG emissions(1) by ~40% and methane
                                                                                            emissions by ~80%

            (1) As reported under 40 CFR 98 Subpart W

            4Q’21 Earnings – February 23, 2022                                                                                    10
Appendix

                                          H A Y N E S V I L L E

E A G L E   F O R D

                      M A R C E L L U S
Hedging Program Reduces Risk, Protects Returns
  ➤ Since 11/2/2021, CHK has hedged:
       • ~8% of 2022 gas at an average price of $4.03 – $5.06/mcf                                                                                         Average Hedged Price                                  FY’22                           FY’23

       • 244 bcf of 2023 gas at $3.03 – $4.00/mcf                                                                                                         Gas                                                $2.89 – $3.29                 $2.86 – $3.36
       • 4.4 mmbbl of 2023 oil at $65.00 – $79.09/bbl                                                                                                     Oil                                                   $44.30                 $59.51 – $69.25

                                                                                                                                                             NATURAL GAS                                                                            OIL
                                                                                                                SWAPS                           COLLARS               THREE-WAY COLLARS                         CALLS                SWAPS                COLLARS
Gas % Hedged   68%
                                                                                                                                                Bought    Sold              Sold        Bought   Sold                 Sold                                    Bought   Sold
                                                                                                           Volume Price Volume                                     Volume                                    Volume               Volume Price Volume
                                                                                             Date                                                 Put      Call              Put          Put     Call                 Call                                     Put    Call
                             58%           Oil % Hedged                                                      bcf  $/mcf   bcf
                                                                                                                                                 $/mcf    $/mcf
                                                                                                                                                                     bcf
                                                                                                                                                                            $/mcf        $/mcf   $/mcf
                                                                                                                                                                                                               bcf
                                                                                                                                                                                                                      $/mcf
                                                                                                                                                                                                                                  mmbbl $/bbl   mbbl
                                                                                                                                                                                                                                                               $/bbl   $/bbl

                                                                                           Q1 2022           176.7        2.88           18.0      2.50     2.86        –           –        –           –        –           –      3.2    43.57         –       –            –
                                                                                           Q2 2022           129.9        2.60           90.1      3.33     4.41      6.4     2.41        2.90     3.43           –           –      2.8    43.12         –       –            –
                                                                                           Q3 2022           134.0        2.63           93.8      3.41     4.56      6.4     2.41        2.90     3.43           –           –      2.7    44.85         –       –            –
                                                                                           Q4 2022           117.3        2.60      120.1          3.12     4.27      6.4     2.41        2.90     3.43           –           –      2.6    45.92         –       –            –
                                                                                           FY 2022           557.9        2.69      322.0          3.23     4.31     19.3     2.41        2.90     3.43           –           –     11.2    44.30         –       –            –
                                                                                           Q1 2023           120.6        2.64           28.6      3.04     4.28      0.9     2.50        3.40     3.79        18.0     3.29         1.9    47.17     0.2      65.00   83.53
                                                                                           Q2 2023             35.1       2.74           70.7      3.02     3.98      0.9     2.50        3.40     3.79           –           –        –       –      1.8      65.00   79.51
                                                                                           Q3 2023             33.7       2.76           71.5      3.02     3.98      0.9     2.50        3.40     3.79           –           –        –       –      1.4      65.00   78.04
                                                                                           Q4 2023             39.7       2.70           63.1      3.02     4.03      0.9     2.50        3.40     3.79           –           –        –       –      0.9      65.00   78.76
                                                                                           FY 2023           229.1        2.69      233.9          3.02     4.03      3.7     2.50        3.40     3.79        18.0     3.29         1.9    47.17     4.4      65.00   79.09

                 FY 2022

                     Note: Hedged volumes and prices reflect positions as of 2/21/2022. Chief E&D hedges included starting April 2022.

                     4Q’21 Earnings – February 23, 2022                                                                                                                                                                                                                 12
Hedged Basis Protection
  As of 2/21/2022                                                                                        ➤ 7% of Marcellus and 25% of Haynesville basis hedged for FY’22
                                                                                                         ➤ Since 11/2/2021, CHK has added basis protection for:
                                                                                                           • 134.8 bcf of 2022 gas at an average differential to NYMEX of $(0.28)
                                                                                                           • 7.8 mmbbl of 2022 oil at an average differential to WTI of $1.03
                                                                                                           • 54.9 bcf of 2023 gas at $(0.17)
ARGUS HOUSTON VS ARGUS WTI                                                                                 • 6.2 mmbbl of 2023 oil at $0.96
2022: 4.6 mmbbls @ $1.03/bbl
2023: 3.4 mmbbls @ $1.20/bbl
WTI-NYMEX ROLL
2022: 9.3 mmbbls @ $0.58/bbl                                                                                                     MARCELLUS                                          HAYNESVILLE                         TRANSPORT SPREAD(1)
2023: 2.8 mmbbls @ $0.68/bbl                                                                             TETCO M3                TGP Z4 300L             LEIDY            CGT MAINLINE           TGT Z1              TETCO M3         TRANSCO Z4

                                                                                                                      Avg.               Avg.                 Avg.                 Avg.                Avg.                 Avg.               Avg.
                                                                                                    Volume                      Volume               Volume               Volume             Volume                Volume            Volume
                                                                                     Date                             Price              Price                Price                Price               Price                Price              Price
                                                                                                      bcf                         bcf                  bcf                  bcf                bcf                   bcf               bcf
                                                                                                                      $/mcf              $/mcf                $/mcf                $/mcf               $/mcf                $/mcf              $/mcf
                                                                                   Q1 2022                6.8           0.59       7.7    (0.82)        4.5      (0.74)     33.8    (0.24)      14.7      (0.20)     11.1     0.79      1.4      0.33
                                                                                   Q2 2022                6.4          (0.74)      0.9    (1.00)        2.7      (1.08)     16.6    (0.22)      15.5      (0.28)     11.3     0.79       –             –
                                                                                   Q3 2022                6.4          (0.74)      0.9    (1.00)        2.8      (1.08)     16.8    (0.22)      15.6      (0.28)     11.4     0.79       –             –
                                                                                   Q4 2022                5.5           0.68       0.9    (0.82)        2.2      (0.95)     21.1    (0.22)       8.0      (0.23)      9.9     0.77       –             –
                     HOUSTON SHIP CHANNEL
                                                                                   FY 2022              25.1           (0.07)     10.4    (0.85)       12.1      (0.93)     88.3    (0.23)      53.8      (0.25)     43.7     0.78      1.4      0.33
                     2022: 12.1 bcf @ $0.02/mcf
                     2023: 1.4 bcf @ $0.05/mcf                                     Q1 2023                5.0           1.60       0.9    (0.74)        1.8      (0.85)     13.5    (0.23)       4.1      (0.15)      6.8     0.76       –             –
                     HSC INDEX SWAPS                                               Q2 2023                1.8          (0.86)       –            –      1.4      (1.05)     10.0    (0.22)       1.8      (0.21)      6.8     0.76       –             –
                     2022: 5.1 bcf @ $0.04/mcf
                                                                                   Q3 2023                1.8          (0.86)       –            –      1.4      (1.05)     10.1    (0.22)       1.8      (0.21)      6.9     0.76       –             –
                                                                                   Q4 2023                1.8           0.54       1.5    (0.82)        1.4      (0.84)     11.2    (0.22)       1.4      (0.17)      2.9     0.76       –             –
                                                                                   FY 2023              10.5            0.55       2.4    (0.79)        5.9      (0.94)     44.8    (0.22)       9.1      (0.17)     23.4     0.76       –             –

                        (1) TETCO M3 transport spread vs. TGP Z4 300L, Transco Z4 transport spread vs. CGT Mainline

                        4Q’21 Earnings – February 23, 2022                                                                                                                                                                                13
Pro Forma Maturity Profile
 PF net debt-to-2022E EBITDAX ratio(1)

 ~0.7x
 Preserving balance sheet strength

                                                                                       $1,250                                                                   ~6.5%(4)

                                                                                                                                                             $1,450

                                                                                                  4.5%                                  5.5%

                            RBL Capacity                                              ~$500(2)                                4.5%   $500
                            Pro Forma
                                                                                                                         $221(3)
                             2022                           2023                          2024                            2025       2026      2027   2028    2029

               (1)   A non-GAAP measure as defined in the appendix
               (2)   Net debt as of 12/31/2021 proforma Chief and PRB deal consideration over midpoint of 2022 Outlook
               (3)   Represents $221mm of CA-CIB and Natixis Tranche B
               (4)   $500mm at 5.875% and $950mm at 6.75%

               4Q’21 Earnings – February 23, 2022                                                                                                                          14
Management’s Outlook as of February 23, 2022
                                                                                                                                                                                                            2022E CHK
                                                                                                                                                                                                            Pro Forma(1)
                      Total production:
                          Oil – mmbbls                                                                                                                                                                        18.5 – 20.5
                          NGL – mmbbls                                                                                                                                                                         6.5 – 7.5
                          Natural gas – bcf                                                                                                                                                                 1,315 – 1,345
                            Total daily rate – mboe per day                                                                                                                                                   670 – 690
                      Estimated basis to NYMEX prices, based on 2/18/2022 strip prices:
                          Oil – $/bbl                                                                                                                                                                       $0.50 – $0.90
                          Natural gas – $/mcf                                                                                                                                                            ($0.45) – ($0.55)
                          NGL – realizations as a % of WTI                                                                                                                                                   40% – 45%
                      Operating costs per boe of projected production:
                          Production expense                                                                                                                                                                $1.60 – $1.90
                             Gathering, processing and transportation expenses                                                                                                                              $3.75 – $4.25
                               Oil – $/bbl                                                                                                                                                                  $2.70 – $2.90
                               Natural Gas – $/mcf                                                                                                                                                          $0.65 – $0.75
                          Severance and ad valorem taxes                                                                                                                                                    $0.75 – $0.85
                          General and administrative(2)                                                                                                                                                     $0.45 – $0.65
                          Depreciation, depletion and amortization expense                                                                                                                                  $7.00 – $8.00
                      Marketing net margin and other ($ in millions)                                                                                                                                          $10 – $20
                      Interest expense ($ in millions)                                                                                                                                                       $125 – $135
                      Cash taxes ($ in millions)                                                                                                                                                             $115 – $175
                      Adjusted EBITDAX, based on 2/18/2022 strip prices ($ in millions)(3)                                                                                                                $3,800 – $4,000
                      Total capital expenditures ($ in millions)                                                                                                                                          $1,500 – $1,800

        (1) Assumes closing of the Chief and Powder River Basin transactions effective April 1, 2022.
        (2) Includes ~$0.07/boe of expenses associated with stock-based compensation, which are recorded in general and administrative expenses in Chesapeake's Condensed Consolidated Statement of Operations.
        (3) Adjusted EBITDAX is a non-GAAP measure used by management to evaluate the company's operational trends and performance relative to other oil and natural gas producing companies. Adjusted EBITDAX excludes certain items that management believes affect the
            comparability of operating results. The most directly comparable GAAP measure is net income (loss), but it is not possible, without unreasonable efforts, to identify the amount or significance of events or transactions that may be included in future GAAP net income
            (loss) but that management does not believe to be representative of underlying business performance. The company further believes that providing estimates of the amounts that would be required to reconcile forecasted adjusted EBITDAX to forecasted GAAP net
            income (loss) would imply a degree of precision that may be confusing or misleading to investors. Items excluded from net income (loss) to arrive at adjusted EBITDAX include interest expense, income taxes, depreciation, depletion and amortization expense, and
            exploration expense as well as one-time items or items whose timing or amount cannot be reasonably estimated.

        4Q’21 Earnings – February 23, 2022                                                                                                                                                                                                                                              15
Reconciliation of Net Income (Loss) to Adjusted EBITDAX (unaudited)
                                                                                                                                                                    Successor                        Predecessor

                                                                                                                                                                 Three Months                       Three Months
                                                                                                                                                                    Ended                              Ended
                                                                                                                                                                 December 31,                       December 31,
                                                                                                                                                                     2021                               2020

                           ($ in millions)
                           Net income (loss) (GAAP)                                                                                                         $                      1,434 $                            (416)

                           Adjustments:

                              Interest expense                                                                                                                                          26                                 24

                              Income tax benefit                                                                                                                                      (39)                                (6)
                              Depreciation, depletion and amortization                                                                                                                340                                166
                              Exploration                                                                                                                                                 3                                10
                              Unrealized gains on oil and natural gas derivatives                                                                                                (1,163)                                (45)
                              Separation and other termination costs                                                                                                                    —                                    1
                              Gains on sales of assets                                                                                                                                  (3)                             (29)
                              Other operating expense, net                                                                                                                              89                                 11
                              Impairments                                                                                                                                               —                                  13
                              Reorganization items, net                                                                                                                                 —                                579
                              Other                                                                                                                                                     —                                 (4)
                           Adjusted EBITDAX (Non-GAAP)                                                                                                      $                         687 $                              304

        Adjusted EBITDAX is not a measure of financial performance under GAAP, and should not be considered as an alternative to, or more meaningful than, net income (loss) prepared in accordance with GAAP. Adjusted EBITDAX excludes certain items that management believes
        affect the comparability of operating results. The company believes this non-GAAP financial measure is a useful adjunct to cash flow provided by operating activities because: (i) Management uses adjusted EBITDAX to evaluate the company's operational trends and performance
        relative to other oil and natural gas producing companies. (ii) Adjusted EBITDAX is more comparable to estimates provided by securities analysts. (iii) Items excluded generally are one-time items or items whose timing or amount cannot be reasonably estimated. Accordingly, any
        guidance provided by the company generally excludes information regarding these types of items. Because adjusted EBITDAX excludes some, but not all, items that affect net income (loss), our calculations of adjusted EBITDAX may not be comparable to similarly titled measures
        of other companies.

        4Q’21 Earnings – February 23, 2022                                                                                                                                                                                                                                             16
Reconciliations of Adjusted Free Cash Flow and Net Debt

                   ADJUSTED FREE CASH FLOW

                                                                         Successor         Predecessor

                                                                     Three Months      Three Months
                                                                        Ended             Ended
                                                                     December 31,      December 31,
                                                                         2021              2020
                  ($ in millions)
                  Net cash provided by operating activities (GAAP)   $          563    $               9
                    Cash paid for reorganization items, net                      —                  22
                    Cash paid for acquisition costs                              74                  —
                    Capital expenditures                                       (265)              (169)
                  Adjusted free cash flow (Non-GAAP)                 $          372    $          (138)

                   NET DEBT

                                                                                           Successor

                                                                                       December 31,
                                                                                           2021
                  ($ in millions)
                  Total debt (GAAP)                                                    $          2,278
                    Premiums and issuance costs on debt                                           (107)
                  Principal amount of debt                                                        2,171
                    Cash and cash equivalents                                                      905
                  Net debt (Non-GAAP)                                                  $          1,266

        4Q’21 Earnings – February 23, 2022                                                                 17
Non-GAAP Financial Measures
This document includes non-GAAP financial measures. Such non-GAAP measures should not be considered as an alternative to, or more meaningful than, GAAP measures.
The Company’s management believes that these measures provide useful information to external users of the Company’s consolidated financial statements, such as industry
analysts, lenders and ratings agencies. Due to the forward-looking nature of adjusted EBITDAX, net debt, projected free cash flow, free cash flow yield and free cash flow per
share used herein, management cannot reliably predict certain of the necessary components of the most directly comparable forward-looking GAAP measures. Accordingly, the
Company is unable to present a quantitative reconciliation of such forward-looking non-GAAP financial measures to their most directly comparable forward-looking GAAP
financial measures without unreasonable effort. Amounts excluded from these non-GAAP measures in future periods could be significant.

Adjusted EBITDAX: Adjusted EBITDAX is a non-GAAP measure used by management to evaluate the Company’s operational trends and performance relative to other oil and
natural gas producing companies. Adjusted EBITDAX excludes certain items that management believes affect the comparability of operating results. The most directly
comparable GAAP measure is net income (loss). Items excluded from net income (loss) to arrive at adjusted EBITDAX include interest expense, income taxes, depreciation,
depletion and amortization expense, and exploration expense as well as one-time items or items whose timing or amount cannot be reasonably estimated.

Net Debt: Net debt is defined as total GAAP debt excluding premiums, discounts, and deferred issuance costs less cash and cash equivalents. Net debt is presented as a
widely understood measure of liquidity, but should not be considered as an alternative to, or more meaningful than, total debt presented in accordance with GAAP.

Adjusted Free Cash Flow, Adjusted Free Cash Flow Yield and Adjusted Free Cash Flow Per Share:
•   Adjusted free cash flow is defined as net cash provided by operating activities (GAAP), less cash capital expenditures.
•   Adjusted free cash flow yield is defined as adjusted free cash flow divided by market capitalization.
•   Adjusted free cash flow per share is defined as adjusted free cash flow divided by the Company’s outstanding shares of common stock.

Adjusted free cash flow, free cash flow yield and adjusted free cash flow per share are non-GAAP supplemental financial measures used by the Company’s management to
assess liquidity, including the Company’s ability to generate cash flow in excess of its capital requirements and return cash to shareholders. Adjusted free cash flow, adjusted
free cash flow yield and adjusted free cash flow per share should not be considered as alternatives to, or more meaningful than, net cash provided by operating activities, or any
other measure of liquidity presented in accordance with GAAP.

Pro Forma: Company measures after Vine acquisition, Chief acquisition and Powder River Basin divestiture.

                       4Q’21 Earnings – February 23, 2022                                                                                                                      18
You can also read