Antimicrobial consumption in the EU/EEA (ESAC-Net)
←
→
Page content transcription
If your browser does not render page correctly, please read the page content below
SURVEILLANCE REPORT
Antimicrobial consumption in the
EU/EEA (ESAC-Net)
Annual Epidemiological Report for 2020

 Key facts
 •     For 2020, twenty-nine countries (27 European Union (EU) Member States and two European Economic
       Area (EEA) countries - Iceland and Norway) reported data on antimicrobial consumption. Twenty-five
       countries reported data for both community and hospital consumption; two countries (Germany and
       Iceland) reported only community consumption, and two countries (Cyprus and Czechia) reported total
       consumption for both sectors combined.
 •     The Anatomical Therapeutic Chemical (ATC) classification index with defined daily doses (DDD) 2021 was
       used for the analysis of both 2020 data and historical data. Antimicrobial consumption is expressed as
       DDD per 1 000 inhabitants per day.
 •     In 2020, the mean total (community and hospital sector combined) consumption of antibacterials for
       systemic use (ATC group J01) in the EU/EEA was 16.4 DDD per 1 000 inhabitants per day (country
       range: 8.5–28.9). During the period 2011–2020, a statistically significant decrease was observed for the
       EU/EEA overall, as well as for eight individual countries. A statistically significant increasing trend was
       observed for two countries.
 •     The EU/EEA mean total (community and hospital sector combined) consumption of antivirals for systemic
       use (ATC group J05) was 2.56 DDD per 1 000 inhabitants per day (country range: 0.59–11.19), with no
       statistically significant trends in the five-year period between 2016–2020.

 Community (primary care sector)
 •     In the community, the EU/EEA mean consumption of antibacterials for systemic use (ATC group J01) was
       15.0 DDD per 1 000 inhabitants per day (country range: 7.1–26.4). During the period 2011–2020, a
       statistically significant decrease was observed for the EU/EEA overall, as well as for 11 individual
       countries. A statistically significant increasing trend was observed for one country.
 •     Between 2011 and 2020, there were statistically significant decreases in the EU/EEA mean for
       consumption of certain sub-groups of antibacterials in the community. This applied to tetracyclines
       (J01A), cephalosporins and other beta-lactam antibacterials (J01D), macrolides, lincosamides,
       streptogramins (J01F) and quinolones (J01M). No significant EU/EEA trends were detected for penicillins
       (ATC group J01C), sulfonamides or trimethoprim (ATC group J01E).
 •     The average ratio of consumption of broad-spectrum penicillins, cephalosporins, macrolides (except
       erythromycin) and fluoroquinolones to the consumption of narrow-spectrum penicillins, cephalosporins
       and macrolides (i.e. erythromycin) in the community was 3.5 (country range: 0.1–19.1). During the
       period 2011–2020, a statistically significant increasing trend was observed for the EU/EEA overall and for
       nine individual countries. Statistically significant decreasing trends were observed for eight countries.
 •     The EU/EEA mean consumption of antimycotics and antifungals for systemic use (ATC groups J02 and
       D01B) in the community was 0.9 DDD per 1 000 inhabitants per day (country range: 0.3–3.0).

Suggested citation: European Centre for Disease Prevention and Control. Antimicrobial consumption in the EU/EEA (ESAC-Net) -
Annual Epidemiological Report 2020. Stockholm: ECDC; 2021.
Stockholm, November 2021
© European Centre for Disease Prevention and Control, 2021. Reproduction is authorised, provided the source is acknowledged.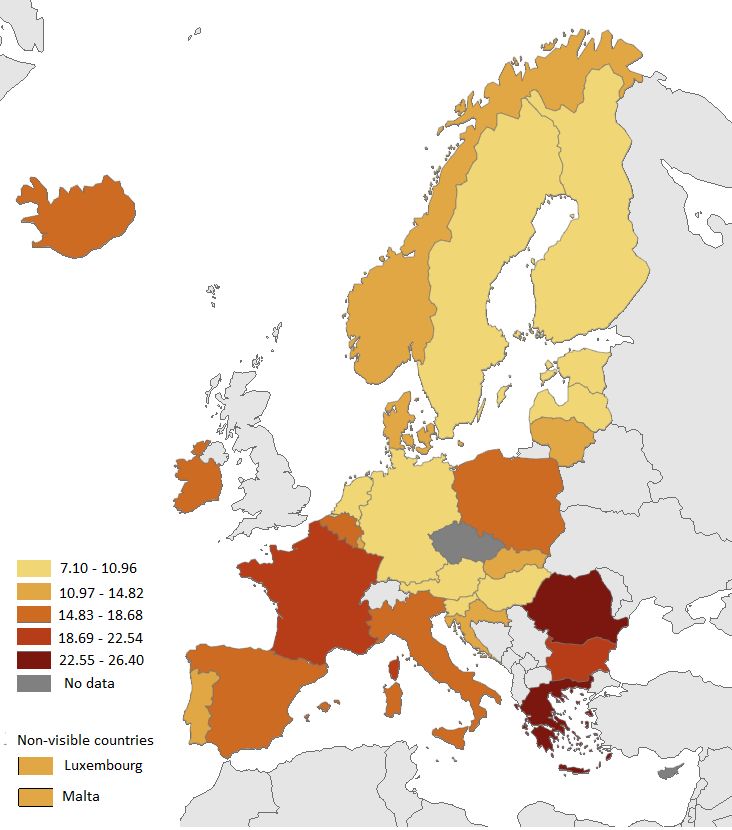
Antimicrobial consumption in the EU/EEA – AER 2020                                                        SURVEILLANCE REPORT

    Hospital sector
    •     In the hospital sector, the EU/EEA mean consumption of antibacterials for systemic use (ATC group J01)
          was 1.6 DDD per 1 000 inhabitants per day (country range: 0.8–2.2). During the period 2011–2020, no
          statistically significant trend was observed at EU/EEA level. Statistically significant decreasing trends were
          observed for five countries, and a statistically significant increasing trend were observed for two countries.
    •     In the EU/EEA hospital sector, there were statistically significant decreases in the mean 10-year trends
          for consumption of quinolones (ATC group J01M), and a statistically significant increase for other beta-
          lactam antibacterials (ATC group J01D) and sulfonamides and trimethoprim (ATC group J01E). No
          significant EU/EEA trends were detected for consumption of tetracyclines (ATC group J01A), penicillins
          (ATC group J01C) or macrolides, lincosamides and streptogramins (ATC group J01F).
    •     Of the total consumption of antibacterials for systemic use in the hospital sector, the average proportion
          of glycopeptides, third- and fourth-generation cephalosporins, monobactams, carbapenems,
          fluoroquinolones, polymyxins, piperacillin and enzyme inhibitors, linezolid, tedizolid and daptomycin
          consumed was 38.6% (country range: 19.5–62.6%). During the period 2011–2020, statistically
          significant increasing trends were observed for the EU/EEA overall and for six countries, while one
          country showed a statistically significant decreasing trend.
    •     The EU/EEA mean consumption of antimycotics and antifungals for systemic use (ATC groups J02 and
          D01B) in the hospital sector was 0.13 DDD per 1 000 inhabitants per day (country range: 0.04–0.26).

    Change in the consumption of antibacterials for systemic use (ATC
    group J01) between 2019 and 2020
    •     Between 2019 and 2020, there was an overall decrease in the EU/EEA population-weighted mean total
          (community and hospital sectors combined) consumption of antibacterials for systemic use (ATC group
          J01) from 19.9 DDD per 1 000 inhabitants per day in 2019 to 16.4 DDD per 1 000 inhabitants per day in
          2020. This represented a 17.6% decrease.
    •     In the community, the EU/EEA population-weighted mean decreased from 18.3 DDD per 1 000
          inhabitants per day in 2019 to 15.0 DDD per 1 000 inhabitants per day in 2020 - a 18.3% decrease.
    •     In the hospital sector, the EU/EEA population-weighted mean decreased from 1.64 DDD per 1 000
          inhabitants per day in 2019 to 1.57 DDD per 1 000 inhabitants per day in 2020 - a 4.5% decrease.
    •     At country level, a majority of countries reported a substantial decrease between 2019 and 2020, for
          both the community and the hospital sector, although the decreases were generally larger in the
          community than in the hospital sector. Seven countries (Estonia, Greece, Hungary, Italy, Latvia, Malta,
          Portugal) reported a decrease in the community, but an increase in the hospital sector. Only one country
          (Bulgaria) reported an increase in both the community and the hospital sector.
    * Important note: data were updated using the ATC/DDD Index 2021, which included several DDD alterations implemented
    in 2019. Data in this report should therefore not be compared with data reported by ECDC prior to 2019. For the most recent
    data on antimicrobial consumption and trends in EU/EEA countries, readers should refer to the most recent report, or the
    ESAC-Net interactive database.

Methods
This report is based on data reported to the European Surveillance of Antimicrobial Consumption Network (ESAC-
Net) for the period 2011 to 2020, retrieved from The European Surveillance System (TESSy) on 10 September
2021. TESSy is a system for the collection, storage, analysis and dissemination of data on communicable diseases,
allowing for correction and re-uploading of historical data by the reporting countries. Therefore, the latest
published reports supersede previous reports and reflect the most recent available data. For a detailed description
of the methods used to produce this report, please refer to the methods chapter in the introduction to the ECDC
Annual Epidemiological Report [1] and the ESAC-Net reporting protocol [2]. A subset of the data used for this
report is available from ECDC’s online antimicrobial consumption database [3].
Antimicrobial consumption (AMC) data were collected using the Anatomical Therapeutic Chemical (ATC)
classification system and analysed using the defined daily dose (DDD) methodology developed by the World Health
Organization (WHO) Collaborating Centre for Drug Statistics Methodology (Oslo, Norway). For the analysis, DDDs
listed in the ATC Index for 2021 were used [4]. One DDD represents the assumed average maintenance dose per
day for a drug used in its main indication by adults. It is a technical unit of measurement, not a standard for
appropriate use. Application of the ATC/DDD methodology makes it possible to aggregate different brands of
medicines with different pack sizes and strengths into units of measurement of active substances. It represents a
standard in performing valid and reliable cross-national or longitudinal studies of AMC. DDD values of some
medicines may change over time because of alterations in the main indication, or regulatory amendments to the
recommended or prescribed daily dose. In case of such changes, all historical data require retrospective
adjustments to the latest DDD/ATC index [4].

2
SURVEILLANCE REPORT                                                  Antimicrobial consumption in the EU/EEA – AER 2020

There are three major categories of antimicrobials under surveillance:
•      antibacterials for systemic use (ATC group J01);
•      antimycotics and antifungals for systemic use (ATC groups J02 & D01B);
•      antivirals for systemic use (ATC group J05).
Due to the structure of the ATC classification, some antibacterials under surveillance are classified in ATC groups
other than J01. Thus, vancomycin and fidaxomicin for oral administration are classified as ‘intestinal anti-infectives,
antibiotics’ in ATC group A07AA, and are used against Clostridioides (Clostridium) difficile infections. Metronidazole,
which may also be administered orally for C. difficile, is classified as an ‘agent against amoebiasis and other
protozoal diseases, nitroimidazole derivates’ in ATC group P01AB.
The indicator ‘defined daily doses (DDD) per 1 000 inhabitants per day’ is used to report antibiotic consumption in
the community (i.e. outside hospitals). It provides a rough estimate of the proportion of the population treated
daily with antimicrobials. The indicator ‘DDD per 1 000 inhabitants per day’ is also used to report antibiotic
consumption in the hospital sector, although another indicator (‘DDD per 100 occupied bed-days’) has been
recommended for reporting hospital consumption [5,6]. This is because uniformly defined denominator data on the
total number of occupied bed-days are currently unavailable for all EU/EEA countries. In addition, presenting data
with the same denominator enables cross-sectoral comparison.
The indicator ‘DDD per 1 000 inhabitants per day’ has also been selected as the primary harmonised outcome
indicator by ECDC, the European Food Safety Authority (EFSA) and the European Medicines Agency (EMA) to
describe total AMC in humans, combining both the community and hospital sectors. Similarly, the pattern of AMC
was selected as a secondary harmonised outcome indicator for AMC following the agreement of an expert group
convened by ECDC, EFSA and EMA, and at the request of the European Commission. For the community, the
agreed indicator is the ratio of consumption of broad-spectrum penicillins, cephalosporins, macrolides (except
erythromycin) and fluoroquinolones to the consumption of narrow-spectrum penicillins, cephalosporins and
erythromycin. For the hospital sector, the agreed indicator is the proportion of glycopeptides, 3rd- and 4th-
generation cephalosporins, monobactams, carbapenems, fluoroquinolones, polymyxins, piperacillin and enzyme
inhibitors, linezolid, tedizolid and daptomycin of the total hospital consumption of antibacterials for systemic use
[7]. In addition, some of the ‘consensus-based quality indicators’, published in 2007 by the European Surveillance
of Antimicrobial Consumption (ESAC) project were applied to describe AMC [8].
Consumption data were collected for the community (primary care) sector and the hospital (secondary care and
tertiary care) sector as a detailed list of all available antimicrobial products (register) and the annual number of
packages consumed, or, if unavailable, as the number of DDD per ATC substance and route of administration.
Consumption of antibacterials for systemic use and of antimycotics and antifungals for systemic use are presented
separately for the community and the hospital sector, while consumption of antivirals for systemic data are
combined for the community and the hospital sector.

Data analysis
National data
For each country, AMC expressed as DDD per 1 000 inhabitants per day is displayed as reported to The European
Surveillance System (TESSy). Missing data for a specific year and sector are displayed as an empty cell in the
tables.

EU/EEA population-weighted means
EU/ EEA
The EU/EEA population-weighted mean, labelled as ‘EU/EEA’, is calculated by multiplying DDD per 1 000
inhabitants per day for each country with the corresponding Eurostat population, and dividing the product by the
total population of all participating countries contributing data for the same year. Annual population data were
retrieved from the Eurostat online database [9].
To allow for comparison of the EU/EEA population-weighted mean between years and assess trends, imputations
were performed to replace missing data in order to ensure that the number of countries (and hence population
under surveillance) were consistent for all years. Missing values for country-specific univariate time series were
imputed by one of the following interpolation methods: linear interpolation, Spline regression or weighted moving
average algorithms (where the missing values are replaced by moving average values). Missing values were
imputed using the R package ‘imputeTS’.
When a country only reported combined community and hospital sector data (‘total care’) for a specific year, the
value was corrected using mean distribution between hospital and community sector, obtained from the other
years in the studied period. If the country had not reported separate community and hospital data for any of the
years during the studied time period (e.g. Iceland), the EU/EEA mean distribution was used.

                                                                                                                       3
Antimicrobial consumption in the EU/EEA – AER 2020 SURVEILLANCE REPORT For Spain, the community consumption data reported for the years 2011−2015 were adjusted proportionally due to the change in reported data sources from 2016 onwards. Spain changed reporting from reimbursement data to sales data, which resulted in a substantial technical increase in AMC compared with previous years, as the reimbursement data did not include consumption without a prescription and other non-reimbursed courses. As the United Kingdom (UK) left the EU in 2020 and data are no longer reported to ESAC-Net, the EU/EEA mean does not include the UK. For the hospital sector, where missing data were more frequent, countries were not included in the EU/EEA mean if they reported data for less than five years. Trend analysis To assess whether the EU/EEA 10-year trend in consumption of antibacterials for systemic use (ATC J01) or a sub- group was statistically significant, a linear regression model was applied. To describe the trends, the terms ‘increase’ or ‘decrease’ were used if the p-value for the regression coefficient was statistically significant (P≤0.05). In the case of antivirals for systemic use, five-year trends were assessed. Trend analyses were only performed if the country reported eight or more consecutive years of data. Additionally, trend analyses were not performed when there has been a changes in the type of data or change in data process As the United Kingdom left the EU in 2020 and data are no longer reported to ESAC-Net, EU/EEA trend analyses do not include the United Kingdom and results cannot be directly compared with those published in previous years. EU/EEA means including UK data for the period 2011 to 2019 are still presented for reference, but no trend analyses were performed. Compound annual growth rate To illustrate changes in AMC rates over time, we calculated the compound annual growth rate (CAGR) of total antibiotic consumption for each country [10]. The CAGR corresponds to the mean annual change as a proportion (%) of the consumption in the year of commencement. More details on the methods, collection, validation and reporting of AMC data from EU/EEA countries are available from the ESAC-Net pages on ECDC’s website. They are also described in the ESAC-Net surveillance reports [11]. The most recent data on AMC are available from the public ESAC-Net interactive database (data for 1997‒2020) on ECDC’s website [3]. Antimicrobial consumption All 27 EU Member States and two EEA countries (Iceland and Norway) reported data on antimicrobial consumption (AMC) for 2020. Twenty-five countries reported both community and hospital consumption, two countries (Germany and Iceland) reported only community consumption, and two countries (Cyprus and Czechia) reported total consumption for both sectors combined. For both the community and the hospital sector, consumption data were mainly based on sales of antimicrobials in the country, or a combination of sales and reimbursement data. Total consumption (community and hospital sector) of antibacterials for systemic use (ATC group J01) ECDC/EFSA/EMA primary indicator for total consumption of antibacterials for systemic use (ATC group J01) in humans In 2020, the mean total consumption (community and hospital sector combined) of antibacterials for systemic use (ATC group J01) in the EU/EEA was 16.4 DDD per 1 000 inhabitants per day, ranging from 8.5 in the Netherlands to 28.9 in Cyprus. During the period 2011–2020, a statistically significant decrease was observed for the EU/EEA overall. The decrease between 2019 and 2020 was considerably larger than in previous years. Statistically significant decreasing trends were observed for eight countries, and statistically significant increasing trends were observed for two countries (Table 1). 4
SURVEILLANCE REPORT Antimicrobial consumption in the EU/EEA – AER 2020
Table 1. Total consumption (community and hospital sector) of antibacterials for systemic use (ATC
group J01) by country, EU/EEA and the United Kingdom, 2011–2020 (expressed as DDD per 1 000
inhabitants per day)
All country data are shown as they are reported to The European Surveillance System.
= Total care data (community and hospital sector) not reported.
* EU/EEA refers to the corresponding population-weighted mean consumption based on reported or imputed antimicrobial
consumption data from all 29 EU/EEA countries, and excludes the United Kingdom. Country adjustments were applied as detailed
in the Methods chapter.
N/A = Not applicable. Trend analyses were not performed and CAGR not calculated because of missing data, changes in the type
of data or change in data process.
† = Spain reported reimbursement data for 2011−2015 and changed to sales data in 2016.
Luxembourg changed data process in 2020, which could impact comparability with previous years.
For details, please refer to the Methods chapter.
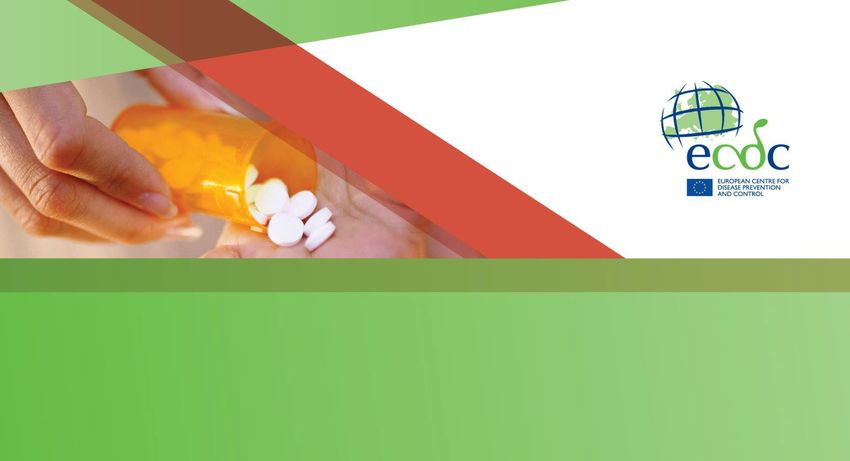
5Antimicrobial consumption in the EU/EEA – AER 2020 SURVEILLANCE REPORT Community consumption of antibacterials for systemic use (ATC group J01) In 2020, the EU/EEA population-weighted mean consumption of antibacterials for systemic use in the community (i.e. outside of hospitals) was 15.0 DDD per 1 000 inhabitants per day, ranging from 7.1 in Austria to 26.4 in Greece (Figure 1). Figure 1. Community consumption of antibacterials for systemic use (ATC group J01), by country, EU/EEA countries, 2020 (expressed as DDD per 1 000 inhabitants per day) Consumption of major sub-groups of antibacterials for systemic use (ATC group J01) in the community in 2020 is presented in Table 2 and Figure 3. Among the 27 countries reporting community data, penicillins (ATC group J01C) were the most frequently used antibacterials in all but two countries (Bulgaria and Slovakia), where macrolides, lincosamides and streptogramins (ATC group J01F) were the most frequently used. The proportion of other antibacterial groups varied more widely among countries. For example, other beta-lactams (ATC group J01D) ranged from 0.2% in Denmark to 25% in Slovakia; macrolides, lincosamides and streptogramins (ATC group J01F) ranged from 4% in Finland to 28% in Bulgaria, and quinolones (ATC group J01M), from 2% in Ireland and Norway to 16% in Bulgaria. 6
SURVEILLANCE REPORT                                                       Antimicrobial consumption in the EU/EEA – AER 2020

Table 2. Community consumption of antibacterials for systemic use (ATC group J01) at ATC group level 3,
by country, EU/EEA, 2020 (expressed as DDD per 1 000 inhabitants per day)

*J01B: Amphenicols; J01G: Aminoglycoside antibacterials; J01R: Combinations of antibacterials.

EU/EEA refers to the corresponding population-weighted mean consumption based on reported data for the community sector in
2020 (27 countries).

                                                                                                                             7
Antimicrobial consumption in the EU/EEA – AER 2020 SURVEILLANCE REPORT Figure 2. Community consumption of antibacterials for systemic use (ATC group J01) at ATC group level 3, by country, EU/EEA, 2020 (expressed as DDD per 1 000 inhabitants per day) EU/EEA refers to the corresponding population-weighted mean consumption based on the reported community data for 2020 (27 countries). 8
SURVEILLANCE REPORT                                                      Antimicrobial consumption in the EU/EEA – AER 2020

The EU/EEA population-weighted mean consumption of antibacterials for systemic use decreased from 19.0 DDD per
1 000 inhabitants per day in 2011 to 15.0 in 2020, a change that is statistically significant (Table 3). Statistically
decreasing trends were observed for 11 countries, while a significant increasing trend was observed for one country.
Table 3. Community consumption of antibacterials for systemic use (ATC group J01), by country,
EU/EEA and the United Kingdom, 2011–2020 (expressed as DDD per 1 000 inhabitants per day)

All country data are shown as they are reported to The European Surveillance System.
        = Community sector data not reported.
* EU/EEA refers to the corresponding population-weighted mean consumption based on reported or imputed antimicrobial
consumption data from all 29 EU/EEA countries, and excludes the United Kingdom. Country adjustments were applied as detailed
in the Methods chapter.

N/A = Not applicable. Trend analyses were not performed and CAGR not calculated because of missing data, changes in the type
of data or change in data process.
† = Spain reported reimbursement data for 2011−2015 and changed to sales data in 2016.
Luxembourg changed data process in 2020, which could impact comparability with previous years.
For details, please refer to the Methods chapter.
There were statistically significant decreases in the EU/EEA mean 10-year trends relating to consumption of sub-
groups of antibacterials in the community for tetracyclines (ATC group J01A), other beta-lactam antibacterials (ATC
group J01D), macrolides, lincosamides, streptogramins (ATC group J01F) and quinolones (ATC group J01M). No
significant EU/EEA mean 10-year trends were detected for penicillins (ATC group J01C), or sulfonamides and
trimethoprim (ATC group J01E).
Trends in consumption of sub-groups of antibacterials in the community are available as downloadable tables (D1-
D7) on ECDC’s website.

                                                                                                                           9
Antimicrobial consumption in the EU/EEA – AER 2020 SURVEILLANCE REPORT
ECDC/EFSA/EMA secondary indicator for consumption of
antibacterials for systemic use (ATC group J01) in the community
The ratio of consumption of broad-spectrum penicillins, cephalosporins, macrolides (except erythromycin) and
fluoroquinolones (J01(CR+DC+DD+(FA–FA01)+MA)) to the consumption of narrow-spectrum penicillins,
cephalosporins and erythromycin (J01(CA+CE+CF+DB+FA01)) is presented in Table 4. In 2020, the average ratio
was 3.5 (country range: 0.1–19.1). During the period 2011–2020, a statistically significant increasing trend was
observed for the EU/EEA overall and for nine individual countries. Statistically significant decreasing trends were
observed for eight countries.
Table 4. Ratio of consumption of broad-spectrum penicillins, cephalosporins, macrolides (except
erythromycin) and fluoroquinolones to consumption of narrow-spectrum penicillins, cephalosporins
and erythromycin in the community, by country, EU/EEA and the United Kingdom, 2011–2020
(expressed as DDD per 1 000 inhabitants per day)
All country data are shown as they are reported to The European Surveillance System.
= Community sector data not reported.
* EU/EEA refers to the corresponding population-weighted mean consumption based on reported or imputed antimicrobial
consumption data from all 29 EU/EEA countries, and excludes the United Kingdom. Country adjustments were applied as detailed
in the Methods chapter.
N/A = Not applicable. Trend analyses were not performed and CAGR not calculated because of missing data, changes in the type
of data or change in data process.
† = Spain reported reimbursement data for 2011-2015 and changed to sales data in 2016.
Luxembourg changed data process in 2020, which could impact comparability with previous years.
For details, please refer to the Methods chapter.
The relative consumption of beta-lactamase-sensitive penicillins, combinations of penicillins including beta-
lactamase inhibitors, third- and fourth-generation cephalosporins and fluoroquinolones, and the ratio of broad- to
narrow-spectrum antibacterials (i.e. the ‘consensus-based quality indicators’) are presented in Table D8 and
Figures D1, D2 and D4.
10SURVEILLANCE REPORT Antimicrobial consumption in the EU/EEA – AER 2020
Hospital sector consumption of antibacterials for systemic
use (ATC group J01)
In 2020, the EU/EEA population-weighted mean consumption of antibacterials for systemic use in the hospital sector
was 1.6 DDD per 1 000 inhabitants per day, ranging from 0.8 in the Netherlands to 2.2 in Lithuania (Figure 3).
Figure 3. Hospital sector consumption of antibacterials for systemic use (ATC group J01), EU/EEA
countries, 2020 (expressed as DDD per 1 000 inhabitants per day)
Finland: data include consumption in remote primary healthcare centres and nursing homes.
Consumption of major sub-groups of antibacterials for systemic use (ATC group J01) in the hospital sector in 2020
is presented in Table 5 and Figures 5 and 6. Substantial variations were reported across countries: the percentage
of penicillins (ATC group J01C) consumed out of total consumption of antibacterials for systemic use ranged from
7% (Bulgaria) to 56% (Denmark and Sweden). For cephalosporins and other beta-lactams (ATC group J01D,
including carbapenems), this proportion ranged from 11% (Malta and Sweden) to 51% (Bulgaria). For macrolides,
lincosamides and streptogramins (ATC group J01F), it ranged from 4% (Lithuania) to 16% (Hungary and Italy),
and for quinolones (ATC group J01M) from 3% (Norway) to 17% (Bulgaria).
11Antimicrobial consumption in the EU/EEA – AER 2020 SURVEILLANCE REPORT Table 5. Hospital sector consumption of antibacterials for systemic use (ATC group J01), by country and ATC group, EU/EEA and the United Kingdom, 2020 (expressed as DDD per 1 000 inhabitants per day) (a) Finland: data include consumption in remote primary healthcare centres and nursing homes. *J01B: Amphenicols; J01G: Aminoglycoside antibacterials; J01R: Combinations of antibacterials EU/EEA refers to the corresponding population-weighted mean consumption based on countries that provided hospital sector data for 2020 (25 countries). 12
SURVEILLANCE REPORT                                                      Antimicrobial consumption in the EU/EEA – AER 2020

Figure 4. Hospital sector consumption of antibacterials for systemic use (ATC group J01), by country
and ATC group, EU/EEA, 2020 (expressed as DDD per 1 000 inhabitants per day)

(a) Finland: data include consumption in remote primary healthcare centres and nursing homes.
EU/EEA refers to the corresponding population-weighted mean consumption based on countries that provided hospital sector
data for 2020 (25 countries).

                                                                                                                           13
Antimicrobial consumption in the EU/EEA – AER 2020 SURVEILLANCE REPORT
The EU/EEA population-weighted mean consumption of antibacterials for systemic use in the hospital sector
decreased from 1.69 DDD per 1 000 inhabitants per day in 2011 to 1.57 in 2020, however this trend was not
statistically significant. In the individual countries, statistically decreasing trends were observed for five countries,
and a significant increasing trend was observed for two countries (Table 6).
Table 6. Hospital sector consumption of antibacterials for systemic use (ATC group J01), by country,
EU/EEA and the United Kingdom, 2011–2020 (expressed as DDD per 1 000 inhabitants per day)
All country data are shown as they are reported to The European Surveillance System.
= Hospital sector data not reported.
(a) Finland: data include consumption in remote primary healthcare centres and nursing homes.
* EU/EEA refers to the corresponding population-weighted mean consumption based on reported or imputed antimicrobial
consumption data from all 29 EU/EEA countries, and excludes the United Kingdom.
N/A = Not applicable. Trend analyses were not performed and CAGR not calculated because of missing data, changes in the type of data
or change in data process. Luxembourg changed data process in 2020, which could impact comparability with previous years.
For details, please refer to the Methods chapter.
There were statistically significant decreases in the EU/EEA mean 10-year trends for sub-groups of antibacterials
consumed in the hospital sector as regards quinolones (ATC group J01M), and a statistically significant increase for
other beta-lactam antibacterials (ATC group J01D) and sulfonamides and trimethoprim (ATC group J01E). No
significant EU/EEA trends were detected for tetracyclines (ATC group J01A), penicillins (ATC group J01C) or
macrolides, lincosamides and streptogramins (ATC group J01F). Trends in consumption of sub-groups of
antibacterials are available as downloadable tables on ECDC’s website.
14SURVEILLANCE REPORT Antimicrobial consumption in the EU/EEA – AER 2020
Consumption of specific antimicrobial groups used to treat patients infected
with healthcare-associated resistant bacteria in the hospital sector
In 2020, consumption of carbapenems (ATC group J01DH) was 0.05 DDD per 1 000 inhabitants per day. Between
2011 and 2020, the EU/EEA population-weighted mean consumption of carbapenems showed a statistically
significant increase (Table D9). During the period 2011−2020, a statistically significant increase was observed for
11 countries (Bulgaria, Croatia, Estonia, Greece, Hungary, Ireland, Italy, Latvia, Lithuania, Poland, Slovakia), and a
statistically decreasing trend was observed in five countries (Belgium, Finland, Norway, Portugal and Slovenia)
(Table D12).
The EU/EEA population-weighted mean consumption of polymyxins (ATC group J01XB) showed a statistically
significant increase between 2011 and 2020. During the period 2011−2020, a statistically significant increase was
observed for 10 countries (Croatia, Greece, Hungary, Italy, Latvia, Poland, Portugal, Slovakia, Spain and Sweden) and
a statistically significant decreasing trend was seen in two countries (Ireland and the Netherlands) (Table D17).
ECDC/EFSA/EMA secondary indicator for consumption of
antibacterials for systemic use (ATC group J01) in the hospital sector
The proportion of glycopeptides, third- and fourth-generation cephalosporins, monobactams, carbapenems,
fluoroquinolones, polymyxins, piperacillin and enzyme inhibitors, linezolid, tedizolid and daptomycin out of the total
hospital consumption of antibacterials for systemic use is presented in Table 7.
The average proportion was 38.6% and ranged from 19.5% in Norway to 62.6% in Bulgaria. During the period
2011–2020, statistically significant increasing trends were observed for the EU/EEA overall and for seven countries,
while one country showed a statistically significant decreasing trend (Table 7).
15Antimicrobial consumption in the EU/EEA – AER 2020 SURVEILLANCE REPORT
Table 7. Proportion (%) of glycopeptides, third- and fourth-generation cephalosporins, monobactams,
carbapenems, fluoroquinolones, polymyxins, piperacillin and enzyme inhibitors, linezolid, tedizolid and
daptomycin (DDD per 1 000 inhabitants per day) out of total hospital consumption of antibacterials for
systemic use, by country, EU/EEA and the United Kingdom, 2011–2020
All country data are shown as they are reported to The European Surveillance System.
= Hospital sector data not reported.
(a) Finland: data include consumption in remote primary healthcare centres and nursing homes.
* EU/EEA refers to the corresponding population-weighted mean consumption based on reported or imputed antimicrobial
consumption data from all 29 EU/EEA countries, and excludes the United Kingdom.
N/A = Not applicable. Trend analyses were not performed and CAGR not calculated because of missing data, changes in the type
of data or change in data process. Luxembourg changed data process in 2020, which could impact comparability with previous
years.
For details, please refer to the Methods chapter.
16SURVEILLANCE REPORT Antimicrobial consumption in the EU/EEA – AER 2020
Change in the consumption of antibacterials for systemic
use (ATC group J01) between 2019 and 2020
Between 2109 and 2020, an overall decrease was observed in the EU/EEA population-weighted mean total (community
and hospital sectors combined) consumption of antibacterials for systemic use (ATC J01), from 19.9 DDD per 1 000
inhabitants per day in 2019 to 16.4 DDD per 1 000 inhabitants per day in 2020. This represented a 17.6% decrease.
In the community, the EU/EEA population-weighted mean declined from 18.3 DDD per 1 000 inhabitants per day to
15.0 DDD per 1 000 inhabitants per day in 2020, representing a 18.3% decrease. Between 2019 and 2020 decreases
were noted for all groups, with the largest decreases (measured as DDD per 1 000 inhabitants per day) observed for
penicillins (ATC group J01C), followed by other beta-lactam antibacterials (ATC group J01D) (Tables D1-D7).
In the hospital sector, the EU/EEA population-weighted mean declined from 1.64 DDD per 1 000 inhabitants per
day in 2019 to 1.57 DDD per 1 000 inhabitants per day in 2020, representing a 4.5% decrease. Between 2019 and
2020, at group level decreases were observed for the hospital sector consumption of penicillins (ATC group J01C),
other beta-lactam antibacterials (ATC group J01D) and quinolones (ATC group J01M), with the largest decrease
being for penicillins. However, increases were observed for hospital sector consumption of tetracyclines (ATC group
J01A), sulfonamides, trimethoprim (ATC group J01E), and macrolides, lincosamides and streptogramins (ATC group
J01F), with the largest increase for macrolides, lincosamides and streptogramins.
At national level, a majority of the countries reported a substantial decrease for both the community and the
hospital sector between 2019 and 2020. However, the decreases were generally larger in the community than in
the hospital sector. Seven countries (Estonia, Greece, Hungary, Italy, Latvia, Malta, Portugal) reported a decrease
in the community alongside an increase in the hospital sector. Only one country (Bulgaria) reported an increase in
both the community and the hospital sector (Figure 5).
Figure 5. Difference (%) in national consumption of antibacterials for systemic use (ATC group J01)
between 2019 and 2020, hospital sector versus community sector, EU/EEA
AT: Austria; BE: Belgium; BG: Bulgaria; DK: Denmark; EE: Estonia; EL: Greece, ES: Spain; FI: Finland; FR: France; HR: Croatia; HU:
Hungary; IE: Ireland; IT: Italy; LT: Lithuania; LU: Luxembourg; LV: Latvia; MT: Malta, NL; Netherlands; NO; Norway; PL; Poland; PT:
Portugal; RO: Romania; SE; Sweden; SK: Slovakia; SI: Slovenia.
Cyprus and Czechia did not report data separately for community and the hospital sector. Germany and Iceland did not report data for the
hospital sector. These countries are therefore not presented on the graph. Finland: hospital sector data include consumption in remote
primary healthcare centres and nursing homes.
17Antimicrobial consumption in the EU/EEA – AER 2020 SURVEILLANCE REPORT Consumption of antibacterials from other ATC groups (A07A, P01A, J04A) In 2020, hospital consumption of oral vancomycin (ATC A07AA09) and fidaxomicin (ATC A07AA12), reported by 23 countries, was below 0.01 DDD per 1 000 inhabitants per day in all of them. Oral and rectal metronidazole (ATC P01AB01) consumption in the hospital sector was reported by 23 countries, and ranged from below 0.01 DDD per 1 000 inhabitants per day to 0.04 DDD per 1 000 inhabitants per day. Consumption of oral vancomycin (A07AA09) and fidaxomicin (ATC A07AA12), and oral and rectal metronidazole (P01AB01) is presented in Table D18. Consumption of antimycotics and antifungals for systemic use (ATC groups J02 & D01B) in the community In 2020, 25 countries reported data on consumption of antimycotics and antifungals for systemic use (ATC groups J02 & D01B) in the community. The EU/EEA population-weighted mean consumption was 0.9 DDD per 1 000 inhabitants per day and consumption varied by a factor of 10 (Table D119 and Figure D5). In 2020, terbinafine (D01B02), fluconazole (J02AC01), and itraconazole (J02AC02) comprised between 90% and 100% of the total consumption of antimycotics and antifungals for systemic use in the community among the reporting countries. Consumption of antimycotics and antifungals for systemic use (ATC groups J02 & D01B) in the hospital sector In 2020, 22 countries reported data on consumption of antimycotics and antifungals for systemic use (ATC groups J02 & D01B) in the hospital sector. The EU/EEA population-weighted mean consumption was 0.13 DDD per 1 000 inhabitants per day. Consumption varied from 0.04 to 0.26 DDD per 1 000 inhabitants per day (Table D20, Figure D8). Consumption of antivirals for systemic use (ATC group J05) in both sectors (community and hospital sector combined) In 2020, 28 countries reported data on antivirals for systemic use (ATC group J05). The data were pooled for the two sectors (Table D21). Germany, Iceland, the Netherlands and Spain only reported data for the community. The total EU/EEA population-weighted mean consumption of antivirals for systemic use (ATC group J05) was 2.56 DDD per 1 000 inhabitants per day and did not show any statistically significant trend over the five-year period 2016‒2020 (Table D16). In 2020, consumption of antivirals for systemic use showed a 54-fold difference between countries, from 0.21 DDD per 1 000 inhabitants per day in Croatia to 11.2 in Bulgaria. Statistically significant increasing trends were observed for seven countries (Croatia, Cyprus, France, Hungary, Netherlands, Norway and Spain). Italy showed a significantly decreasing trend during the period 2016−2020. 18
SURVEILLANCE REPORT                                                 Antimicrobial consumption in the EU/EEA – AER 2020

Discussion
For the past two decades, efforts have been made in the EU/EEA to optimise antimicrobial use as a means of
addressing increasing antimicrobial resistance (AMR). AMR is considered one of the biggest threats to public health
in the EU/EEA [12], with high levels of AMR reported for several important bacterial species [13], resulting in an
estimated 33 000 deaths each year attributable to infections with antibiotic-resistant bacteria [14].
For more than two decades, ESAC-Net and its predecessor, the ESAC project, have provided AMC reference data
for the EU/EEA, highlighting considerable variability across countries and suggesting opportunities for significant
reductions through antimicrobial stewardship initiatives and other public health investments [3,15]. The
significantly decreasing EU/EEA trend in consumption of antibacterials for systemic use (ATC group J01) related to
total care (community and hospital sector combined) between 2011 and 2020 suggests the positive effect of
coordinated and EU-wide initiatives. However, when assessing the two healthcare sectors separately, only the
trend for the community sector significantly decreased between 2011 and 2020, while no significant trend could be
detected for the hospital sector during the same period. In addition, there was a shift towards higher consumption
of broad-spectrum antimicrobials, with a statistically significant increase in the ECDC/EFSA/EMA secondary
indicators (Tables 4 and 7), for both the community and the hospital sector. This underlines the importance of
intensifying efforts to improve the rational use of antimicrobials and support best practices in the EU/EEA.
The 2020 AMC data presented in this report coincide with the first year of the coronavirus disease (COVID-19)
pandemic, and differ considerably compared to previous years, both in terms of rate by population and pattern of
different antimicrobial classes. From March 2020, all EU/EEA countries were affected by COVID-19, with sustained
transmission of SARS-CoV-2 throughout the rest of the year [16,17]. The subsequent changes in population
behaviour, healthcare system organisation and general communicable disease epidemiology [18,19] therefore
make it challenging to compare AMC data from 2020 with that for previous years.
AMC is an area in which concerns about the negative consequences of the COVID-19 pandemic were raised at an
early stage, and these concerns included fear of increased and inappropriate use of antimicrobials, leading to a
subsequent increase in AMR [20-22]. While there have been indications of potential overuse of antimicrobials in
some settings during the first phase of the pandemic [23-24], the AMC situation in the EU/EEA seems to be more
favourable than expected, with large reductions in antibacterials consumed for systemic use between 2019 and
2020, especially in the community sector. While decreases were noted for all groups of antibiotics in the
community between 2019 and 2020, there were both increases and decreases in the hospital sector, depending on
the group of antibiotics.
As patient- and prescriber-level data are not available to ESAC-Net, it is not possible to determine the direct causes
behind the observed changes, but these are probably multifactorial and to a large degree associated with the
ongoing COVID-19 pandemic. More detailed information available on the national or regional levels suggests that
the reductions observed could be attributed to changes in communicable disease epidemiology, with particularly
prominent decreases in groups of antibiotics prescribed for respiratory infections and to the youngest age groups
[25-27]. This theory is also supported by the large decreases in respiratory and gastro-intestinal infections reported
in the EU/EEA in 2020 [18,28], presumably due to the non-pharmaceutical interventions (NPIs) introduced to
reduce SARS-CoV-2 transmission [29-30]. NPIs, including the promotion of hand hygiene, respiratory etiquette,
physical distancing and travel restrictions, probably had an effect on transmission and prevalence for a larger set of
communicable diseases. In addition, reduced use of and difficulties in accessing primary care services, due to lock-
downs and reprioritisation of resources, have been described in EU/EEA countries [18,27], and it has been
suggested that this has led to a decrease in inappropriate prescribing for milder and self-limiting infections [25].
COVID-19 has put extraordinary pressure on the capacity of national hospital systems, with rapidly increasing
demand for intensive care beds [31-33]. In parallel, the number of patients admitted for elective surgery or chronic
diseases was reduced in many hospitals. These changes are not reflected in the indicator ‘DDD per 1 000
inhabitants per day’, and might complicate the comparison of hospital AMC with previous years and between
countries. In theory, if the total number of hospitalised patients decreased substantially in 2020 because of the
pandemic, the apparent decrease in hospital AMC expressed in DDD per 1 000 inhabitants per day could actually
become an increase, if expressed as a number of DDD per 100 bed-days. Thus, changes in hospital AMC between
2019 and 2020 should be interpreted with caution. A uniformly defined denominator, based on bed-days, is
currently not available for ESAC-Net, but has been recommended for measuring hospital AMC [5].
Evidence-based international guidelines discourage the use of antibiotics in patients with mild or moderate COVID-
19 infection without a suspicion of a bacterial co-infection. They also highlight the importance of rational use in
patients with severe disease, bacterial co-infection or secondary infection [34-35]. However, studies (mainly from
non-EU/EEA countries) have reported significantly higher antibiotic prescribing in COVID-19 patients than the
prevalence of bacterial co-infection, suggesting overprescribing in some settings [24]. Increased antibiotic
prescribing in patients requiring ventilator support and other invasive interventions could, in the presence of sub-
optimal infection prevention and control (IPC) practices, also have an impact on the incidence and spread of
healthcare-associated multidrug-resistant bacteria, potentially increasing the need for antibacterial treatment.

                                                                                                                    19
Antimicrobial consumption in the EU/EEA – AER 2020 SURVEILLANCE REPORT During the first months of the pandemic, it was suggested that some antimicrobials had a potential effect against COVID-19 infection, albeit with insufficient evidence. One of these was azithromycin, hypothesised to have a potential efficacy when combined with hydroxychloroquine [24]. While no large changes in the EU/EEA level consumption of macrolides, lincosamides and streptogramins – the group in which azithromycin is included – was noted for the community sector between 2019 and 2020, there was a substantial increase in the consumption of this group in the hospital sector during the same period. The consumption of remdesivir, an antiviral conditionally approved by the EMA for the treatment of COVID-19 in adults with pneumonia who require oxygen, could not be quantified in 2020 as the product does not yet have an ATC code and DDD assigned [4]. Reinforced antimicrobial stewardship activities are an essential part of the COVID-19 pandemic response in order to optimise patient outcomes and reduce the risk of short-term side-effects and long-term consequences, such as increased prevalence of AMR and Clostridioides difficile infections. Key challenges to antimicrobial stewardship related to COVID-19 are the lack of resources resulting from their re-allocation to COVID-19 planning and management; difficulties caused by IPC restrictions and social distancing in delivering ward rounds, performing audits and providing education, and increased use of antimicrobials due to the difficulty in diagnosis of secondary infections, particularly in patients with severe COVID-19 [36]. In order to support and promote stewardship activities during the pandemic, the ESCMID Study Group for Antimicrobial Stewardship (ESGAP) endorsed a set of recommendations on the use of antimicrobials in patients with suspected or confirmed COVID-19 infection [22]. The Dutch Working party on Antibiotic Policy has also provided evidence-based recommendations for empirical antimicrobial treatment of hospitalised adults with respiratory infection and proven COVID-19. However, all such recommendations need to be updated regularly as the available evidence increases [35]. After the COVID-19 pandemic, AMR remains one of the biggest threats to public health, both globally [37] and in the EU/EEA [12,14]. Ensuring prudent antimicrobial use is a fundamental priority for an effective response to the emergence and spread of AMR, calling for concerted efforts at country level and close international cooperation. The importance of AMC surveillance data to guide and evaluate interventions targeting AMR containment is highlighted in the European One Health Action Plan against AMR [12], as well as the World Health Organization (WHO) Global Action Plan on AMR [37] and the WHO European Strategic Action Plan on Antibiotic Resistance [38]. One of the first deliverables of the European One Health Action Plan against AMR was the EU Guidelines on the prudent use of antimicrobials in human health [39]. Many EU/EEA countries have begun work on establishing objectives and targets for prudent use in humans, often in the context of developing a national action plan for AMR [40]. However, in 2017 only a few countries had published targets [41] and those that had identified specific funding sources to implement their national action plans were in a minority [42]. To combat increasing AMR within a ‘One-Health’ approach, EU/EEA countries agreed to develop their own national action plans, including antimicrobial stewardship strategies based on national surveillance of AMC and AMR [43]. A tripartite collaboration was organised between WHO, the Food and Agriculture Organization of the United Nations (FAO) and the World Organisation for Animal Health (OIE) in the form of a country self-assessment survey (TrACSS) for 2019−2020. According to the survey results, a majority of EU/EEA countries had a national monitoring system for AMC in human health, but the extent to which AMC and AMR data were used to amend national strategy and/or inform decision-making varied [44].The ECDC/EMA/EFSA harmonised outcome indicators used in this report are also adopted in the joint inter-agency report on integrated analysis of antimicrobial agent consumption and occurrence of antimicrobial resistance in bacteria from humans and food-producing animals in the EU/EEA (JIACRA) [45]. In this report, which represents a collaboration between ECDC, EFSA and EMA, AMC and AMR data from both the human and food-producing animal sector are jointly presented using a 'one health’ approach. The findings demonstrate links between the occurrence of AMR in bacteria from humans, AMR in bacteria from food-producing animals and AMC in both food-producing animals and humans. This suggests that further interventions to reduce AMC will have a beneficial impact on the occurrence of AMR, underlining the need to promote prudent use of antimicrobial agents and infection control and prevention in both humans and food- producing animals. Public health conclusions Antimicrobial stewardship measures are essential to prevent and control AMR. While the overall reductions in AMC observed in the EU/EEA between 2011 and 2020 suggest the positive effect of coordinated and EU-wide initiatives towards prudent use of antimicrobials, the increase in consumption of broad-spectrum antimicrobials and the remaining variability in AMC rates across EU/EEA countries highlights opportunities to further improve current practices. Data for 2020 suggest that the ongoing COVID-19 pandemic has had a considerable impact on AMC in the EU/EEA. The consequences on AMR are yet to be evaluated, but current data underline the importance of continuous surveillance of both AMC and AMR, to carefully monitor the situation in order to assess the more long-term consequences and inform public health decisions. 20
SURVEILLANCE REPORT                                                    Antimicrobial consumption in the EU/EEA – AER 2020

References
1.    European Centre for Disease Prevention and Control. Introduction to the Annual Epidemiological Report.
      Stockholm: ECDC; 2021. Available from: https://www.ecdc.europa.eu/en/all-topics-z/surveillance-and-
      disease-data/annual-epidemiological-reports/introduction-annual
2.    European Centre for Disease Prevention and Control. TESSy, The European Surveillance System –
      Antimicrobial consumption (AMC) reporting protocol 2021 – European Surveillance of Antimicrobial
      Consumption Network (ESAC-Net) surveillance data for 2020. Stockholm: ECDC; 2021
3.    European Centre for Disease Prevention and Control. Antimicrobial consumption database (ESAC-Net).
      Stockholm: ECDC; 2021. Available from: https://ecdc.europa.eu/en/antimicrobialconsumption/surveillance-
      and-disease-data/database
4.    World Health Organization (WHO) Collaborating Centre for Drug Statistics Methodology. ATC Index with
      DDDs. Oslo, WHO; 2021 Available from: https://www.whocc.no/atc_ddd_index/
5.    Stanic Benic M, Milanic R, Monnier AA, Gyssens IC, Adriaenssens N, Versporten A, et al. Metrics for
      quantifying antibiotic use in the hospital setting: results from a systematic review and international
      multidisciplinary consensus procedure. J Antimicrob Chemother. 2018;73(suppl_6):vi50-vi8.
6.    Versporten A, Gyssens IC, Pulcini C, Monnier AA, Schouten J, Milanič R, et al. Metrics to assess the quantity of
      antibiotic use in the outpatient setting: a systematic review followed by an international multidisciplinary
      consensus procedure. Journal of Antimicrobial Chemotherapy. 2018 Jun 1;73(suppl_6):vi59-66
7.    European Centre for Disease Prevention and Control (ECDC), EFSA BIOHAZ Panel (European Food Safety Authority
      Panel on Biological Hazards) and CVMP (EMA Committee for Medicinal Products for Veterinary Use), 2018. ECDC,
      EFSA and EMA Joint Scientific Opinion on a list of outcome indicators as regards surveillance of antimicrobial
      resistance and antimicrobial consumption in humans and food-producing animals. EFSA Journal 2018;15(10):5017.
      Available from: www.ecdc.europa.eu/sites/default/files/documents/AMR-indicators-joint-report-Oct-2017.pdf
8.    Coenen S, Ferech M, Haaijer-Ruskamp FM, Butler CC, Vander Stichele RH, Verheij TJ, et al. European
      Surveillance of Antimicrobial Consumption (ESAC): quality indicators for outpatient antibiotic use in Europe.
      Qual Saf Health Care. 2007 Dec;16(6):440-5
9.    Eurostat. Brussels: Eurostat; 2021. Accessed 10 September 2021. Available from: http://ec.europa.eu/eurostat
10.   Van Boeckel TP, Gandra S, Ashok A, Caudron Q, Grenfell BT, Levin SA, et al. Global antibiotic consumption 2000 to
      2010: an analysis of national pharmaceutical sales data. The Lancet Infectious Diseases. 2014 Aug 1;14(8):742-50.
11.   European Centre for Disease Prevention and Control (ECDC). Antimicrobial consumption surveillance in
      Europe 2013- 2014. Annual report of the European Antimicrobial Consumption Surveillance Network (ESAC-
      Net). Stockholm: ECDC; 2014. Available from: www.ecdc.europa.eu/en/publications-data/surveillance-
      antimicrobialconsumption-europe-2013-2014
12.   European Commission. A European One Health Action Plan against Antimicrobial Resistance (AMR),
      COM/2017/339. Communication from the European Commission to the Council and the European Parliament.
      Brussels: European Commission; 2017.
13.   European Centre for Disease Prevention and Control/WHO Regional Office for Europe. Surveillance of antimicrobial
      resistance in Europe, 2020 data: Executive summary. Copenhagen: WHO Regional Office for Europe; 2021.
14.   Cassini A, Högberg LD, Plachouras D, Quattrocchi A, Hoxha A, Simonsen GS et al. Attributable deaths and disability-
      adjusted life-years caused by infections with antibiotic-resistant bacteria in the EU and the European Economic Area
      in 2015: a population-level modelling analysis. The Lancet Infectious Diseases, 2019, 19.1: 56-66.
15.   Bruyndonckx R, Adriaenssens N, Versporten A, Hens N, Monnet DL, Molenberghs G, et al. Consumption of
      antibiotics in the community, European Union/European Economic Area, 1997-2017. J Antimicrob Chemother.
      2021 Jul 26;76(12 Suppl 2):ii7-ii13. doi: 10.1093/jac/dkab172.
16.   European Centre for Disease Prevention and Control (ECDC). Rapid risk assessment. Coronavirus disease 2019
      (COVID-19) pandemic: increased transmission in the EU/EEA and the UK – seventh update, 25 March 2020.
      Stockholm: ECDC; 2020. Available from: https://www.ecdc.europa.eu/sites/default/files/documents/RRA-seventh-
      update-Outbreak-of-coronavirus-disease-COVID-19.pdf
17.   European Centre for Disease Prevention and Control (ECDC). COVID-19 situation dashboard. Available from
      https://qap.ecdc.europa.eu/public/extensions/COVID-19/COVID-19.html#global-overview-tab
18.   Ullrich A, Schranz M, Rexroth U, Hamouda O, Schaade L, Diercke M, et al. Impact of the COVID-19 pandemic
      and associated non-pharmaceutical interventions on other notifiable infectious diseases in Germany: An
      analysis of national surveillance data during week 1–2016–week 32–2020. The Lancet Regional Health-
      Europe. 2021 Jun 19:100103. Available from: https://www.thelancet.com/journals/lanepe/article/PIIS2666-
      7762(21)00080-6/fulltext
19.   Oliver N, Barber X, Roomp K, Roomp K. Assessing the Impact of the COVID-19 Pandemic in Spain: Large-
      Scale, Online, Self-Reported Population Survey. J Med Internet Res. 2020 Sep 10;22(9):e21319. Available
      from: www.jmir.org/2020/9/e21319/
20.   Monnet DL, Harbarth S. Will coronavirus disease (COVID-19) have an impact on antimicrobial resistance?.
      Eurosurveillance. 2020 Nov 12;25(45):2001886. Available from:
      https://www.eurosurveillance.org/content/10.2807/1560-7917.ES.2020.25.45.2001886

                                                                                                                       21
You can also read