Assessment of Diffusion Tensor Imaging Parameters of Hepatic Parenchyma for Differentiation of Biliary Atresia from Alagille Syndrome
←
→
Page content transcription
If your browser does not render page correctly, please read the page content below
Original Article | Pediatric Imaging
eISSN 2005-8330
https://doi.org/10.3348/kjr.2019.0824
Korean J Radiol 2020

Assessment of Diffusion Tensor Imaging Parameters of
Hepatic Parenchyma for Differentiation of Biliary Atresia
from Alagille Syndrome
Ahmed Abdel Khalek Abdel Razek, MD1, Ahmed Abdalla, MD2, Reda Elfar, MD2,
Germeen Albair Ashmalla, MD1, Khadiga Ali, MD3, Tarik Barakat, MD2
1
Departments of Diagnostic Radiology and 3Pathology, Mansoura Faculty of Medicine, Mansoura, Egypt; 2Gastroenterology and Hepatology Unit,
Mansoura Children Hospital, Mansoura Faculty of Medicine, Mansoura, Egypt

Objective: To assess diffusion tensor imaging (DTI) parameters of the hepatic parenchyma for the differentiation of biliary
atresia (BA) from Alagille syndrome (ALGS).
Materials and Methods: This study included 32 infants with BA and 12 infants with ALGS groups who had undergone DTI.
Fractional anisotropy (FA) and mean diffusivity (MD) of the liver were calculated twice by two separate readers and hepatic
tissue was biopsied. Statistical analyses were performed to determine the mean values of the two groups. The optimum cut-off
values for DTI differentiation of BA and ALGS were calculated by receiver operating characteristic (ROC) analysis.
Results: The mean hepatic MD of BA (1.56 ± 0.20 and 1.63 ± 0.2 x 10⁻³ mm2/s) was significantly lower than that of ALGS
(1.84 ± 0.04 and 1.79 ± 0.03 x 10⁻³ mm2/s) for both readers (r = 0.8, p = 0.001). Hepatic MD values of 1.77 and 1.79 x 10⁻³ mm2/s
as a threshold for differentiating BA from ALGS showed accuracies of 82 and 79% and area under the curves (AUCs) of 0.90
and 0.91 for both readers, respectively. The mean hepatic FA of BA (0.34 ± 0.04 and 0.36 ± 0.04) was significantly higher
(p = 0.01, 0.02) than that of ALGS (0.30 ± 0.06 and 0.31 ± 0.05) for both readers (r = 0.80, p = 0.001). FA values of 0.30 and
0.28 as a threshold for differentiating BA from ALGS showed accuracies of 75% and 82% and AUCs of 0.69 and 0.68 for both
readers, respectively.
Conclusion: Hepatic DTI parameters are promising quantitative imaging parameters for the detection of hepatic parenchymal
changes in BA and ALGS and may be an additional noninvasive imaging tool for the differentiation of BA from ALGS.
Keywords: Diffusion tensor imaging; Biliary atresia; Jaundice; Infant

INTRODUCTION                                                            years of age. Alagille syndrome (ALGS) is a genetic disease
                                                                        involving multiple organs with varying degrees of severity.
  Biliary atresia (BA) is characterized by the luminal                  The primary pathology of liver involvement is a paucity of
obstruction of the extrahepatic bile duct by a fibrous ductal           intralobular bile ducts with subsequent chronic, progressive
remnant, which represents the obliterated ductal remnant                cholestasis (1-3). The most prevalent early clinical
in the porta hepatis at surgery. If infants with BA are left            presentation of infants with ALGS is neonatal cholestatic
untreated, progressive liver cirrhosis leads to death by 2              jaundice. Differentiation between BA and AGS is difficult
                                                                        because of significant clinical, laboratory, radiological, and
Received: July 5, 2019 Revised: March 22, 2020
Accepted: April 18, 2020                                                histopathological overlap leading to misdiagnosis. However,
Corresponding author: Ahmed Abdel Khalek Abdel Razek, MD,               prompt discrimination of ALGS from BA is important as
Department of Diagnostic Radiology, Mansoura Faculty of Medicine,       Kasai portoenterostomy is unlikely to be of value when the
Elgomheryia street, Mansoura 3512, Egypt.
• E-mail: arazek@mans.edu.eg
                                                                        surgery is performed on infants older than 3 months of age
This is an Open Access article distributed under the terms of           with BA. Furthermore, Kasai portoenterostomy does not
the Creative Commons Attribution Non-Commercial License                 benefit infants with ALGS and may actually worsen their
(https://creativecommons.org/licenses/by-nc/4.0) which permits
                                                                        outcomes (3-5). Abnormal gallbladder shape, triangular
unrestricted non-commercial use, distribution, and reproduction in
any medium, provided the original work is properly cited.               cord sign, and hepatic artery enlargement are the main

Copyright © 2020 The Korean Society of Radiology                                                                                            1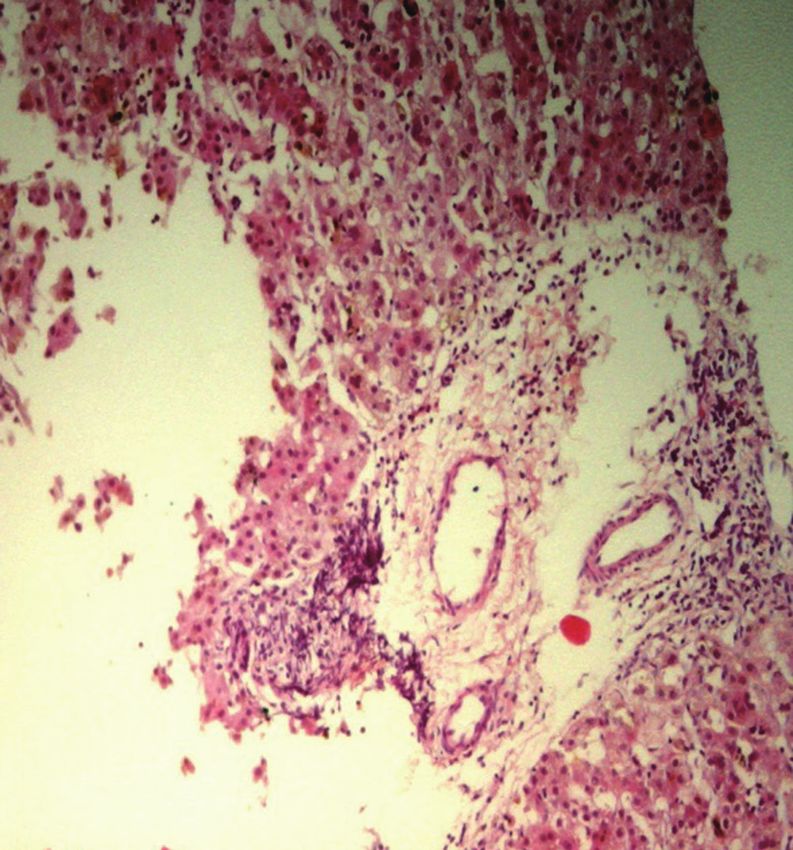
Razek et al.

ultrasound discriminators of BA; however, the results            MATERIAL AND METHODS
are overlapping (6, 7). The assessment of extra-hepatic
bile ducts can be done by magnetic resonance (MR) or             Patients
intraoperative cholangiopancreatography (8, 9). Few studies        This prospective study was approved by the Institutional
have discussed the role of ultrasound in the differentiation     Review Board (MS/16.12.29) and informed consent was
of BA from ALGS because both present early with neonatal         obtained from the parents of the infants. This included
cholestasis (10, 11).                                            infants with cholestatic jaundice who were referred to the
   Diffusion-weighted imaging (DWI) exploits the                 radiology department between March 2013 and November
translational Brownian motion of water protons by                2018. The inclusion criteria were infants with cholestatic
applying pairs of opposing magnetic field gradients.             jaundice and unconjugated hyperbilirubinemia. The
DWI has been used for the characterization of pediatric          exclusion criteria were infants older than 3 months of age,
tumors, grading of hepatic fibrosis in infants and adults        unbiopsied cases, technically limited DTI examination of
(12-16), and assessment of hepatic fibrosis in BA (14).          the liver, and diagnosis other than BA and ALGS. Technically
Diffusion tensor imaging (DTI) is a recently introduced MR       limited DTI was reported in two patients due to infant
technique to assess tissue structure that provides insight       motion artifacts during the MR examination. The final study
into the micro-movements of water molecules and can              group included 44 infants (30 girls, 14 boys, aged 24–90
be used to characterize different tissue compartments            days) with pathologically proven BA (n = 32) and ALGS
at the cellular level with different matrices. DTI utilizes      (n = 12). Biochemical liver function tests were evaluated,
additional gradients in various dimensions and has potential     including total and direct bilirubin and gamma-glutamyl
advantages for the estimation of fibrosis because different      transferase (γGT) levels.
diffusion directions are calculated (17, 18). The parameters
commonly used in DTI are fractional anisotropy (FA) and          MR Imaging
mean diffusivity (MD). The MD estimates the sum of the             All MR images were acquired on a 1.5T superconducting
average diffusion properties of water molecules within each      body scanner (Ingenia, Philips Healthcare) using a
voxel to provide apparent diffusion coefficient (ADC) values     16-element phased-array surface coil (dStream Torso coil,
over three orthogonal planes, assuming isotropy along each       Philips Healthcare) with a posterior body coil embedded
direction of movement. FA captures the directionality of         in the table (dStream Total Spine coil, Philips Healthcare).
diffusion and is considered an index for diffusion asymmetry     The machine was equipped with a self-shielding high-
within a voxel (18, 19). Different organs and tissues have       performance gradient set (30 mTm maximum gradient
different diffusion characteristics; among these, the liver      strength). All patients were fasted for 4–6 hours before
has an anisotropic diffusion pattern due to its randomly         the study. Sedation was achieved using oral chloral hydrate
organized structures, unlike the diffusion patterns of the       (70–80 mg/kg body weight administered 30 minutes
kidney and brain (20). Several studies have verified the         before the MR examination). Conventional MR of the upper
importance of DTI for assessing liver fibrosis using MD and      abdomen was first performed with the following parameters:
FA (21-24) and have discussed the value of DTI in neonatal       routine axial T1-weighted images (repetition time [TR]/
cholestasis using tailored and adapted DTI sequences for the     echo time [TE] = 500/20 ms) and T2-weighted images (TR/
differentiation of pediatric liver diseases (25-27). One study   TE = 6000/80 ms) were obtained. Free-breathing single-
reported that hepatic MD can be used as an adjunct to other      shot echo-planar imaging DTI of the liver using mono-
non-invasive imaging methods in the differential diagnosis       exponential curve fitting of the diffusion module was
of BA and non-BA, in which the MD showed a decreasing            performed using parallel imaging. We used three b-values
trend, whereas the FA showed an increasing trend with            (0, 400, and 800 s/mm2). The diffusion gradients were
increasing fibrotic stage of BA (25). Another study added        applied in six directions (x, y, z, xy, yz, and xz) and the
that DWI can be used for the evaluation of focal and diffuse     following sequence parameters were used: TR/TE = 3596/70
liver diseases in pediatric patients using either mono-          ms, matrix = 64 x 64, interpolated to 256 x 256, six slices
exponential, bi-exponential, or stretched DWI modules (27).      = 7–8 mm, interslice gap = 0.8–2 mm, average number = 1,
In this study, we aimed to assess DTI parameters of hepatic      echo-planar imaging factor = 35, field of view = 22–25 cm,
parenchyma for the differentiation of BA from ALGS.              and total scan duration = 7–8 minutes.

2                                                                           https://doi.org/10.3348/kjr.2019.0824   kjronline.org
Diffusion Tensor Imaging of Biliary Atresia vs. Alagille Syndrome
Image Analysis Pathology
Image analysis was performed by two radiologists expert All infants underwent ultrasound-guided Tru-Cut liver
in hepato-biliary imaging for 25 and 15 years respectively biopsy and the pathological specimens were evaluated by
who were blinded to the clinical presentation and final an expert pediatric pathologist. BA was diagnosed based on
pathological results. The images were transferred to the the presence of bile duct proliferation and bile plugs, while
workstation (extended MR Workspace 2.6.3.5, Philips the diagnosis of hepatic involvement by ALGS was based on
Healthcare). All conventional MR images were first the paucity of intralobular biliary ducts (Fig. 2).
evaluated for the presence of abnormal signal intensity
of the hepatic parenchyma. The images were then loaded Statistical Analysis
to the DTI software workstation (View Forum 7.2.0.1 The statistical analyses were performed using Statistical
exported patient image data, Philips Healthcare). Overall Package for Social Science version 10 (SPSS). The mean and
DTI image quality for parenchyma structure discrimination, standard deviation of the MD and FA values for BA and ALGS
distortion, and motion artifacts was assessed. Co- were calculated. Statistical differences were compared using
registration of the DTI maps to T2-weighted images was either Fisher’s exact test for categorical variables and two-
done for accurate placement of the regions of interest. sample t- or Mann-Whitney tests for continuous variables.
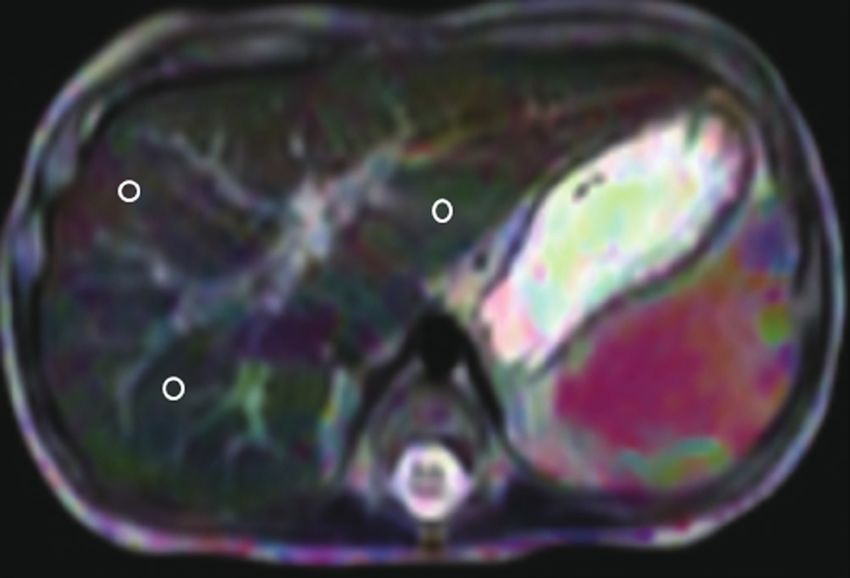
Three round regions of interest, each measuring 20 mm2, Pearson correlations were used to estimate the proportion
were placed using an electronic cursor at both liver lobes of inter-reader agreement for DTI parameters. Receiver
to ensure measurement of the whole hepatic parenchyma. operating characteristic (ROC) curves were generated to
The selected regions of interest (ROIs) were small and determine the cut-off points used to differentiate BA
carefully set in a homogeneous area of hepatic parenchyma from ALGS. The sensitivity, specificity, accuracy, positive
to avoid the vascular and biliary structures and 1 cm from predictive value (PPV), negative predictive value (NPV),
the lateral border of the liver (Fig. 1). Care was taken to and the area under the curve (AUC) were calculated.
place the ROIs of the left liver lobe below the level of the Spearman correlation coefficient (r) was used to estimate
portal vein to avoid motion artifact resulting from cardiac the correlations between DTI parameters and pathological
motion. The ROIs were small owing to the tiny size of the diagnoses. P values ≤ 0.05 were considered significant at a
neonates. The ROIs were placed on three consecutive slices 95% confidence interval.
to automatically calculate the FA and MD values. The final
FA and MD values used for analysis were the mean values RESULTS
of the nine ROIs. The FA values ranged from 0 to 1, were
1 indicated those structures allowing diffusion only along No statistical differences were observed in age and sex
a single direction, whereas structures allowing completely distributions between groups. Similarly, no significant
free or isotropic diffusion should result in an FA of 0. differences in total and direct serum bilirubin and γGT
levels were observed between infants with BA and those
with ALGS (Table 1). No areas of abnormal signal intensity
within the hepatic parenchyma were observed in either
patient group.
Table 2 shows the MD and FA values for BA and ALGS
determined by the two readers. Table 3 shows the results of
the ROC curve analysis to determine the MD and FA cut-off
values for BA and ALGS for the two readers.
The mean hepatic MD in infants with BA was 1.56 ± 0.20
and 1.63 ± 0.2 x 10⁻³ mm2/s and in infants with ALGS was
1.84 ± 0.04 and 1.79 ± 0.03 x 10⁻³ mm2/s for both readers,
respectively, with significantly strong positive interreader
correlation (r = 0.8, p = 0.001). The hepatic MD in infants
Fig. 1. Localization of ROIs. MD map showing localization of three
ROIs within hepatic parenchyma. MD = mean diffusivity, ROIs = regions
with BA differed significantly from that of infants with
of interest ALGS (p = 0.001). MD values of 1.77 and 1.79 x 10⁻³ mm2/s as
kjronline.org https://doi.org/10.3348/kjr.2019.0824 3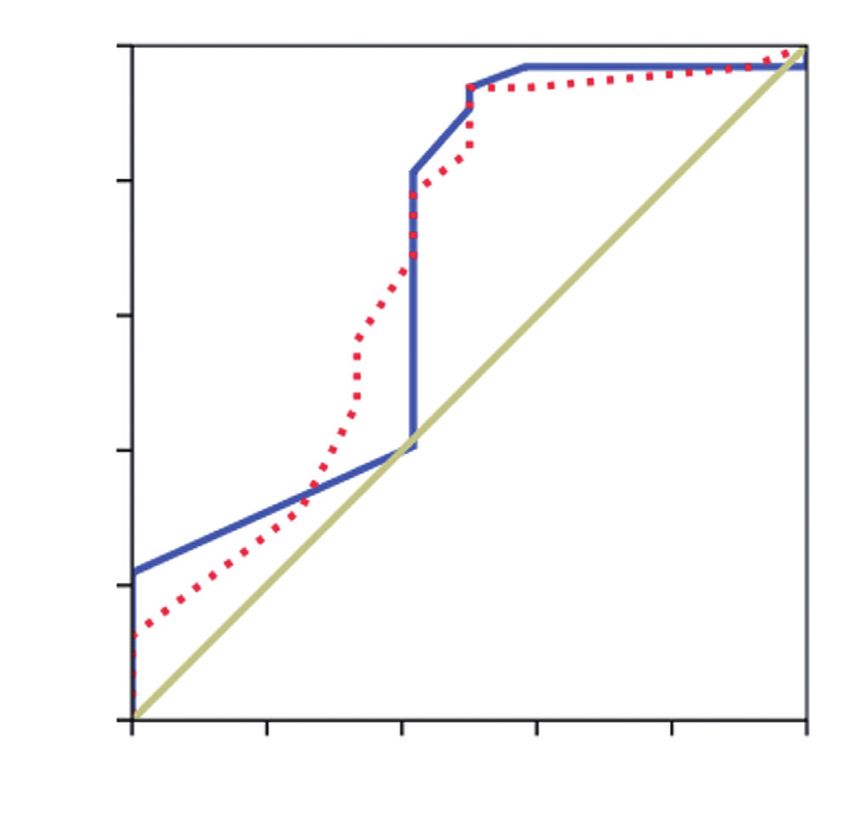
Razek et al.
A B
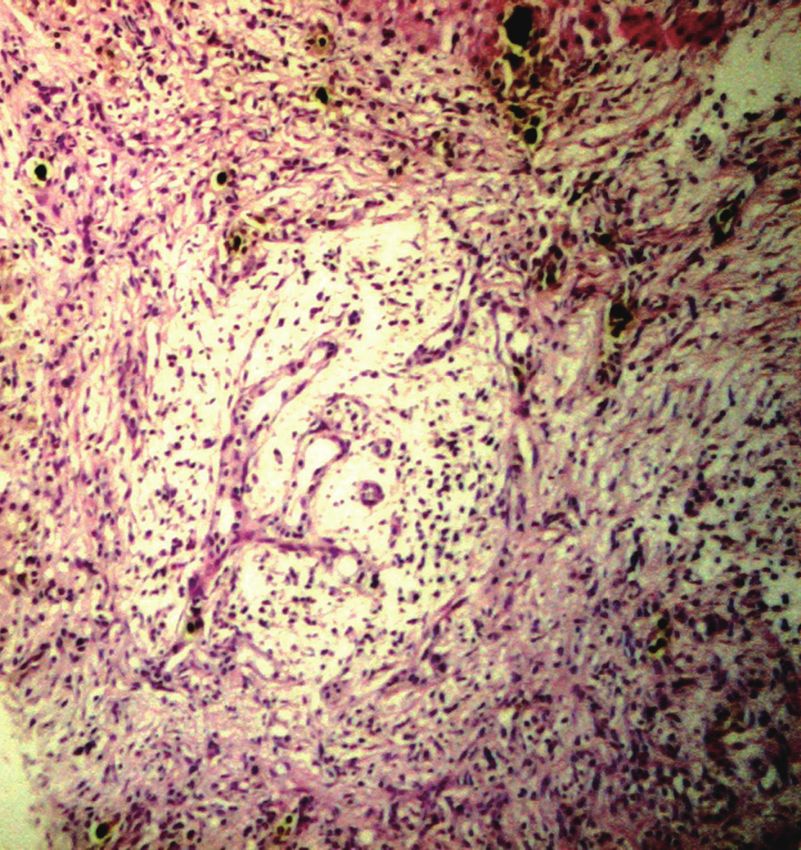
Fig. 2. Liver biopsy of 2 infants with cholestasis.
A. Case of BA showing portal tract expansion by loose fibrous tissue containing irregularly anastomosing bile ductules at the periphery, some
being dilated with inspissated bile in their lumen. B. Case of ALGS with portal area containing vessels but no ducts “unpaired artery” without
cholangiolar proliferation (both are H & E stain, with magnification x 10). ALGS = Alagille syndrome, BA = biliary atresia
Table1. Demographic and Laboratory Results Table 2. MD and FA of Both Readings for BA and ALGS
BA (n = 32) ALGS (n = 12) P DTI BA (n = 32) ALGS (n = 12) P
Age (months) 2.3 (1.0–11.0) 2.5 (1.0–24.0) 0.290 MD (x 10-3 mm2/s)
Total bilirubin (mg/dL) 13.7 ± 1.7 12.9 ± 2.4 0.180 1.56 ± 0.20 1.84 ± 0.04
1st reading 0.001
Direct bilirubin (mg/dL) 7.3 ± 1.09 7.6 ± 1.1 0.420 (1.23–1.95) (1.82–1.97)
γGT (IU/L) 521 ± 82.9 564 ± 88.5 0.140 1.63 ± 0.20 1.79 ± 0.03
2nd reading 0.001
Data are presented as mean (range values) or mean ± SD. ALGS (1.19–1.87) (1.73–1.86)
= Alagille syndrome, BA = biliary atresia, γGT = gamma-glutamyl FA
transferase 0.34 ± 0.04 0.30 ± 0.06
1st reading 0.001
(0.22–0.40) (0.24–0.37)
thresholds to differentiate BA from ALGS showed the best
0.36 ± 0.04 0.31 ± 0.05
results, with accuracies of 82% and 79%, sensitivities of 2nd reading 0.002
(0.24–0.40) (0.24–0.38)
91% and 83%, specificities of 80% and 78%, PPVs of 61% Data are presented as mean ± SD (minimum–maximum values).
and 56%, NPVs of 96% and 93%, and AUCs of 0.90 and 0.91 DTI = diffusion tensor imaging, FA = fractional anisotropy, MD =
for both readers, respectively (Fig. 3). mean diffusivity
The mean hepatic FA in infants with BA was 0.34 ± 0.04
and 0.36 ± 0.04 and in infants with ALGS was 0.30 ± 0.06 A significant moderate positive correlation was observed
and 0.31 ± 0.05 for both readers, respectively, showing between hepatic DTI parameters for both readers and
a very strong positive correlation (r = 0.8, p = 0.001). pathological diagnosis (r = 0.376, p = 0.002 for the first
The hepatic FA in infants with BA differed significantly reader and r = 0.357, p = 0.003 for the second reader).
from that of infants with ALGS (p = 0.001, 0.002 for both
readers, respectively). An FA of 0.30 and 0.28 as a threshold DISCUSSION
value for differentiating BA from ALGS showed the best
results, with accuracies of 75% and 82%, sensitivities of The main finding in this study was that DTI parameters
81% and 93%, specificities of 58% and 50%, PPVs of 84% could quantitate early microstructural changes in the
and 83%, NPVs of 54% and 75%, and AUCs of 0.69 and 0.68 hepatic parenchyma of infants with BA and ALGS. The
for both readers, respectively (Fig. 4). DTI parameters showed significantly lower hepatic MD
4 https://doi.org/10.3348/kjr.2019.0824 kjronline.org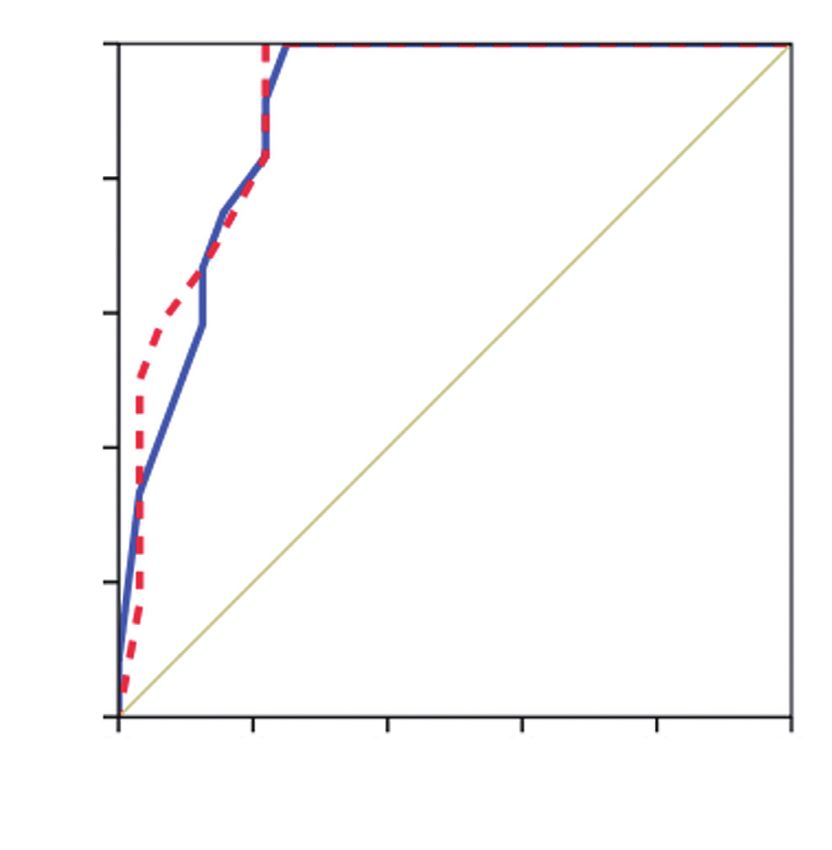
Diffusion Tensor Imaging of Biliary Atresia vs. Alagille Syndrome

Table 3. ROC Curve Results of MD and FA of Both Readings for Differentiating BA and ALGS
                                 AUC          Cut-Off Point            Sensitivity (%)                  Specificity (%)         PPV (%)      NPV (%)              Accuracy (%)
MD (x 10-3 mm2/s)
  1st reading                    0.90              1.77                      91                                 80                61             96                       82
  2nd reading                    0.91              1.79                      83                                 78                56             93                       79
FA
  1st reading                    0.69              0.30                      81                                 58                84             54                       75
  2nd reading                    0.68              0.28                      93                                 50                83             75                       82
AUC = area under the curve, NPV = negative predictive value, PPV = positive predictive value, ROC = receiver operating characteristic

               1.0                                                                                       1.0

               0.8                                                                                       0.8

               0.6                                                                                       0.6
 Sensitivity

                                                                                          Sensitivity
               0.4                                                                                       0.4

                                                         Source of curve                                                                                    Source of curve
               0.2                                       MD (1st observer)                               0.2                                                FA (1st observer)
                                                         MD (2nd observer)                                                                                  FA (2nd observer)
                                                         Reference line                                                                                     Reference line
               0.0                                                                                       0.0
                     0.0   0.2          0.4        0.6           0.8          1.0                              0.0        0.2          0.4            0.6           0.8         1.0
                                         1-specificity                                                                                    1-specificity

Fig. 3. ROC of MD used to differentiate BA from ALGS. MD of 1.77                         Fig. 4. ROC of FA used to differentiate BA from ALGS. FA
and 1.79 x 10⁻³ mm2/s as threshold value for differentiating BA from                     of 0.30, 0.28 as threshold value for differentiating BA from ALGS
ALGS shows accuracies of 82% and 79%, sensitivities of 91% and 83%,                      shows accuracies of 79% and 82%, sensitivities of 81% and 93%,
specificities of 80% and 83%, and AUCs of 0.90 and 0.91 for both                         specificities of 58% and 50%, and AUCs of 0.69 and 0.68 for both
reviewers, respectively. AUC = area under the curve, ROC = receiver                      readers, respectively. FA = fractional anisotropy
operating characteristic
                                                                                           In this study, the hepatic MD of infants with BA was
and significantly higher FA in infants with BA than those                                lower than that in those with ALGS while the hepatic FA in
in patients with ALGS. A significant strong positive                                     infants with BA was significantly higher than that in infants
correlation was observed between the FA and MD for                                       with ALGS. These findings can be explained in view of the
both readers. The DTI parameters of hepatic parenchymal                                  underlying pathological process in these disease entities.
show a significant moderate correlation with pathological                                Infants with BA showed destructive interlobular ducts,
diagnosis of BA and ALGS.                                                                ductular proliferation, cellular biliary stasis, bile plugs,
   The clinical relevance of adding DTI to the workup of                                 ductal plate malformation, inflammatory cell infiltration
infants with neonatal cholestasis is the considerable overlap                            surrounding the proliferated bile ducts, porto-portal
in clinical, laboratory, imaging, and pathological findings                              bridging hepatic fibrosis, and increased collagen production
between infants with BA and those with ALGS. Ultrasound                                  (1, 2), which are associated with restricted diffusion and
findings cannot differentiate between entities as these                                  subsequent reduction in MD (24-26) and disturbance of
conditions may overlap in their pathological features                                    the normal isotropic diffusion within the liver parenchyma
including the paucity of interlobular bile ducts. This paucity                           as well as increased anisotropy. ALGS is characterized by a
is not always present in liver biopsy and the typical clinical                           non-destructive paucity or even absence of intralobular bile
features are not obviously present in all patients.                                      ducts (3, 4) due to a developmental defect in the ductal

kjronline.org              https://doi.org/10.3348/kjr.2019.0824                                                                                                                      5
Razek et al.
plate and absence of the inflammatory response, which are of infants limited statistical analysis. Multicenter studies
associated with unrestricted diffusion and higher MD with including a large number of patients are required. Second,
more isotropic diffusion of the water molecules. there was a bias from the selection of ROI, texture analysis,
A previous study reported restricted diffusion in BA with and machine learning of DTI parameters, which may have
lower hepatic MD compared to those in controls and that affected the results. Third, this study used DTI on 1.5T
the diffusion change of the liver parenchyma in biliary scanners; further multiparametric study using DTI on higher-
cirrhosis was similar to those related to cirrhosis in chronic powered scanners combined with contrast, MR imaging,
hepatitis (14). Another study evaluated the diagnostic and proton MR spectroscopy will improve the results (28).
performance of bi-exponential and stretched exponential Fourth, we did not include neonatal hepatitis, although it
modules with ten b values in infants with neonatal is one of the two most common causes of neonatal jaundice
cholestasis, reported lower ADC 10, ADC 2, fast diffusion, because they may be suspected clinically, Additional
perfusion fraction, and distribution diffusion coefficient and multicenter studies including all groups of infants with
higher γGT and diffusion heterogeneity index in infants with neonatal cholestasis are needed to evaluate role of DTI in
BA compared to those without BA, with the best results the management of these patients.
obtained from ADC 2 using two b values (25). Another study In conclusion, hepatic DTI parameters are promising
observed higher diagnostic performance for the stretched quantitative imaging parameters for the detection of
exponential model for determining significant hepatic hepatic parenchymal changes in BA and ALGS and may be an
fibrosis compared to for the mono-exponential model (26). additional noninvasive imaging tool for the differentiation
The current study observed a significant difference in of BA from ALGS.
FA, which could be explained by the early investigation
of the liver in BA before the development of fibrosis, in Conflicts of Interest
which collagen is deposited within the liver parenchyma, The authors have no potential conflicts of interest to
helping in the return of isotropic diffusion in the water disclose.
molecules. The FA predominantly represents the degree of
the directionality of water diffusion in the microstructure of ORCID iDs
the tissue, which is related to the orientation of different Ahmed Abdel Khalek Abdel Razek
tissues (20-23). However, a previous study on neonatal https://orcid.org/0000-0002-9613-5932
cholestasis did not observe a difference in hepatic FA Ahmed Abdalla
between BA and non-BA (24). This difference in findings https://orcid.org/0000-0002-5829-123X
may be attributed to differences in patient ages, protocols, Reda Elfar
and machines and parameters. https://orcid.org/0000-0002-1416-2161
This technique is clinically reliable and robust, as we Germeen Albair Ashmalla
adopted the sequence for infants by using free-breathing https://orcid.org/0000-0002-1085-7126
with a low acquisition matrix and parallel imaging to Khadiga Ali
eliminate repository motion effects. Moreover, we used https://orcid.org/0000-0001-7556-7173
localization based on nine ROIs to obtain diffusion data Tarik Barakat
from both liver lobes. Previous studies reported that https://orcid.org/0000-0002-9423-4128
the breath-hold technique was not possible in neonates
and that the respiratory triggering technique was less REFERENCES
reproducible than free breathing with lengthy scan time
(24). Previous studies used ROIs on DTI that were generally 1. Bezerra JA, Wells RG, Mack CL, Karpen SJ, Hoofnagle JH, Doo E,
placed on the right hepatic lobe, with an effort to avoid et al. Biliary atresia: clinical and research challenges for the
interference from the surrounding abdominal wall, vascular twenty-first century. Hepatology 2018;68:1163-1173
2. Neto B, Borges-Dias M, Trindade E, Estevão-Costa J, Campos
and biliary structures, and cardiac cycle (25, 26). Additional
JM. Biliary atresia-clinical series. GE Port J Gastroenterol
studies are needed to compare DTI parameters obtained 2018;25:68-73
from both liver lobes and the right lobe only. 3. Mitchell E, Gilbert M, Loomes KM. Alagille syndrome. Clin Liver
This study has several limitations. First, the small number Dis 2018;22:625-641
6 https://doi.org/10.3348/kjr.2019.0824 kjronline.orgDiffusion Tensor Imaging of Biliary Atresia vs. Alagille Syndrome
4. Kamath BM, Baker A, Houwen R, Todorova L, Kerkar N. 17. Razek AAKA, Al-Adlany MAAA, Alhadidy AM, Atwa MA, Abdou
Systematic review: the epidemiology, natural history, and NEA. Diffusion tensor imaging of the renal cortex in diabetic
burden of Alagille syndrome. J Pediatr Gastroenterol Nutr patients: correlation with urinary and serum biomarkers.
2018;67:148-156 Abdom Radiol (NY) 2017;42:1493-1500
5. Emerick KM, Rand EB, Goldmuntz E, Krantz ID, Spinner NB, 18. Abdel Razek AAK. Routine and advanced diffusion imaging
Piccoli DA. Features of Alagille syndrome in 92 patients: modules of the salivary glands. Neuroimaging Clin N Am
frequency and relation to prognosis. Hepatology 1999;29:822- 2018;28:245-254
829 19. El-Serougy L, Abdel Razek AA, Ezzat A, Eldawoody H, El-
6. Lee SM, Cheon JE, Choi YH, Kim WS, Cho HH, Kim IO, et Morsy A. Assessment of diffusion tensor imaging metrics in
al. Ultrasonographic diagnosis of biliary atresia based on a differentiating low-grade from high-grade gliomas. Neuroradiol
decision-making tree model. Korean J Radiol 2015;16:1364- J 2016;29:400-407
1372 20. Taouli B, Vilgrain V, Dumont E, Daire JL, Fan B, Menu Y.
7. Hwang SM, Jeon TY, Yoo SY, Choe YH, Lee SK, Kim JH. Early Evaluation of liver diffusion isotropy and characterization
US findings of biliary atresia in infants younger than 30 days. of focal hepatic lesions with two single-shot echo-planar
Eur Radiol 2018;28:1771-1777 MR imaging sequences: prospective study in 66 patients.
8. Lin DC, Wu KY, Sun FJ, Huang CC, Wu TH, Shih SL, et al. A Radiology 2003;226:71-78
quantitative image analysis using MRI for diagnosis of biliary 21. Cheung JS, Fan SJ, Gao DS, Chow AM, Man K, Wu EX. Diffusion
atresia. Clin Imaging 2019;53:186-190 tensor imaging of liver fibrosis in an experimental model. J
9. Kim YH, Kim MJ, Shin HJ, Yoon H, Han SJ, Koh H, et al. MRI- Magn Reson Imaging 2010;32:1141-1148
based decision tree model for diagnosis of biliary atresia. Eur 22. Tosun M, Inan N, Sarisoy HT, Akansel G, Gumustas S, Gürbüz
Radiol 2018;28:3422-3431 Y, et al. Diagnostic performance of conventional diffusion
10. Han S, Jeon TY, Hwang SM, Yoo SY, Choe YH, Lee SK, weighted imaging and diffusion tensor imaging for the liver
et al. Imaging findings of Alagille syndrome in young fibrosis and inflammation. Eur J Radiol 2013;82:203-207
infants: differentiation from biliary atresia. Br J Radiol 23. Taouli B, Chouli M, Martin AJ, Qayyum A, Coakley FV, Vilgrain
2017;90:20170406 V. Chronic hepatitis: role of diffusion-weighted imaging and
11. Cho HH, Kim WS, Choi YH, Cheon JE, Lee SM, Kim IO, et al. diffusion tensor imaging for the diagnosis of liver fibrosis and
Ultrasonography evaluation of infants with Alagille syndrome: inflammation. J Magn Reson Imaging 2008;28:89-95
in comparison with biliary atresia and neonatal hepatitis. Eur 24. Kwee TC, Takahara T, Koh DM, Nievelstein RA, Luijten PR.
J Radiol 2016;85:1045-1052 Comparison and reproducibility of ADC measurements
12. Razek AAKA, Abdalla A, Barakat T, El-Taher H, Ali K. in breathhold, respiratory triggered, and free-breathing
Assessment of the liver and spleen in children with Gaucher diffusion-weighted MR imaging of the liver. J Magn Reson
disease type I with diffusion-weighted MR imaging. Blood Imaging 2008;28:1141-1148
Cells Mol Dis 2018;68:139-142 25. Liu B, Cai J, Zhu J, Zheng H, Zhang Y, Wang L. Diffusion
13. Razek AA, Massoud SM, Azziz MR, El-Bendary MM, Zalata K, tensor imaging for evaluating biliary atresia in infants and
Motawea EM. Prediction of esophageal varices in cirrhotic neonates. PLoS One 2016;11:e0168477
patients with apparent diffusion coefficient of the spleen. 26. Kim J, Yoon H, Lee MJ, Kim MJ, Han K, Han SJ, et al.
Abdom Imaging 2015;40:1465-1469 Clinical utility of mono-exponential model diffusion weighted
14. Mo YH, Jaw FS, Ho MC, Wang YC, Peng SS. Hepatic ADC value imaging using two b-values compared to the bi- or stretched
correlates with cirrhotic severity of patients with biliary exponential model for the diagnosis of biliary atresia in infant
atresia. Eur J Radiol 2011;80:e253-e257 liver MRI. PLoS One 2019;14:e0226627
15. Razek AAKA, Khashaba M, Abdalla A, Bayomy M, Barakat T. 27. Yoon H, Shin HJ, Kim MJ, Lee MJ. Quantitative imaging in
Apparent diffusion coefficient value of hepatic fibrosis and pediatric hepatobiliary disease. Korean J Radiol 2019;20:1342-
inflammation in children with chronic hepatitis. Radiol Med 1357
2014;119:903-909 28. Razek AA, Nada N. Correlation of choline/creatine and
16. Razek AA, Abdalla A, Omran E, Fathy A, Zalata K. Diagnosis apparent diffusion coefficient values with the prognostic
and quantification of hepatic fibrosis in children with parameters of head and neck squamous cell carcinoma. NMR
diffusion weighted MR imaging. Eur J Radiol 2011;78:129-134 Biomed 2016;29:483-489
kjronline.org https://doi.org/10.3348/kjr.2019.0824 7You can also read