Assessment of Groundwater Dependent Ecosystems for the Eel River Valley Basin Groundwater Sustainability Plan
←
→
Page content transcription
If your browser does not render page correctly, please read the page content below

TECHNICAL MEMORANDUM ◦ AUGUST 2021

Assessment of Groundwater Dependent
Ecosystems for the Eel River Valley Basin
Groundwater Sustainability Plan

P R E P A R E D   F O R              P R E P A R E D   B Y
GHD                                  Stillwater Sciences
718 3rd Street                       2855 Telegraph Ave., Suite 400
Eureka, CA 95501                     Berkeley, CA 94705

Stillwater Sciences
Technical Memorandum                                           Eel River Valley GDE Assessment

Suggested citation:
Stillwater Sciences. 2021. Assessment of Groundwater Dependent Ecosystems for the Eel River
Valley Basin Groundwater Sustainability Plan. Draft Technical Memorandum. Prepared by
Stillwater Sciences, Berkeley, California for GHD, Eureka, California.

Cover photos: Juvenile Chinook salmon

August 2021                                                                Stillwater Sciences
                                              i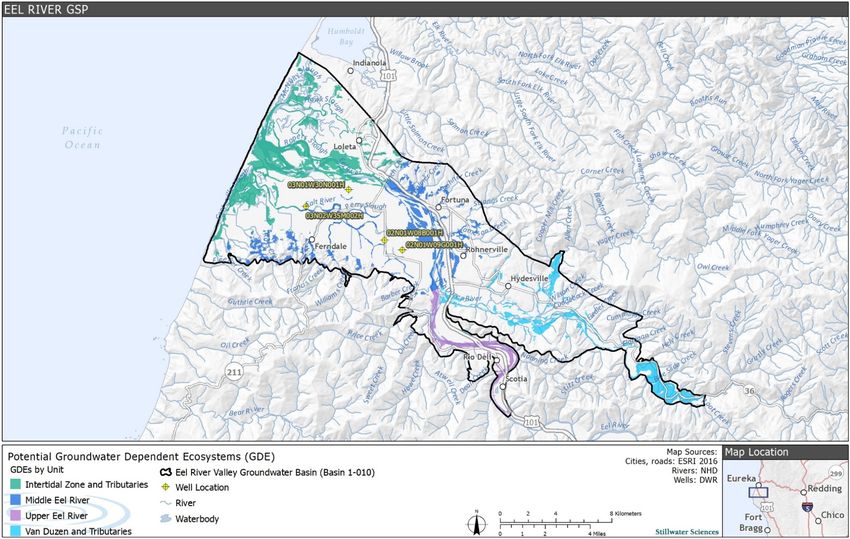
Technical Memorandum                                                                            Eel River Valley GDE Assessment

                                                  Table of Contents

1   BACKGROUND AND SETTING ......................................................................................... 1

    1.1        Background .................................................................................................................. 1
    1.2        Physiography ............................................................................................................... 1
    1.3        Geology and Soils ........................................................................................................ 4
    1.4        Hydrology .................................................................................................................... 4

2   GROUNDWATER-DEPENDENT ECOSYSTEMS IDENTIFICATION ........................ 5

    2.1     Vegetation Communities ............................................................................................. 5
        2.1.1 Data sources .......................................................................................................... 5
        2.1.2 Procedure ............................................................................................................... 6
    2.2     Special-status Species .................................................................................................. 9
        2.2.1 Data sources .......................................................................................................... 9
        2.2.2 Procedure ............................................................................................................... 9
    2.3     GDE Units.................................................................................................................. 10

3   HYDROLOGY ...................................................................................................................... 12

    3.1     Groundwater Levels ................................................................................................... 12
        3.1.1 Intertidal Zone and Tributaries ............................................................................ 13
        3.1.2 Middle Eel River ................................................................................................. 15
        3.1.3 Van Duzen River and Tributaries ........................................................................ 17
    3.2     Groundwater Quality ................................................................................................. 18
    3.3     Interconnected Surface Water .................................................................................... 19

4   GDE CONDITION ............................................................................................................... 19

    4.1     Vegetation Communities and GDE Habitats ............................................................. 19
        4.1.1 River/Stream/Canal ............................................................................................. 21
        4.1.2 Red alder ............................................................................................................. 22
        4.1.3 Willow shrub ....................................................................................................... 22
        4.1.4 Willow ................................................................................................................. 23
        4.1.5 Black cottonwood ................................................................................................ 23
        4.1.6 Annual/perennial grassland ................................................................................. 23
        4.1.7 Riparian mixed hardwood ................................................................................... 24
        4.1.8 Redwood.............................................................................................................. 24
    4.2     Beneficial Uses .......................................................................................................... 24
    4.3     Special-status Species ................................................................................................ 27
        4.3.1 Plants and Natural Communities ......................................................................... 31
        4.3.2 Terrestrial and aquatic wildlife............................................................................ 35
        4.3.3 Fish 44
    4.4     Invasive Species ......................................................................................................... 51

5   POTENTIAL EFFECTS ON GROUNDWATER-DEPENDENT ECOSYSTEMS ....... 51

    5.1        Approach.................................................................................................................... 51

August 2021                                                                                                        Stillwater Sciences
                                                                    ii
Technical Memorandum                                                                          Eel River Valley GDE Assessment

     5.2     Biological Data .......................................................................................................... 53
         5.2.1 Intertidal Zone and Tributaries ............................................................................ 54
         5.2.2 Middle Eel River ................................................................................................. 56
         5.2.3 Upper Eel River ................................................................................................... 58
         5.2.4 Van Duzen River and Tributaries ........................................................................ 59
     5.3     Climate Change Effects ............................................................................................. 61
     5.4     Summary of Potential Effects .................................................................................... 61
         5.4.1 Intertidal Zone and Tributaries ............................................................................ 61
         5.4.2 Middle Eel River ................................................................................................. 64
         5.4.3 Upper Eel River ................................................................................................... 66
         5.4.4 Van Duzen River and Tributaries ........................................................................ 67

6 SUSTAINABLE MANAGEMENT CRITERIA AND PROJECTS AND
MANAGEMENT ACTIONS ...................................................................................................... 69

7    LITERATURE CITED ........................................................................................................ 69

August 2021                                                                                                    Stillwater Sciences
                                                                   iii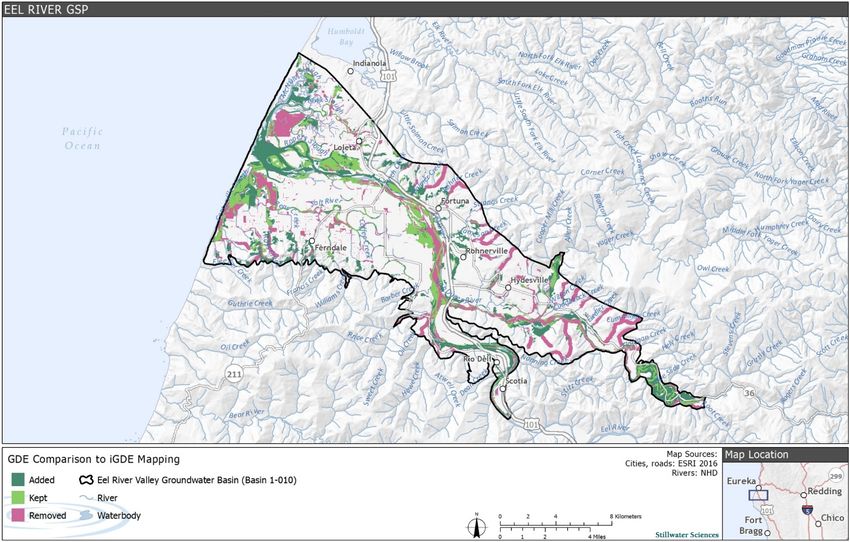
Technical Memorandum Eel River Valley GDE Assessment
Tables
Table 2.3-1. GDE Unit acreages in the Eel River Valley Basin................................................ 10
Table 3.1-1. Characteristics of wells used for groundwater level assessment. The locations
of the wells are shown on Figure 2.3-1. ................................................................ 13
Table 4.2-1. Beneficial uses designated within the ERVB hydrologic units ............................ 25
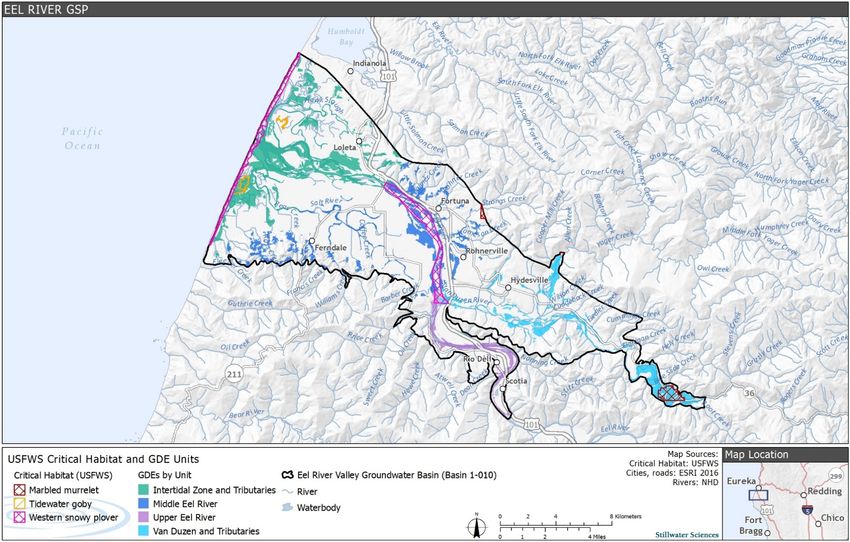
Table 4.3-1. USFWS and NMFS designated critical habitat1 within the ERVB....................... 28
Table 4.3-2. Special-status plant species with known occurrences in the Lower ERVB .......... 32
Table 4.3-3. Groundwater-dependent special-status terrestrial and aquatic wildlife species
with known occurrence or suitable habitat in the ERVB ...................................... 36
Table 4.3-4. Groundwater-dependent fish species with known occurrence or suitable
habitat in the ERVB .............................................................................................. 48
Table 5.1-1. Susceptibility classifications developed for evaluation of a GDE unit’s
susceptibility to changing groundwater conditions ............................................... 52
Figures
Figure 1.2-1. Eel River Valley Basin............................................................................................ 3
Figure 2.1-1. Comparison of the potential GDE map with the iGDE database ............................ 8
Figure 3.1-1. Depth to groundwater and land surface elevation range at GDEs on well
transect, Well 03N01W30N001H, associated with the Intertidal Zone and
Tributaries GDE Unit. 14
Figure 4.1-1. Dominant vegetation communities within Intertidal Zone and Tributaries
GDE Unit .............................................................................................................. 20
Figure 4.1-2. Dominant vegetation communities within Middle Eel River GDE Unit .............. 20
Figure 4.1-3. Dominant vegetation communities within the Upper Eel River GDE Unit .......... 21
Figure 4.1-4. Dominant vegetation communities within Van Duzen River and Tributaries
GDE Unit .............................................................................................................. 21
Figure 4.3-1. USFWS Critical Habitat within the ERVB ........................................................... 29
Figure 4.3-2. NMFS Critical Habitat within the ERVB ............................................................. 30
Figure 4.3-3. Aquatic species distribution in the ERVB ............................................................ 47
Figure 5.2-1. NDVI changes through time for the Intertidal Zone and Tributaries GDE Unit .. 54
Figure 5.2-2. Median summer NDVI in the Intertidal Zone and Tributaries GDE Unit versus
DTW at the two associated monitoring wells ....................................................... 55
Figure 5.2-3. Depth to groundwater and maximum rooting depth of dominant vegetation
type in the Intertidal Zone and Tributaries GDE Unit.. ........................................ 55
Figure 5.2-4. NDVI changes through time for the Middle Eel River GDE Unit ........................ 56
Figure 5.2-5. Median summer NDVI in the Middle Eel River GDE Unit versus DTW at the
two (2) associated monitoring wells ..................................................................... 57
Figure 5.2-6. Depth to groundwater and maximum rooting depth of dominant vegetation type in
the Middle Eel River GDE Unit ............................................................................ 57
Figure 5.2-7. Shallowest riffle depths vs. discharge at Scotia within the Middle Eel River
GDE Unit .............................................................................................................. 58
Figure 5.2-8. NDVI changes through time for the Upper Eel River GDE Unit ......................... 58
Figure 5.2-9. NDVI changes through time for the Van Duzen River and Tributaries GDE ...... 59
Figure 5.2-10. Depth to groundwater and maximum rooting depth of dominant vegetation type
in the Van Duzen River and Tributaries GDE Unit .............................................. 60
Figure 5.2-11. Average riffle depth vs. discharge at Bridgeville within the Van Duzen River
and Tributaries GDE Unit ..................................................................................... 60
August 2021 Stillwater Sciences
iv
Technical Memorandum                                             Eel River Valley GDE Assessment

Appendices
Appendix A. Special-status Terrestrial and Aquatic Wildlife Species Identified in Database
            Queries but Determined to Have No Reliance on Groundwater-Dependent
            Ecosystem Units
Appendix B. Vegetation Communities, Associated Alliances and Characteristics
Appendix C. Special-status Fish

August 2021                                                                   Stillwater Sciences
                                               v
Technical Memorandum                                                 Eel River Valley GDE Assessment

1       BACKGROUND AND SETTING
1.1        Background

This Technical Memorandum for the Eel River Valley Groundwater Sustainability Plan (GSP)
addresses the extent and condition of groundwater dependent ecosystems (GDEs) in the Eel River
Valley Basin (ERVB; Basin 1-010). As part of the California Sustainable Groundwater
Management Act (SGMA), Groundwater Sustainability Agencies (GSAs) are required to consider
GDEs and other beneficial uses of groundwater when developing their GSPs. SGMA defines
GDEs as “ecological communities of species that depend on groundwater emerging from aquifers
or on groundwater occurring near the ground surface” (23 CCR § 351(m)). As described in The
Nature Conservancy’s (TNC) guidance for GDE analysis (Rohde et al. 2018), a GDE’s
dependence on groundwater refers to reliance of GDE species and/or ecological communities on
groundwater or interconnected surface water for all or a portion of their water needs. SGMA
defines interconnected surface water as “surface water that is hydraulically connected at any point
by a continuous saturated zone to the underlying aquifer” where “the overlying surface water is
not completely depleted”. Identifying riparian or terrestrial GDEs requires mapping vegetation
communities that can tap groundwater through their root systems, assessing the elevation of
groundwater relative to the rooting depth of that vegetation, and mapping the extent of surface
water that is interconnected with groundwater (Rohde et al. 2018). Identifying the extent of
aquatic GDEs requires mapping the extent of interconnected surface water, which changes based
on season and water year type. Once the GDEs are mapped, the occurrence of special-status
species can be used to assess the beneficial users of GDEs and the ecological value of GDEs in
the basin, while remote sensing measurements can be used to track the health of groundwater-
dependent vegetation through time. This information will inform sustainable management criteria
for each management unit.

Plants can rely on water infiltrating into the soil via local rainfall, groundwater, surface water, or
other sources (Steinwand et al. 2006). GDEs are linked to groundwater (and or the capillary
fringe above the saturated groundwater zone) through plant roots or are direct users of
interconnected surface water (Klausmeyer et al. 2018, Braudrick et al. 2018). Riparian plants,
which are often present in GDEs, may instead be connected to surface water through their roots.
These plants may still be GDEs if the surface water they rely upon is interconnected with
groundwater upstream of the GDE. Some phreatophytes may be connected to groundwater when
it is available, but not require groundwater for survival and require more water than is available in
the soil from rainfall (Steinwand et al. 2006). The presence of non-groundwater sources, such as
surface water and soil moisture within and near a GDE, does not preclude the possibility that the
GDE is supported by groundwater. A GDE is distinct from other riparian ecosystems in that it is
either connected to a principal aquifer or is a beneficial user of a surface water or shallow/perched
groundwater source that is connected to a principal aquifer.

1.2        Physiography
The ERVB is a coastal basin in western Humboldt County, located at the downstream end of the
Eel River watershed and extending from the Pacific Ocean upstream through the lower reaches of
the Eel and Van Duzen River valleys (Figure 1.2-1). The valley floor comprises the majority of
the basin’s 73,700-acre surface area (DWR 2016) and ranges in elevation from 0 to 30 feet above
sea level (ft asl). The foothills that mark the basin’s inland perimeter reach elevations of up to 300
ft asl.

August 2021                                                                       Stillwater Sciences
                                                  1
Technical Memorandum                                              Eel River Valley GDE Assessment

The ERVB occupies a westward-plunging syncline approximately 20 miles north of the
Mendocino Triple Junction, where the Gorda, North American, and Pacific tectonic plates
intersect. The subduction of the Gorda Plate below the North American Plate along the Cascadia
Subduction Zone produces northeast-southwest compression, and the associated crustal
deformation in the overriding North American Plate is expressed as a 90-km-wide fold and thrust
belt (GHD 2021). The ERVB occupies the onshore portion of the Eel River syncline, a broad
structural downwarp in the accreted terranes of the Franciscan Complex and overlying Wildcat
Group sedimentary deposits (McLaughlin et al 2000).

The ERVB is bounded to the north by the Little Salmon Fault, an active, northwest-trending,
northeast-dipping thrust fault that accommodates regional compression. The western boundary
coincides with the Eel River Estuary. The ERVB is bounded to the south by the Wildcat Range,
the southern limb of the Eel River syncline, and bounded to the east by uplifted, less permeable
units of the Wildcat Group (DWR 2003). The Ferndale Fault runs along the southern edge of the
ERVB, north of the Wildcat Range (McLaughlin et al., 2000), and the Goose Lake Fault runs
through the terraces in the Yager Creek drainage (GHD 2021a).

.

August 2021                                                                    Stillwater Sciences
                                                2
Technical Memorandum                       Eel River Valley GDE Assessment

Figure 1.2-1. Eel River Valley Basin

August 2021                                            Stillwater Sciences
                                       3
Technical Memorandum                                                Eel River Valley GDE Assessment

1.3        Geology and Soils
The consolidated rocks of the Wildcat Group, deposited in the proto-basin during the late
Miocene to Pleistocene (McLaughlin 2000), form the bottom of the contemporary basin. The
Carlotta Formation is the uppermost unit of the Wildcat Group and is typically over 1,500 ft
thick. An accumulation of unconsolidated alluvium up to 200 ft thick overlies the downwarped
Carlotta Formation. The alluvium tends to be coarser (sands and gravels) near the Eel and Van
Duzen channels and finer (silts and clays) on the extensive floodplain (GHD 2021a).

The Ferndale soil series covers much of the central part of the basin, grading from fine sandy
loam along channels to silt loam on the floodplain (Watson et al 1925). The Ferndale soils are of
alluvial origin, well drained, up to 60 inches thick, and slightly alkaline at depth (NRCS 2016).
Coquille clay loam occurs on the floodplain near the coast. It is derived from tidal marsh deposits
and is poorly drained. Bayside loam occurs on the foothills of the Wildcat Range along the
southwestern edge of the ERVB and is intermediately drained. Willits clay loam occurs on the
marine terraces and steep slopes north of Fortuna and is well drained. To the east, the Willits unit
transitions to Rohnerville clay loam, a similar but deeper soil that occurs on level ground (Watson
et al. 1925)

1.4        Hydrology
The primary aquifers in the ERVB are the Carlotta Formation in the Upper Wildcat Group and
the sequence of overlying unconsolidated alluvial deposits. The Carlotta Formation is typically
over 1,500 ft thick and may be up to 4,000 ft thick locally, but the maximum productive depth is
not well defined. Groundwater in the formation is typically confined or semi-confined by silt and
clay interbeds. Wells tapping the Carlotta Formation are between 200 and 400 ft deep; artesian
conditions occur in wells near the foothills (GHD 2021a). The alluvial aquifer is up to 200 ft thick
and unconfined, with high conductivity. Most wells in the alluvial aquifer are about 70 ft deep.
Hydrologic connectivity between the alluvial aquifer and the Carlotta Formation is not well
understood, but there is likely some connection between the two in the central part of the ERVB
(GHD 2021a).

The alluvial aquifer is the primary water source for most agricultural wells (GHD 2021a).
Irrigation is the primary groundwater use sector. Between 2011 and 2020, average annual
groundwater extraction from the ERVB for irrigation was 14,077 acre-feet (acre-ft) (GHD
2021b). Average annual extraction for municipal, cannabis cultivation, and other uses was 1,733
acre-ft, 98 acre-ft, and 414 acre-ft, respectively (GHD 2021b).

Groundwater in the ERVB flows east to west, down the Eel and Van Duzen River valleys to the
coast. Groundwater discharge occurs at springs and seeps into the upland areas and by subsurface
flow to the tidal estuary (GHD 2021b). Both aquifers are hydraulically connected to the Pacific
Ocean along approximately 10 miles of coastline. There is no evidence to suggest that the
location of a freshwater-seawater transition zone has migrated landward since 1975 with the
exception of modest salinity increases near the Salt River and Loleta (SHN. 2021a). North of the
tidally, influenced reach of Eel River, most of the alluvial aquifer is naturally degraded by
seawater (USGS 1978). South of the Eel River, elevated chloride concentrations (>100 mg/L)
were detected in the alluvium along the coast where ground elevation was less than 10 ft asl.
Chloride concentration increased with depth at a given distance from the coast. Substantial
recharge to the groundwater system from the Eel River upstream of the tidally influenced reach
sustains a seaward hydraulic gradient that moderates seawater intrusion in the area (USGS 1978).

August 2021                                                                      Stillwater Sciences
                                                 4
Technical Memorandum Eel River Valley GDE Assessment
During the dry season, tidal cycles produce fluctuations in surface water levels of as much as 1.5
ft, causing localized transitions between gaining and losing stream conditions (SHN 2019).
The Eel River is the third largest watershed in California, draining 3,684 square miles (California
Department of Fish & Wildlife [CDFW] 2014). The mainstem Eel River is approximately 197
miles long, with headwaters in Mendocino County, 10 miles north of Lake Pillsbury. Upstream of
the ERVB, the river is dammed at the Scott and Cape Horn dams, forming Lake Pillsbury and
Van Arsdale Reservoir, respectively. Between 2010 and 2019, average annual discharge in the
Lower Eel River near Scotia (USGS gage 11477000) ranged between 1,619 and 12,150 cubic feet
per second (cfs); monthly average discharge ranged between 32 cfs (August 2014) and 54,201 cfs
(February 2017) (USGS 2019). The Van Duzen River drains into the Eel River about 14 miles
upstream of the Pacific Ocean. Other major tributaries include Yager Creek, which joins the Van
Duzen below the town of Carlotta.
The tidally influenced reach of the Eel River extends approximately 12 miles inland from the
river mouth, upstream of Fernbridge. The Eel River experiences very high levels of sedimentation
(CDFW 2014). The Salt River, a remnant channel of the Eel River, has been significantly
impacted by sedimentation; many of the Salt River’s low-gradient tributaries have filled with
sediment and do not convey significant surface flow. As of 2019, restoration efforts by the
Humboldt County Resource Conservation District (HCRCD) have opened portions of the Salt
River to tidal inundation and partial freshwater inputs (HCRCD 2021).
2 GROUNDWATER-DEPENDENT ECOSYSTEMS IDENTIFICATION
2.1 Vegetation Communities
Potential GDE units in the ERVB were identified using the California Department of Water
Resources’ (DWR) indicators of groundwater-dependent ecosystems (iGDE) database, which
includes vegetation and wetland natural communities, is published online, and is referred to as the
Natural Communities Commonly Associated with Groundwater dataset (DWR 2020). These data
were reviewed and augmented with additional vegetation mapping datasets to produce a map of
final GDE Units; additional information on vegetation community composition, aerial imagery,
depth to groundwater, species distributions, salinity tolerance, and rooting depths was also
reviewed to support this determination.
2.1.1 Data sources
This section includes brief descriptions of the vegetation community data and other information
sources used to identify and aggregate potential GDEs into final GDE units. The iGDE database
(Klausmeyer et al. 2018) was reviewed in a geographic information system (GIS) and used to
generate a preliminary map to serve as a guide for initial identification of potential GDEs in the
ERVB.
For more precise identification of potential GDEs, a refined vegetation map was developed by
adjusting Classification and Assessment with Landsat of Visible Ecology Groupings (CalVeg) to
better match current National Agriculture Imagery Program (NAIP) imagery (U.S. Department of
Agriculture [USDA] 2020). The refined vegetation map incorporates the following datasets:
• CalVeg – Forest Service (USDA 2014). North Coast region: Imagery date: 2000-2007;
Minimum mapping unit (MMU): 2.5-acre.
August 2021 Stillwater Sciences
5Technical Memorandum Eel River Valley GDE Assessment
• NAIP (USDA 2020). Humboldt County: Imagery date: 2020; Resolution: 1 meter.
In addition, other available vegetation assessments (H.T. Harvey & Associates 2015 and Golec
and Miller 2017) were reviewed to further refine vegetation boundaries. The geomorphic
description classification from the National Resources Conservation Service (NRCS)-USDA Soil
Survey Geographic Database (SSURGO) was subsequently incorporated to assess the landscape
position and likelihood of groundwater dependence for select vegetation types.
Maximum rooting depths from the literature are provided in Appendix A. Another way to explore
the rooting depth of plants is to assess their elevation relative to the river channel surface (the
relative elevation). Assuming that the groundwater elevation near the stream is similar to the
stream elevation, we can assess the likely rooting depth of plants based on their relative elevation.
2.1.2 Procedure
The steps for defining and mapping GDEs outlined in Rohde et al. (2018) were used as a
guideline for this process. A decision tree was applied to determine when species or biological
communities were considered groundwater-dependent based on definitions found in the 23 CCR
§ 351(m) (State of California 2021) and Rohde et al. (2018). This decision tree, created to
systematically and consistently address the range of conditions encountered, is summarized
below; the term “unit” refers to an area with consistent vegetation and hydrology.
The unit is a GDE if groundwater is likely:
1. Interconnected with surface water in a stream channel;
2. An important hydrologic input to the unit during some time of the year;
3. Important to survival and/or natural history of inhabiting species; and
4. Associated with a principal aquifer used as a regionally important source of groundwater.
The unit is not a GDE if its hydrologic regime is primarily controlled by:
1. Surface discharge or drainage from an upslope human-made structure(s) with no
connection to a principal aquifer (such as irrigation canal, irrigated fields, reservoir, cattle
pond, or water treatment pond/facility); or
2. Precipitation inputs directly to the unit surface (this excludes vernal pools from being
GDEs where units are hydrologically supplied by direct precipitation and very local
shallow subsurface flows from the immediately surrounding area).
The initial potential GDE map was generated by editing the CalVeg (USDA 2014) dataset to
better match NAIP 2020 imagery (USDA 2020), with a focus on the estuary, Eel River mainstem,
and lower Van Duzen River areas. Surface water boundaries were reshaped, and vegetation types
reassigned, to match extents in the imagery.
Several vegetation types were reviewed individually. Ponds and saltmarsh/mudflat habitats (e.g.,
pickleweed-cordgrass) were removed from the potential GDE map if determined, based on aerial
imagery, to be tidally connected. Irrigation ditches (e.g., straightened channels) were also
removed from the potential GDE map. Based on aerial imagery and landform, some vegetated
features were semi-permanently inundated and were grouped into the river, stream, canal feature
type. In addition, available information on maximum rooting depths was used as an additional
filter to help ensure that non-GDE vegetation types were excluded.
August 2021 Stillwater Sciences
6Technical Memorandum Eel River Valley GDE Assessment
Finally, SSUGRO landform data (USDA 2020) were overlaid and the potential GDE
determination based on landform location for some vegetation types (e.g., redwood) was updated.
The landform data were also used to remove agriculture and pasture areas located in
backswamps, hillslopes, fan remnants, flood-plain steps, and natural levees from the potential
GDE map.
The differences between the final GDE map and the iGDE map (DWR 2020) are shown in Figure
2.1-1. GDEs were added in the intertidal zone and along the upstream reaches of the Eel and Van
Duzen Rivers based on refined mapping of open water features based on NAIP 2020 imagery.
GDEs were removed in upstream tributaries based on landform data and along the Eel mainstem
and in the intertidal zone based on refined vegetation mapping.
August 2021 Stillwater Sciences
7Technical Memorandum Eel River Valley GDE Assessment
Figure 2.1-1. Comparison of the potential GDE map with the iGDE database (DWR 2020)
August 2021 Stillwater Sciences
8Technical Memorandum Eel River Valley GDE Assessment
2.2 Special-status Species
As part of the ecological inventory, special-status species and sensitive natural communities that
are potentially associated with GDEs in the ERVB were identified. For the purposes of this
document, special-status species are defined as those:
• Listed, proposed, or under review as endangered or threatened under the federal
Endangered Species Act (ESA) or the California Endangered Species Act (CESA);
• Designated by CDFW as a Species of Special Concern;
• Designated by CDFW as Fully Protected under the California Fish and Game Code
(Sections 3511, 4700, 5050, and 5515);
• Designated as Bureau of Land Management (BLM) sensitive;
• Designated as endangered or rare under the California Native Plant Protection Act
(CNPPA); and/or
• Taxa that meet the criteria for listing as described in Section 15380 of the CEQA
Guidelines, including species listed on CDFW’s Special Vascular Plants, Bryophytes, and
Lichens List (CDFW 2021) or plants with a California Rare Plant Rank (CRPR) of 1, 2, 3,
or 4.
Sensitive natural communities are defined as those natural community types (e.g., legacy natural
communities in CDFW’s California Natural Diversity Database [CNDDB], vegetation alliances
and/or associations) with a state ranking of S1 (critically imperiled), S2 (imperiled), S3
(vulnerable), or an unranked association that is considered sensitive on CDFW’s California
Sensitive Natural Communities List (CDFW 2020) or in the CNDDB (CDFW 2021b).
2.2.1 Data sources
Spatial database queries included potential GDEs plus a one-mile buffer. This buffer accounts for
spatial uncertainty in the data sources. Tests with different buffer sizes showed that larger buffers
incorporated too many upland species unlikely to occur in the groundwater basin. Databases
queried included:
• California Natural Diversity Database (CNDDB) (CDFW 2020);
• eBird (2021);
• TNC freshwater species lists generated from the California Freshwater Species Database
(CAFSD) (TNC 2021);
• National Marine Fisheries Service (NMFS) California Species List tools (NMFS 2021);
and
• Consortium of California Herbaria (CCH 2021) (queried from CCH1 Berkeley Mapper and
CalFlora).
2.2.2 Procedure
Database query results were reviewed while special-status species and sensitive habitats that may
occur within or be associated with the vegetation and aquatic communities in or immediately
adjacent to potential GDEs were identified. These special-status species and sensitive community
types were then consolidated into a list, along with summaries of habitat preferences, potential
groundwater dependence, and reports of any known occurrences.
August 2021 Stillwater Sciences
9Technical Memorandum Eel River Valley GDE Assessment
Wildlife species were evaluated for potential groundwater dependence using determinations from
the Critical Species Lookbook (Rohde et al. 2019) or by evaluating known habitat preferences,
life histories, and diets. Species GDE associations were assigned one of three categories:
• Direct: species directly dependent on groundwater for some or all water needs (e.g.,
cottonwood with roots in groundwater, juvenile steelhead in dry season)
• Indirect: species dependent upon other species that rely on groundwater for some or all
water needs (e.g., riparian birds)
• No known reliance on groundwater
Sensitive natural communities were classified as either likely or unlikely to depend on
groundwater based on species composition using the same methodology as vegetation
communities (Section 2.1). Plant species were evaluated for potential groundwater dependence
based on their habitat (Jepson Flora Project 2020) and association with vegetation communities
classified as GDEs. Special-status plant GDE associations were assigned one of three categories:
likely, possible, or unlikely. The “possible” category was included to classify plant species with
limited habitat data or where a species may have an association with a vegetation community
identified as a GDE.
Database query results for local and regional special-status species occurrences were combined
with their known habitat requirements to develop a list of groundwater-dependent special-status
species (Section 4) that satisfy the following criteria: 1) the species has been documented to occur
within the GDE unit, or 2) is known to occur in the region and suitable habitat is present in the
GDE unit.
2.3 GDE Units
Four (4) GDE units were identified within the ERVB (Figure 2.3-1, Table 2.3-1):
• Intertidal Zone and Tributaries: Intertidal reach downstream of Fernbridge
• Middle Eel River: Fernbridge to Eel/Van Duzen rivers’ confluence
• Upper Eel River: Eel/Van Duzen rivers’ confluence to Scotia
• Van Duzen River and Tributaries: Lower Van Duzen River
Table 2.3-1. GDE Unit acreages in the Eel River Valley Basin
Area
GDE unit
(acres)
Intertidal Zone and
5,981
Tributaries
Middle Eel River 3,809
Upper Eel River 1,136
Van Duzen River and
2,878
Tributaries
Total 13,804
1 Totals may not appear to sum exactly due to rounding error.
August 2021 Stillwater Sciences
10Technical Memorandum Eel River Valley GDE Assessment
Figure 2.3-1. Potential GDE units and long-term groundwater monitoring well locations
August 2021 Stillwater Sciences
11Technical Memorandum Eel River Valley GDE Assessment 3 HYDROLOGY The following section (3.1) features a general description of shallow groundwater elevation in the ERVB and uses long-term monitoring well data to assess temporal trends in groundwater elevation for GDE units where well data are available. Section 3.2 covers groundwater quality and its potential effect on GDEs. Section 3.3 assesses the extent of interconnected surface water and spatial trends in interconnected surface water that can later be used to assess potential impacts of groundwater management on GDEs. 3.1 Groundwater Levels Wet and dry season groundwater elevation contours from 2017, provided by GHD, show that groundwater elevation increases with increasing distance from the coast. Consequently, groundwater generally flows down the Eel and Van Duzen valleys from east to west. Groundwater gradients are typically shallow on the alluvial plain, increasing significantly within about 500 ft of the uplands that bound the alluvial plain to the northeast and southwest. Similarly, gradients steepen at the uplands that bound the lower Eel and Van Duzen river valleys, in which longitudinal groundwater elevation gradients are substantially steeper than in the alluvial plain, but roughly reflect the increase in land surface slope. These contours included data from 44 wells, 14 of which were installed since 2016, while the remainder are older. Long-term records of shallow groundwater are sparse for the ERVB. This Technical Memorandum presents data from four (4) wells with a data record of shallow groundwater elevation extends from at least 2000 to 2017. Wells located on the alluvial plain, where most GDEs are located, were selected to best characterize shallow groundwater conditions at GDEs. Wells are associated with the nearest GDE unit; two (2) are associated with the Intertidal Zone and tributaries, and two (2) with the Middle Eel River (Figure 2.3-1). In general, shallow groundwater elevations have remained stable since 1990 at all four (4) wells. There are no long-term shallow groundwater data for the Upper Eel and Van Duzen rivers, nor for tributaries units. In 2017, Humboldt County installed nine (9) new groundwater monitoring wells with pressure transducers (and installed transducers in several existing private wells), expanding the monitoring network into these upstream units (GHD 2021c). As was done for the Intertidal Zone and tributaries and Middle Eel analysis, shallow wells were sought within river valleys to provide rough constraints on shallow groundwater conditions. No suitable wells were found in the Upper Eel GDE unit; existing monitoring points either do not show shallow groundwater (
Technical Memorandum                                                   Eel River Valley GDE Assessment

  elevations than their associated wells. On the alluvial plain, where groundwater gradients are
  shallow, DTW at these GDEs is likely to be shallower than at the well.

  The following sections assess long-term groundwater elevation changes for the Intertidal Zone
  and Tributaries and Middle Eel GDE units in sections 3.1.1 and 3.1.2, respectively. Groundwater
  elevation from 2016-2019 in the Van Duzen and Tributaries GDE Unit are assessed in Section
  3.1.3 because of the propensity of the lower Van Duzen to go dry. Due to sparse data
  groundwater elevations were not assessed in the Upper Eel GDE Unit. Considering the limited
  number of long-term monitoring wells, the groundwater elevation data presented in this section
  are intended to illustrate general trends only and explore trends in groundwater elevation through
  time.

  3.1.1         Intertidal Zone and Tributaries
  Well 03N01W30N001H is an active irrigation well installed in 1973 and screened between 20
  and 45 ft bgs (Table 3.1-1). The well is located on the alluvial plain 0.5 miles south of the Eel
  River channel, 4.8 miles from the coast (Figure 2.3-1). From 1989 to present, DTW has been
  stable, typically between 14 and 22 ft bgs, with seasonal fluctuations typically between 3 and 5 ft
  (Figure 3.1-1). Figures 3.1-1 to 3.1-4 show (in green) the range of ground elevation within GDEs
  within 0.5 miles of the well, as described above. Ground elevation at nearby GDEs ranges from 2
  to 15 ft below the well site, approximately 3 to 16 ft above the long-term average water level in
  the well.

   Table 3.1-1. Characteristics of wells used for groundwater level assessment. The locations of
                               the wells are shown on Figure 2.3-1.

                                                            Well depth   Screen depth     Water level data
        Well                   GDE Unit
                                                             (ft bgs)       (ft bgs)        available
03N01W30N001H        Intertidal Zone and Tributaries           50           20–45            1973–2020
03N02W35M002H        Intertidal Zone and Tributaries           42          Unknown           1973–2020
02N01W08B001H              Middle Eel River                    40          Unknown           1952–2017
02N01W09G001H              Middle Eel River                    30            25-30           1986–2020
                         Van Duzen River and
MW-9s                                                          25          Unknown           2016–2019
                             Tributaries

  August 2021                                                                        Stillwater Sciences
                                                       13
Technical Memorandum Eel River Valley GDE Assessment
Figure 3.1-1. Depth to groundwater and land surface elevation range at GDEs on well transect,
Well 03N01W30N001H, associated with the Intertidal Zone and Tributaries GDE
Unit. Well site elevation is assumed to be 0 ft bgs.
Well 03N02W35M002H is an active irrigation well installed in 1973 with unknown screen depth
(Table 3.1-1). The well is located on the alluvial plain north of the Salt River channel, 3.3 miles
from the coast (Figure 2.3-1). From 1989 to present, DTW has been stable, typically between 4
and 11 ft bgs, with seasonal fluctuations typically between 3 and 5 ft (Figure 3.1-2). Ground
elevation at nearby GDEs ranges from 8 ft below to 3 ft above the well site, approximately 0.5 to
11 ft above the long-term average water level in the well.
August 2021 Stillwater Sciences
14Technical Memorandum Eel River Valley GDE Assessment
Figure 3.1-2. Depth to groundwater and ground elevation range at GDEs on well transect, Well
03N02W35M002H, associated with the Intertidal Zone and Tributaries GDE Unit.
Well site elevation is assumed to be 0 ft bgs.
3.1.2 Middle Eel River
Well 02N01W08B001H is an active irrigation well installed in 1952 with unknown screen depth
(Table 3.1-1). The well is located on the alluvial plain south of the Salt River Channel, 7 miles
from the coast (Figure 2.3-1). At Well 02N01W08B001H, depth to water declined gradually from
an annual average of approximately 17 ft bgs in 1965 to approximately 23 ft bgs in 1986. Since
1986, groundwater elevation has remained stable, typically between 10 and 27 ft bgs, with
seasonal fluctuations typically between 5 and 15 ft. (Figure 3.1-3). Ground elevation at nearby
GDEs ranges from 5 to 7 ft below the well site, approximately 13 to 15 ft above the long-term
average water level in the well.
August 2021 Stillwater Sciences
15Technical Memorandum Eel River Valley GDE Assessment
Figure 3.1-3. Depth to groundwater and ground elevation range at GDEs on well transect, Well
02N01W08B001H, associated with the Middle Eel River GDE Unit. Well site
elevation is assumed to be 0 ft bgs.
Well 02N01W09G001H is an active residential well installed in 1986 and screened between 25
and 30 ft bgs. The well is located on the alluvial plain 1.5 miles west of the Eel River channel, 1.5
miles downstream of the Eel-Van Duzen confluence (Figure 2.3-1). At Well 02N01W09G001H,
depth to water has remained stable since 1986, between 15 and 30 ft bgs, with seasonal
fluctuations typically between 5 and 10 ft. (Figure 3.1-4). Ground elevation at nearby GDEs
ranges from 7 ft below to 1 ft above the well site, approximately 17 to 19 ft above the long-term
average water level in the well.
August 2021 Stillwater Sciences
16Technical Memorandum Eel River Valley GDE Assessment
Figure 3.1-4. Depth to groundwater and ground elevation range at GDEs on well transect, Well
02N01W09G001H, associated with the Middle Eel River GDE Unit. Well site
elevation is assumed to be 0 ft bgs.
The two long-term wells on the Middle Eel (02N01W08B001H and 02N01W09G001H) are
located along the upper portions of Salt Creek (Figure 2.3-1). Groundwater in Figures 3.1-3 and
3.1-4 is within the 30 ft cutoff used to define GDEs, but is generally (but not always) deeper than
the rooting depth of species found near the GDEs (generallyTechnical Memorandum Eel River Valley GDE Assessment
Figure 3.1-5. Depth to groundwater and ground elevation ranges at GDEs on well transect,
MW-9s, associated with the Van Duzen River and Tributaries GDE Unit. Well site
elevation is assumed to be 0 ft bgs.
3.2 Groundwater Quality
Fifteen (15) County wells were sampled in 2021 for constituents of concern including metals,
nutrients, salts, pesticides, herbicides, Volatile organic compounds (VOCs), Semivolatile organic
compounds (SVOCs), microbial, radioactive, polychlorinated biphenyl (PCB), and physical
contaminants (SHN 2021b). Analytical results for five (5) of the 15 wells have been received and
all results have been below primary maximum contaminant levels (MCLs), except for alkalinity.
SHN (2021b) included review of historic data and found that water quality throughout the ERVB
is of good quality for its intended uses. Four (4) constituents of concern—totally dissolved solids
(TDS), nitrate, manganese, and iron—were identified based on the historical data review and are
discussed below.
Nutrients (e.g., nitrate) and TDS have been reported near the Ferndale area of the ERVB at levels
near or above primary and secondary MCLs for drinking water (SHN 2021a). A long-term water
quality monitoring program is planned to involve the sampling of nitrate and TDS on an annual
basis at a subset of wells across the ERVB, with a focus on the Ferndale area to assess spatial
trends in these contaminants.
Metals (e.g., iron and manganese) have been reported by the Palmer Creek Community Services
District (CSD), Del Oro Water Company, and Loleta CSD at levels above primary MCLs (SHN
August 2021 Stillwater Sciences
18Technical Memorandum Eel River Valley GDE Assessment
2021b). These metals are thought to occur naturally due to the geologic formations comprising
the aquifers, and therefore are considered background concentrations.
Recent chloride concentration data from the shallow aquifer indicate no significant migration in
the landward edge of the freshwater-seawater transition zone (defined as chloride concentrations
exceeding 100 mg/L) between 1975 and 2021 (SHN 2021a).
3.3 Interconnected Surface Water
Surface water systems are strongly connected to the shallow alluvial aquifer (SHN 2019).
Preliminary groundwater model river discharge results provided by GHD show gaining
conditions on the Van Duzen River upstream of Yager Creek. Downstream of Yager Creek,
losing conditions are more prevalent. For example, the Van Duzen goes dry most years in the
vicinity of Highway 101, a losing reach. Continuous coupled groundwater and surface water
monitoring initiated by Humboldt County in 2016 indicate that subsurface contributions from the
Van Duzen strongly influence surface-groundwater connections on the east bank of the Eel River
downstream of the Van Duzen confluence (SHN 2019). Due to the steep groundwater gradient
toward the Eel River from the east, gaining stream conditions are thought to occur year-round in
this reach, consistent with preliminary model results. Monitoring on the west bank of the Eel
River between the Van Duzen River confluence and Fortuna shows losing conditions near the
confluence, particularly during the dry season, transitioning to gaining conditions downstream
that typically occur during the wet season (SHN 2019). Preliminary model results indicate that a
slight gaining reach occurs downstream at Fortuna due to subsurface contributions from Strongs
Creek and Rohner Creek losses. Gaining conditions also occur at Fernbridge and along much of
the Salt River. Model results show slight losing conditions on some tributaries of the Van Duzen
(Fox Creek) and Salt River (Williams, Francis, and Reas creeks).
The shallow aquifer is hydraulically connected with the ocean along approximately 10 miles of
coastline. In the Eel River, tidal influence extends upstream of Fernbridge, approximately 12
miles inland from the river mouth (SHN 2021a).
4 GDE CONDITION
This section characterizes the GDE units based on their hydrologic and ecological conditions,
then assigns a relative ecological value to each unit by evaluating its ecological assets and its
vulnerability to changes in groundwater (Rohde et al. 2018).
4.1 Vegetation Communities and GDE Habitats
There were seven (7) dominant vegetation communities associated with groundwater in the
Lower ERVB. These vegetation communities are mostly affiliated with the North Coast riparian
forest and shrubland habitats within the riparian and floodplain zone along the Eel and Van
Duzen rivers. The most prevalent vegetation communities (top five [5]) within each GDE unit are
provided in Figures 4.1-1 through 4.1-4. All dominant vegetation communities—including their
common species assemblages, typical landform position, and stand characteristics—are described
in this section. In addition to these vegetation communities, the ERVB’s GDE habitat
encompasses areas that are frequently inundated. These features are characterized as
River/Stream/Canal and are included in Figures 4.1-1 through 4.1-4.
August 2021 Stillwater Sciences
19Technical Memorandum Eel River Valley GDE Assessment
Figure 4.1-1. Dominant vegetation communities within Intertidal Zone and Tributaries GDE
Unit
Figure 4.1-2. Dominant vegetation communities within Middle Eel River GDE Unit
August 2021 Stillwater Sciences
20Technical Memorandum Eel River Valley GDE Assessment
Figure 4.1-3. Dominant vegetation communities within the Upper Eel River GDE Unit
Figure 4.1-4. Dominant vegetation communities within Van Duzen River and Tributaries GDE
Unit
4.1.1 River/Stream/Canal
Permanently or semi-permanently flooded areas, both bare and vegetated areas with a fresh or
brackish water regime, were included in the River/Stream/Canal cover type. Some brackish and
freshwater marshes and grasslands were included within this GDE habitat type based on their
landform position and high inundation rate. Emergent herbaceous species found within these
areas typically have a maximum rooting depth of 1 to 2 ft, such as broad-leaved cattail (Typha
latifolia), saltmarsh bulrush (Bolboschoenus maritimus), various rushes (Juncus spp.), pale spike
rush (Eleocharis macrostachya), and various bulrush (Scirpus spp.). High marsh and wet
August 2021 Stillwater Sciences
21Technical Memorandum Eel River Valley GDE Assessment
grassland species included reed canary grass (Phalaris arundinacea), salt grass (Distichlis
spicata), tufted hairgrass (Deschampsia cespitosa), creeping bent grass (Agrostis stolonifera), and
Pacific silverweed (Potentilla anserina subsp. pacifica). This group is found most often in
drainages, low depressions, wetlands adjacent to drainages and saltmarsh, and concave isolated
wetlands in active floodplains that are inundated most of the year. This GDE habitat is distributed
throughout all GDE units of the ERVB and totals 5,212 acres of the mapped GDE habitat.
4.1.2 Red alder
Red alder (Alnus rubra) forest community is the most prevalent GDE habitat in the ERVB,
composing 23% (or 3,231 acres) of the total mapped GDE habitats. Red alder, a native deciduous
hardwood, is dominant in this forest community type with greater than 50% relative tree cover.
The community’s mostly mature and continuous tree canopy, aside from red alder, features low
cover by other hardwoods and conifers such as bigleaf maple (Acer macrophyllum), Pacific
willow (Salix lasiandra), California bay laurel (Umbellularia californica), black cottonwood
(Populus trichocarpa), and Sitka spruce (Picea sitchensis). The sparse to intermittent shrub layer
may include various willows (Salix spp.), salmonberry (Rubus spectabilis), and thimbleberry
(Rubus parviflorus), while the herbaceous layer comprises various ferns (western sword fern
[Polystichum munitum], lady fern [Athyrium filix-femina]) and forbs (stinging nettle [Urtica
dioica], pig-a-back plant [Tolmiea diplomenziesii], and candy flower [Claytonia sibirica]). Red
alder stands often occur along stream and river backwaters, banks, bottoms, flood plains, mouths,
terraces, and slopes of all aspects (California Native Plant Society [CNPS] 2021). This riparian
forest community is best characterized by the Alnus rubra Forest Alliance and has an estimated
maximum rooting depth of 13.1 ft. (Appendix A). It is distributed within all ERVB GDE units
and is the predominant community in the Middle Eel River, Upper Eel River, and Van Duzen
River and Tributaries GDE units, totaling 1,937 acres, 421 acres, and 445 acres, respectively
(Figures 4.1-2–4.1-4).
4.1.3 Willow shrub
Willow shrub is a prevalent vegetation community in the ERVB (~8% or 1,039 acres) that
establishes along high-flow river bars, banks, and riparian wash areas. This vegetation
community recruits on exposed riverbanks, initially forming a sparse, patchy shrub layer that
develops into a fairly dense shrub-dominant stand type. These recruited areas are mostly
attributed to two native willow shrubs that are clonal by root-shoots: Hinds’ willow (Salix exigua
var. hindsiana) and dusky willow (Salix melanopsis). These stands are common to sandy gravel
and active floodplains with an intermittent to continuous shrub layer, a minor tree component
attributed to some riparian species recruitment, and a variable herbaceous layer that consists of a
mixture of forbs and annual grasses. This community type also includes arroyo willow (Salix
lasiolepis), Sitka willow (Salix sitchensis), and coastal willow (Salix hookeriana) shrubland
stands, which typically occur on stream banks and benches, slope seeps, stringers along
drainages, deflation plains and swales, and floodplains (CNPS 2021). They form a continuous
canopy composed of species that are less than 30 ft in height with low cover by emergent trees.
The willow shrub vegetation community is characterized by the Salix exigua Shrubland Alliance
and has a maximum rooting depth of approximately 7 ft. It is distributed in the Intertidal Zone
and Tributaries, Middle Eel River, and Van Duzen River and Tributaries GDE units, where it
composes 664 acres, 260 acres, and 116 acres, respectively (Figures 4.1-1, 4.1-2, 4.1-4).
August 2021 Stillwater Sciences
22Technical Memorandum Eel River Valley GDE Assessment
4.1.4 Willow
The willow vegetation community is characterized by a complex of variously established willow
stands that vary in species dominance but primarily form riparian forested habitat. It occurs along
banks and benches and on low-gradient depositions along rivers and streams. Tree canopy is less
than 65 ft in height and is intermittent to continuous with a sparse to intermittent shrub layer.
Dominant cover is attributed to Pacific willow (Salix lasiandra), Sitka willow, and Scouler’s
willow (Salix scouleriana). Arroyo willow and coastal willow contribute to the midstory canopy.
Other native riparian hardwoods and shrub species observed in this stand type include red alder,
bigleaf maple, black cottonwood, and red elderberry (Sambucus racemosa). This riparian forest
community is characterized by the Salix lucida ssp. lasiandra Forest and Woodland Alliance, a
sensitive natural community on CDFW’s California Sensitive Natural Communities List (CDFW
2020) with a state rarity ranking of S3 (vulnerable in the state due to a restricted range, relatively
few populations [often 80 or fewer], recent and widespread declines, or other factors making it
vulnerable to extirpation). Maximum rooting depth is typically up to 6.9 ft. It is distributed within
all GDE units, totaling 783 acres or 6% of the total mapped GDE habitats in the ERVB (Figures
4.1-1–4.1-4).
4.1.5 Black cottonwood
Black cottonwood stands form a dominant riparian hardwood forest and woodland type in the
ERVB (5% [655 acres] of the mapped GDE habitats), occurring in seasonally flooded and
permanently saturated soils on stream banks and alluvial terraces (CNPS 2021). Black
cottonwood is dominant within the tree canopy, intermittent to continuous and reaching to 100 ft
in height. The shrub layer is open to continuous and the herbaceous understory varies from sparse
to abundant. Other hardwoods present in this community include red alder, wax myrtle (Morella
californica), Oregon ash (Fraxinus latifolia), various willows, and bigleaf maple. This riparian
forested community is characterized by the Populus trichocarpa Forest and Woodland Alliance, a
sensitive natural community (S3) on CDFW’s California Sensitive Natural Communities List
(CDFW 2020). Black cottonwood has a maximum rooting depth of 9.8 ft. It is distributed in all
GDE units, though is most prevalent within the Intertidal Zone and Tributaries and Middle Eel
River GDE units, where it totals 219 acres and 352 acres, respectively (Figures 4.1-1 and 4.1-2).
4.1.6 Annual/perennial grassland
This group is composed of a mixture of herbaceous annual forbs, perennial herbs, and naturalized
annual and perennial grasses. This community type has a high percent cover of facultative and
facultative-wetland grasses with low to moderate cover by herbaceous forbs. Cover within this
grassland community type is mostly attributed to non-native naturalized species (e.g., reed canary
grass, tall fescue [Festuca arundinacea], creeping bent [Agrostis stolonifera], common velvet
grass [Holcus lanatus], Kentucky blue grass [Poa pratensis subsp. pratensis], rye grass [Festuca
perenne], meadow foxtail [Alopecurus pratensis], and low manna grass [Glyceria declinata]).
There is low recruitment by shrub and tree species in these grasslands, while land use involves
historically diked pastureland, various agriculture, areas near development, and open space. This
group typically occurs in topographically flat areas on active or other floodplains. Soil saturation
and inundation vary at these locations, but these grasslands indicate typically moist conditions for
at least a portion of the year. These non-native grasslands area associated with the Phalaris
aquatica - Phalaris arundinacea, Holcus lanatus - Anthoxanthum odoratum, Poa pratensis -
Agrostis gigantea - Agrostis stolonifera, and Lolium perenne Herbaceous Semi-Natural Alliances.
Maximum rooting depths of these grasslands generally range from 3.2 to 4 ft. The grassland
August 2021 Stillwater Sciences
23You can also read