Assessment of real life eating difficulties in Parkinson's disease patients by measuring plate to mouth movement elongation with inertial sensors ...
←
→
Page content transcription
If your browser does not render page correctly, please read the page content below
www.nature.com/scientificreports
OPEN Assessment of real life eating
difficulties in Parkinson’s disease
patients by measuring plate
to mouth movement elongation
with inertial sensors
Konstantinos Kyritsis1*, Petter Fagerberg2, Ioannis Ioakimidis2, K. Ray Chaudhuri3,
Heinz Reichmann4, Lisa Klingelhoefer4 & Anastasios Delopoulos1
Parkinson’s disease (PD) is a neurodegenerative disorder with both motor and non-motor symptoms.
Despite the progressive nature of PD, early diagnosis, tracking the disease’s natural history and
measuring the drug response are factors that play a major role in determining the quality of life of
the affected individual. Apart from the common motor symptoms, i.e., tremor at rest, rigidity and
bradykinesia, studies suggest that PD is associated with disturbances in eating behavior and energy
intake. Specifically, PD is associated with drug-induced impulsive eating disorders such as binge
eating, appetite-related non-motor issues such as weight loss and/or gain as well as dysphagia—
factors that correlate with difficulties in completing day-to-day eating-related tasks. In this work we
introduce Plate-to-Mouth (PtM), an indicator that relates with the time spent for the hand operating
the utensil to transfer a quantity of food from the plate into the mouth during the course of a meal.
We propose a two-step approach towards the objective calculation of PtM. Initially, we use the 3D
acceleration and orientation velocity signals from an off-the-shelf smartwatch to detect the bite
moments and upwards wrist micromovements that occur during a meal session. Afterwards, we
process the upwards hand micromovements that appear prior to every detected bite during the meal
in order to estimate the bite’s PtM duration. Finally, we use a density-based scheme to estimate the
PtM durations distribution and form the in-meal eating behavior profile of the subject. In the results
section, we provide validation for every step of the process independently, as well as showcase our
findings using a total of three datasets, one collected in a controlled clinical setting using standardized
meals (with a total of 28 meal sessions from 7 Healthy Controls (HC) and 21 PD patients) and two
collected in-the-wild under free living conditions (37 meals from 4 HC/10 PD patients and 629 meals
from 3 HC/3 PD patients, respectively). Experimental results reveal an Area Under the Curve (AUC) of
0.748 for the clinical dataset and 0.775/1.000 for the in-the-wild datasets towards the classification
of in-meal eating behavior profiles to the PD or HC group. This is the first work that attempts to use
wearable Inertial Measurement Unit (IMU) sensor data, collected both in clinical and in-the-wild
settings, towards the extraction of an objective eating behavior indicator for PD.
Parkinson’s disease (PD) is a complex neurological disorder, associated with a number of motor and non-motor
symptoms (NMS) such as tremor, bradykinesia, rigidity, problems with manual dexterity, micrographia, cogni-
tive issues, sleep abnormalities and depression1. Regardless of PD being incurable, early diagnosis can have a
huge impact on the progression of the disease, the patient’s quality of life2,3 as well as from a socioeconomic
standpoint4,5. At the same time, PD diagnosis suffers from high misdiagnosis r ates6,7. In spite of improved scales
1
Multimedia Understanding Group, Information Processing Laboratory, Department of Electrical and Computer
Engineering, Aristotle University of Thessaloniki, Thessaloniki, Greece. 2Innovative Use of Mobile Phones to
Promote Physical Activity and Nutrition Across the Lifespan (the IMPACT) Research Group, Department of
Biosciences and Nutrition, Karolinska Institutet, Stockholm, Sweden. 3King’s College Hospital and King’s College,
London, UK. 4Department of Neurology, Technical University Dresden, Dresden, Germany. *email: kokirits@
mug.ee.auth.gr
Scientific Reports | (2021) 11:1632 | https://doi.org/10.1038/s41598-020-80394-y 1
Vol.:(0123456789)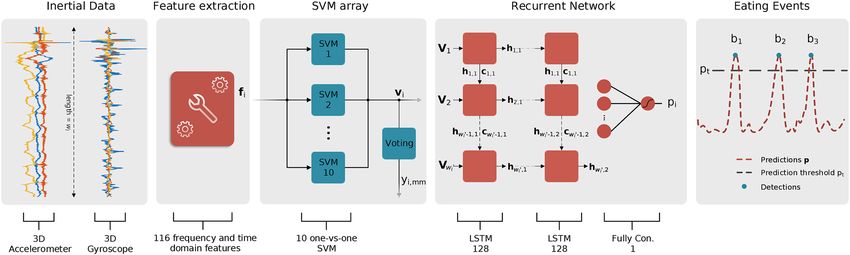
www.nature.com/scientificreports/
and diagnostic criteria for PD8, the process is largely subjective and an objective diagnostic tool remains an
unmet need.
Over the years, a number of works have associated PD with variations in eating b ehavior9–11. Such varia-
tions encompass body weight alterations10,12,13, binge eating11,14,15 and m
alnutrition16, indicators that are often
overlooked17. It should be noted that despite the large interest shown towards the eating behavior dimension of
PD, only a limited amount of studies attempt to measure such effects objectively. In a recent study, researchers
attribute the alteration of eating patterns to levodopa18, one of the main medications provided to PD patients.
Whichever the cause of eating behavior variations may be, the comorbidity of weight loss and malnutrition can
lead to increased frailty19, reduced immune function20 and synergize against the life quality of the PD patient16,21.
The Unified Parkinson’s Disease Rating Scale (UPDRS) is the most widely used and tested scale22. The scale
consists of four components. Parts I and II deal with non-motor and motor experiences of daily life respectively,
Part III is the motor examination and Part IV concerns with motor complications. It should be emphasized
that Part II is designed to be a self-administered questionnaire and as a result it does not require input from the
investigator23. Out of all the items in the UPDRS, only two are directly related to eating activities, one is swal-
lowing (i.e., dysphagia) and the other is cutting food and handling utensils, with both of them belonging to Part
II. Consequently, recent studies show that dysphagia can be under-diagnosed due to lack of objective tools and/
or poor self-awareness24.
In this paper, we investigate how the eating behavior and the microstructure of meals can be used as an objec-
tive indicator for PD. This is achieved by measuring the upwards hand movements that occur before each food
intake moment (i.e., bite) during the course of a meal. Towards this, we introduce Plate-to-Mouth (PtM). More
specifically, the PtM indicator is defined as the time spent for the hand operating the utensil (fork or spoon)
to transfer a ready-to-be-consumed quantity of food from the plate upwards into the mouth. However, in order
for such spoonful to be considered as ready-to-be-consumed, two preconditions must be fulfilled. Initially, the
utensil has to be loaded. In addition, the eater does not further interact and/or alter the weight or the shape of
the spoonful in a voluntary fashion. Food deductions caused by misplacing food on top of the utensil or due to
other involuntary factors are allowed. Contribution to the bite’s PtM begins by moving the hand operating the
utensil upwards with the intention of placing food into the mouth. Upwards hand movements that do not aim at
placing food into the mouth, such as upwards movements that may occur during social meals, do not contribute
towards the calculation of the bite’s PtM.
In order to approximate PtM, we propose a two stage method that makes use of the 3D acceleration and ori-
entation velocity signals of a typical smartwatch. The first part of the method deals with the recognition of wrist
micromovements that occur during the course of a meal (pick food, upwards, mouth, downwards, no movement)
using a Support Vector Machine (SVM) array. Additionally, by modeling the temporal evolution of the recognized
wrist micromovements the meal’s bite moments can be detected by means of a Recurrent Neural Network (RNN)
with two Long-Short Term Memory (LSTM) cells. In the second part of the algorithm the detected upwards
micromovements and bite moments are processed using signal processing techniques and the final PtM periods
are obtained. Experimental results are presented using three different datasets, one collected in the clinic under
controlled conditions (EBePa-at-Clinic) and two collected in-the-wild under free-living conditions (EBePa-at-
Home and SData-at-Home), that contain meal sessions from PD patients and healthy controls (HC).
The path leading to the work presented herein was paved by two recent studies of our group25,26. Both studies
investigated eating behavior variations in the PD population using data collected in a controlled clinical set-
ting; one using manual video annotations and food weight m easurements25 to objectively measure differences
in energy intake between HC, early and advanced-stage PD patients, and one using smartwatch sensor d ata26
presenting a less refined version of the PtM indicator. To this day, this is the first study that attempts to use wear-
able Inertial Measurement Unit (IMU) sensor data collected both under controlled conditions and in-the-wild
towards the extraction of an objective eating behavior-related indicator for PD.
The rest of the paper is organized as follows. In "Related work" section we present a review of the relevant
literature regarding the objective measurement of PD symptoms using sensors. An in-depth presentation of the
proposed PtM extraction algorithm is provided in "Methods" section. Next, the "Evaluation" section presents
the performed experiments. A detailed description of the used datasets is presented in the "Datasets" section.
Sections "Results" and "Discussion", present and discuss the obtained results, respectively. Finally, the paper
concludes with "Conclusions" section.
Related work
A great amount of studies exist in the literature that deal with the detection of PD motor and non-motor symp-
toms in an objective fashion under clinical or controlled settings. Such works use a variety of sensors (e.g.,
cameras, IMU and microphones) to investigate tremor m anifestations27,28, dyskinesia29, speech i mpairment30,31,
32 33–36
gait and sleep d isorders .
The recent boom in the commercial portable and wearable devices enabled the research community to
develop unobtrusive solutions for PD capable of obtaining objective measurements in-the-wild (i.e., outside
of controlled clinical environments)37,38. For example, the works of Papadopoulos et al.39,40 showcase a method
towards the detection of tremorous episodes using the 3D acceleration information captured from a typical
smartphone during voice calls. The authors mention the label uncertainty problem and suggest a deep Multiple
Instance Learning Convolutional Neural Network (MIL-CNN) as a solution. The problem of label uncertainty
in-the-wild has also been raised in another work41 that deals with the detection of dyskinesia using off-the-shelf
smartwatches. The recent studies presented by Iakovakis et al.42,43 also use typical smartphones as the sensing
platform. More specifically, the authors analyze the patterns that emerge from the finger interaction with the
touchscreen during natural typing to detect decline of fine motor skills. Besides using information gathered
Scientific Reports | (2021) 11:1632 | https://doi.org/10.1038/s41598-020-80394-y 2
Vol:.(1234567890)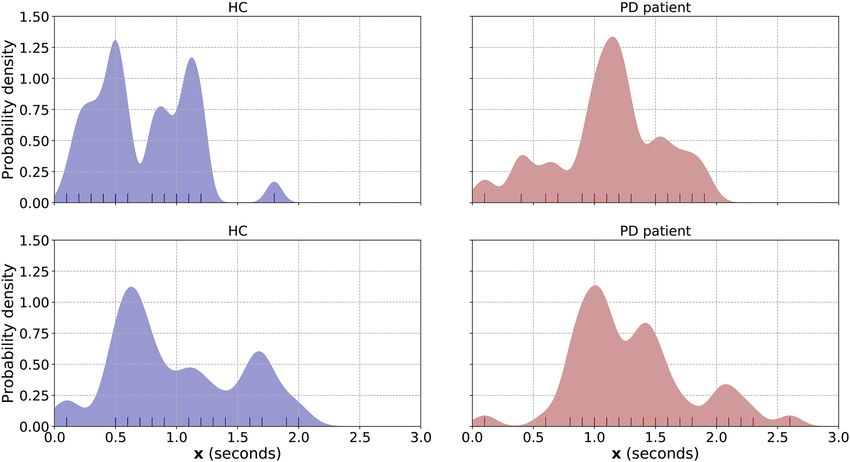
www.nature.com/scientificreports/
in-the-wild, one additional constant among the studies mentioned above is that they first extract indicators that
describe the targeted PD symptom (e.g., tremor) and then use Machine Learning (ML) approaches in order to
classify subjects to the PD or HC populations.
Despite the large number of studies that deal with the detection of PD motor symptoms, only a limited amount
of works investigate the alterations of eating behavior in PD patients. In an early study published in 1989, Athlin
et al.44 analyzed video recordings in order to examine the deviant eating behavior in elderly PD patients between
the ages of 62 and 83. Their study of 24 subjects (10 demented and 14 non-demented) revealed problems in the
eating tasks of: (1) handling food on the plate, (2) transporting food into the mouth, (3) manipulating food
into the mouth and (4) swallowing. In more detail, regarding the transportation of food from the plate into the
mouth, the authors observed many instances where the patients spilled food from the utensil while mid-air due
to tremor. Additionally, cases of “undershooting” (i.e., utensil not reaching the mouth) and patients not inclin-
ing their head to meet the approaching utensil were noted. Finally, the hand-arm movement responsible for
transferring food from the plate to the mouth was performed stepwise or had to be adjusted. The early work of
Athlin may be among the first that initially identified the issue; however, the descriptive analysis and the small
sample size do not allow for any concrete conclusions.
In our previous w ork25, we rekindled the topic of experimentally investigating eating behavior alterations
in PD patients. We used an extended, video-only, version of the EBePa-at-Home (EaC) dataset that contains a
total of 64 subjects, out of whom 23 were HC, 20 were early-stage PD patients (ESPD) and 21 were advanced-
stage PD patients (ASPD). It should be noted that the analysis was based solely on manual video annotations
(no IMU sensor data) and without any knowledge of wrist micromovements (e.g., upwards). Similar to the EaC
data collection protocol, participants initially underwent clinical evaluations and then freely consumed a stand-
ardized meal in a controlled setting in front of two cameras. The food was weighted pre-/post-meal in order to
calculate EI. The study focused towards the investigation of differences in objectively-measured energy intake
(EI) between the HC, ESPD and ASPD populations. In the experimental section, we reported that ASPD have
significantly lower energy intake than ESPD and HC, thus indicating an increased risk for weight loss. Addi-
tionally, the lower EI among ASPD versus HC could be explained (by 86%) due to: (1) higher upper extremity
tremor scores, (2) increased subjectively reported eating problems, as well as dysphagia, and (3) performing
fewer spoonfuls during the meal. Finally, eating problems, dysphagia and the number of performed spoonfuls
could explain approximately half of the observed lower energy intake among advanced versus early-stage PD
patients. The work concluded by suggesting that an improvement to the nutritional status of PD patients can
lead to an improved quality of life.
Methods
In this section we will present the process of extracting a meal’s Plate-to-Mouth (PtM) periods using the 3D
acceleration and orientation velocity signals that originate from a typical smartwatch. The PtM periods extraction
is achieved in two steps. In the first step we use an SVM array and an RNN to detect all hand micromovements,
model their temporal evolution within the meal and detect the food intake moments (i.e., bites). A number of
five micromovement categories are used to model food intakes, more specifically, pick food (“p”), upwards (“u”),
mouth (“m”), downwards (“d”) and no movement (“n”). In the context of this work, we will solely focus on the
“u” micromovements. In the second step, we process the detected bite moments and “u” micromovements using
signal processing techniques with the aim of obtaining the meal’s PtM periods.
Data pre‑processing. Formally, a meal session will be represented by the sensor data matrix
S = [ax , ay , az , gx , gy , gz ], with dimensions N × 6. The length of S is defined as N = t fs , where t is the total
duration of the meal in seconds and fs the sensor sampling frequency in Hz. The vectors ax , ay , az , gx , gy and
gz correspond the triaxial acceleration and gyroscope sensor measurements, respectively. To deal with sensor
noise, each sensor stream was smoothed using a 5th order median filter. Moreover, since the acceleration sensor
captures the earth’s gravitational field in addition any hand movement, we convolved the acceleration sensor
streams (ax , ay and az ) using a high-pass Finite Impulse Response (FIR) filter with a 512 tap delay line and a
cutoff frequency of 1 Hz.
Upwards micromovement and bite moment detection. In order to detect the bite and upwards
micromovement moments we follow the approach published in a previous work of o urs45. The process begins by
using a sliding window of length wl = 0.2 fs and step ws = 0.1 fs samples (i.e., with 50% overlap) to extract frames
from the sensor data matrix S. A total of K = ⌊(N − wl )/ws ⌋ frames are extracted, each with dimensions equal
to wl × 6. Subsequently, from each of the i = 1, 2, . . . , K frames we derive L temporal and frequency domain fea-
tures, effectively transforming the N × 6 sensor data matrix S into the K × L feature matrix F. In more detail, for
each of the sensor streams we calculate the mean, standard deviation, variance, minimum and maximum values,
range of values, zero crossing rate, energy and the first (wl /2) + 1 Discrete Fourier Transform
wl (DFT) coefficients.
In addition, for each sensor we calculate the simple moving average given by w1l i=1 |x(i)| + |y(i)| + |z(i)|,
where x(i), y(i) and z(i) correspond to the ith sample of x, y and z streams in a single frame.
Following our previous approach45, we address the multiclass, micromovement recognition problem by
employing an array of ten binary, one-versus-one SVM classifiers. The number of the one-versus-one classifiers
results from c (c − 1)/2, where c indicates the total number of c lasses46; in the context of this work c = 5 (pick
food, upwards, mouth, downwards and no-movement), resulting to a total of ten binary classifiers. In essence,
the one-vs-one approach splits the multiclass classification problem into one binary problem for each possible
pair of classes; e.g., pick food versus upwards, mouth versus downwards, etc. All binary SVM classifiers use
the Radial Basis Function (RBF) kernel. By processing each of the K feature vectors of matrix F using the SVM
Scientific Reports | (2021) 11:1632 | https://doi.org/10.1038/s41598-020-80394-y 3
Vol.:(0123456789)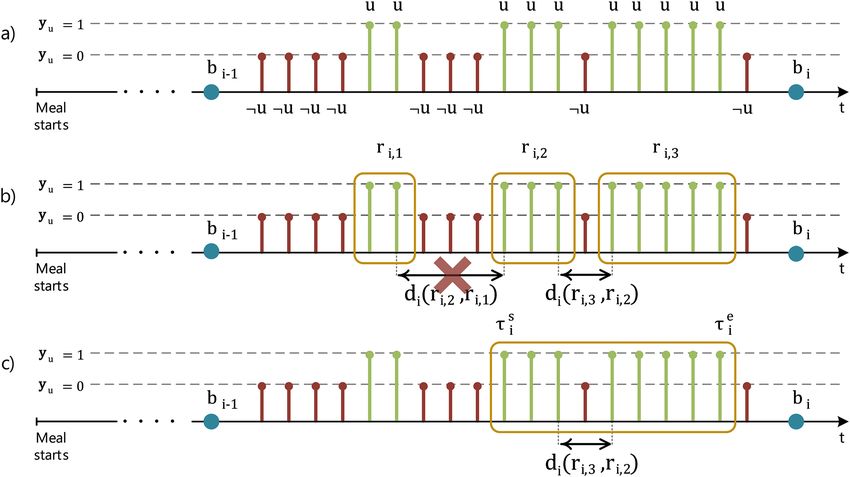
www.nature.com/scientificreports/
Figure 1. Figure depicting the overall pipeline of the micromovement recognition/bite detection part of
the algorithm. From left to right, the windowed 3D accelerometer and gyroscope streams of length wl are
transformed into the 116-dimensional feature vector fi. Next, using an array of ten one-versus-one SVM the
feature vector fi is transformed into the 10-dimensional SVM prediction score vector vi. By applying a voting
scheme to the one-vs-one scores of the ten SVM (i.e., to the vi vector) we obtain yi,mm which indicates the
micromovement label that corresponds to the ith window. Processing of additional sensor windows leads to the
creation of the meal’s SVM score matrix V and label vector ymm. Furthermore, by processing windows of V with
length wl′, the RNN outputs the probability pi that the given window sequence is a food intake cycle. Variables
hi,j and ci,j are used to represent the ith hidden output and cell state of the jth LSTM layer, respectively. The
rightmost part of the figure illustrates the local maxima search in the meal’s prediction vector p. Variables b1, b2
and b3 represent three detected bites, while pt represents the prediction threshold.
array we obtain the K × 10 score matrix V . Each row of V contains the ten pairwise prediction scores from the
one-versus-one classifiers. Subsequently, each of the ten scores corresponds to the sample’s (i.e., feature vector)
distance from the separating hyperplane formed by each of the ten binary SVM classifiers. Furthermore, by apply-
ing the max wins voting s cheme46 to each of the rows of V we obtain the K × 1 micromovement label vector ymm.
Bite moment detection is achieved by modeling the temporal evolution of micromovements using an RNN.
More specifically, the proposed RNN architecture consists of two Long-Short Term Memory (LSTM) layers,
followed by a fully connected layer with a single neuron. Both LSTM layers of the network use 128 hidden
cells. The bite moment detection process begins by extracting frames from the micromovement score matrix
V using a sliding window of length wl′ = 3 fs and step ws′ = 0.2 fs samples. Using this sliding window, a total of
K ′ = ⌊(K − wl′ )/ws′ ⌋ + 1 frames are extracted, each with dimensions wl′ × 10. The extracted frames are then
propagated to the RNN and the K ′ × 1 probability vector p is obtained. The RNN network is trained using as
positive samples the micromovement sequences that start with “p”, end with “d” and contain an “m” event and
as negative samples all other sequences. Therefore, each of the i = 1, 2, . . . , K ′ elements of p indicates the prob-
ability that the ith input frame is a food intake event. Prior to the bite moment detection, the probability vector
p is thresholded using a threshold pt . More specifically, all elements of p that are less than pt are replaced with
zeros. We selected pt to be equal to 0.89 as proposed by a number of previous works from our g roup45,47–49. Finally,
the set of detected bite timestamps B = {b1 , b2 , . . . , bU }, with U ∈ Z+ indicating the cardinality of B (i.e., the
number of detected bites), is obtained by performing a local maxima search in p using a minimum distance
of 3 fs samples between consecutive peaks. Figure 1 illustrates the processing pipeline regarding the upwards
micromovement and bite moment detection part of the proposed algorithm.
Plate to Mouth duration extraction. The extraction of a meal’s PtM durations begins by transforming
the micromovement label vector ymm into the binary vector yu. This is achieved by replacing with zeros the ele-
ments of ymm that belong to the “p”, “m”, “d” and “n” classes and with ones the elements that belong to the “u”
class. Essentially, yu is non-zero in the parts of the meal where the wrist wearing the smartwatch performs an
upwards movement and zero everywhere else.
The PtM durations of a meal are calculated for all inter-bite intervals, i.e., the periods between two consecutive,
detected, bites. The first inter-bite interval is considered as the period between the beginning of the meal and the
moment of the first detected bite, i.e., the interval [0, b1 ]. PtM calculation continues by extracting the subset yi,u
of the elements of yu with timestamps that are within the limits of the ith inter-bite interval, denoted by [bi−1 , bi ].
Moreover, we will use the term u-region to represent a cluster of, one or more, consecutive non-zero elements in
yu. The jth u-region for the ith inter-bite interval can be described by it’s start and end moments ri,j = [ti,j s , t e ].
i,j
Given yi,u we extract the set of u-regions Ri = {[ti,1 s , t e ], . . . , [t s
i,1 , t e
i,D−1 i,D−1 ], [t s , t e ]} = {r , . . . , r
i,D i,D i,1 i,D−1 , ri,D },
with D ∈ Z+ indicating the cardinality of the Ri set. Since there is no overlap between the u-regions of the set,
the elements of Ri are sorted in an ascending fashion given their starting moments. Starting at the final u-region
ri,D we search backwards in an attempt to merge it with the previous u-region ri,D−1 of the Ri set. The merge is
successful if the distance between the two u-regions, calculated as di (ri,D , ri,D−1 ) = ti,D s − te
i,D−1, is lower than
a threshold d . The merging process continues until: (1) we have merged all u-regions in the Ri set (i.e., there
are no more u-regions to merge in the ith inter-bite interval), or (2) a merge was not successful (i.e., distance
between the two u-regions was greater than d seconds). For the experiments presented in the "Results" section,
Scientific Reports | (2021) 11:1632 | https://doi.org/10.1038/s41598-020-80394-y 4
Vol:.(1234567890)www.nature.com/scientificreports/
Figure 2. Example showcasing the steps towards the calculation of the PtM duration. In the first step (a) the
subset yi,u is presented for the inter-bite interval [bi−1 , bi ]. Bite timestamps bi−1 and bi are represented as blue
circles. The green stems marked with u symbolize the upwards moments, while the red stems marked with ¬u
signify the non-upwards moments. In the following step (b) the set of u-regions Ri = {ri,1 , ri,2 , ri,3 } is formed
and the distances di (ri,3 , ri,2 ) and di (ri,2 , ri,1 ) are calculated. For this example we will use the × symbol to indicate
that di (ri,2 , ri,1 ) is greater than the d threshold and therefore, that merge is considered unsuccessful. As a result,
the number of consecutive successful merges Ji equals to one. The last step (c) presents the temporal positioning
of the τis and τie moments. Finally, duration PtMi is given by τie − τis − di (ri,3 , ri,2 ).
we selected d to be equal to 0.5 s. We support this choice as it approximates the median duration (0.483 s) of
non-upwards movements that occur between upwards movements that contribute to the bite’s PtM, according
to the video GT of the EaC dataset.
We select as τie the ending moment of the last u-region in the Ri set (i.e., ti,D
e ). Subsequently, given the num-
ber of consecutive successful merges Ji , we set as τi the starting moment of the last-merged u-region, ti,D−J
s s . In
essence, the moment τis corresponds to the timestamp at the beginning of the upwards motion, when the wrist
operating the utensil begins transferring food towards the mouth area to perform bite bi . Additionally, τie cor-
responds to the timestamp at the end of the upwards wrist motion, prior to placing food into the mouth. Finally,
the PtM period for the ith inter-bite interval [bi−1 , bi ] can be calculated using the formula below.
PtMi = τie − τis = ti,D
e s
− ti,D , if Ji = 0 (1a)
J
J
PtMi = τie − τis − e
di (rD−j+1 , rD−j ) = ti,D s
− ti,D−J − s
(ti,D−j+1 e
− ti,D−j ), if Ji > 0 (1b)
j=1 j=1
PtM extraction is repeated for all possible U inter-bite intervals, [0, b1 ], [b1 , b2 ], . . . , [bU−1 , bU ], in a given
session. It should be noted that PtM extraction for the inter-bite interval i may be discarded if the distance
between τie and bi is greater than a threshold b , or not completed at all if Ri = {∅}. Experimentation with
a small part of the EaC dataset allowed us to select 5 s as the value for b ; however, this parameter has mini-
mal effect. At the end of the process the set of the PtM periods for the meal is created, formally defined as
P = {PtM1 , PtM2 , . . . , PtMU ′ }, with U ′ ≤ U . Figure 2 presents a visual example towards the calculation of the
PtM duration for a given inter-bite interval.
Subject‑level Plate‑to‑Mouth representation. Given Q = {S1 , S2 , . . . , SP }, with P ∈ Z+ indicating
the total number of meals originating from a single individual, subject-level representation is achieved in the
following fashion. Initially, each of the i = 1, . . . , P sensor meal matrices Si is transformed into PtM period set
Pi , and the set Q takes the following form: {P1 , P2 , . . . , PP }. By unfolding each of the meal PtM period sets Pi
we obtain the final vector x = [PtM1,1 , PtM1,2 , . . . , PtM1,U1′ , . . . , PtMP,1 , PtMP,2 , . . . , PtMP,UP′ ] with length lx
Scientific Reports | (2021) 11:1632 | https://doi.org/10.1038/s41598-020-80394-y 5
Vol.:(0123456789)www.nature.com/scientificreports/
Figure 3. Figure depicting the subject level representations xf for two HC (left column, blue) and two PD
patients (right column, red). The vertical lines at the bottom of each figure denote the elements of x (all PtM
durations from every meal of the participant) that where used to estimate the PDF in each case. Finally, the
calculated bandwidths ĥx for the HC are 0.064 (top) and 0.120 (bottom), while for the PD patients are 0.092
(top) and 0.095 (bottom).
given by Pi=1 Ui′ . Each of the PtMj,i elements of x corresponds to the PtM duration of the ith bite belonging to
the jth meal of the individual.
The subject-level representation is given by initially estimating the underlying Probability Density Function
(PDF) of x by means of Kernel Density Estimation (KDE). The PDF is estimated using a Gaussian kernel and a
bandwidth ĥ calculated using Silverman’s rule of thumb50 presented below:
R̂x
ĥx = 0.9 min σ̂x , l −1/5 (2)
1.34 x
where σ̂x and R̂x are the variance and interquartile range (IQR) estimates of x.
Finally, the subject-level representation xf is given by evaluating the estimated PDF for a total of lf = 50
points, equally-spaced in the interval between [0, 3] s. Figure 3 presents four indicative subject-level representa-
tion ( xf ) examples.
Datasets
In the scope of this study we investigated the performance of the PtM indicator in three datasets, one collected in
a controlled, in-the-clinic, environment and two collected in-the-wild. We will use the term in-the-wild to refer
to uncontrolled settings that are outside of the clinic (e.g., private residences). All datasets were collected within
the sphere of the i-PROGNOSIS Project (additional information is available online at: http://www.i-prognosis.
eu), an H2020 EU-funded collective effort towards the early detection of Parkinson’s disease using commercial
handheld and wearable devices. The EaC and EaH datasets were collected during the more exploratory EBePa
study of the project, while SaH was collected during the main SData study. All subjects signed an informed
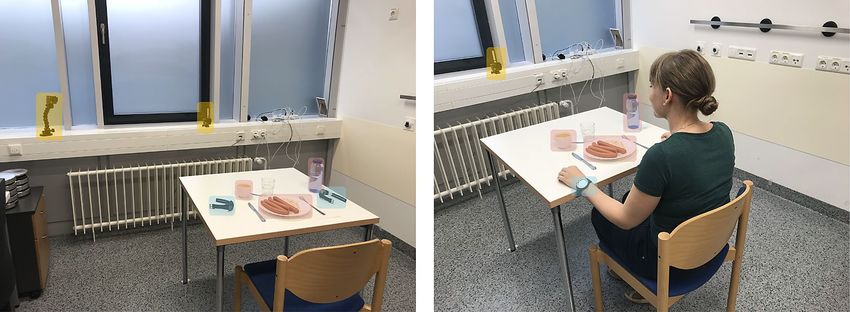
consent prior to their participation. The researcher that appears in Fig. 4 signed an informed consent regarding
the publication of her image in an online open-access journal. In addition, the recruitment and experimental
procedures were performed according to the institutional and international guidelines on research involving adult
human beings. The EaC and EaH data collections have been approved by the ethical committee of the Technical
University Dresden (TUD) in Germany (EK75022018), while the SaH collection has been approved by the ethi-
cal committees of the King’s College Hospital in the UK (18/LO/0074) and TUD in Germany (EK451112017).
All study participants have been investigated for baseline characteristics including general medical as well as PD
specific history and medication intake. Furthermore in all study participants, PD patients and HC, an UPDRS
assessment in medical ON condition has been performed by movement disorders specialists as well as PD spe-
cific validated scales and questionnaires were used to comply with the diagnostic criteria for P D8. Hereby the
diagnosis of PD or healthy was provided to each study participant by movement disorders specialists as gold
standard. On a more technical note, both the EaC and EaH IMU signals were recorded using the same software
that was developed by our group while the main i-PROGNOSIS application was used to collect the IMU signals
in SaH. Finally, the Huawei watch 2 was used to capture the 6 (Degrees of Freedom) DoF IMU signals at a rate
of 100 Hz in all three datasets.
Scientific Reports | (2021) 11:1632 | https://doi.org/10.1038/s41598-020-80394-y 6
Vol:.(1234567890)www.nature.com/scientificreports/
Figure 4. Figures depicting the EaC experiment setup. The picture on the left-hand side highlights the position
of the two cameras (yellow). On the right picture, the researcher showcases the position of the smartwatch on
the wrist (blue). In both pictures, the contents of the standardized meal are marked (red).
Dataset EaC EaH SaH
Population HC PD HC PD HC PD
Subjects (N) 7 21 4 10 3 3
Age (a/s) 59.42/5.77 66.14/8.11 61.75/7.49 65.20/8.25 63.66/13.19 60.33/11.26
Gender (m/f) 2/5 12/9 1/3 6/4 1/2 1/2
Num. of meals
1.00/0.00/7 1.00/0.00/21 2.00/1.22/8 2.90/1.22/29 107.00/128.69/321 102/67.89/308
(a/s/t)
Num. of bites
33.14/7.31/232 39.52/15.64/830 31.25/7.86/257† 36.96/12.96/1072† 41.75/17.18/13,404† 57.63/18.75/17,752†
(a/s/t)
Meal duration sec
427/80/2989 568/262/11,936 632/158/5059 732/338/21,247 1256/509/403,304 991/361/305,270
(a/s/t)
PD medication
– 16/5 – 8/2 – 1/2
intake (y/n)
PD stage (early/
– 9/12 – 5/5 – 1/2
advanced)
Table 1. Table presenting the technical and demographical information from the three datasets that were used
in the scope of this work—namely, EaC, EaH and SaH. For each one of the datasets, information is provided
regarding the PD and HC populations separately. It should be noted that in the case of in-the-wild datasets
(EaH and SaH) no ground truth (GT) information exists in terms of number of bites. For the purpose of
completion, we provide this information on calculations based on the number of detected bites (signified by the
† symbol next to the cell). Meal duration is calculated as the difference of the timestamps between the last and
the first bite (GT bites for EaC and detected bites for the in-the-wild datasets). Finally, the notation a/s/t is used
to signify average/standard deviation/total, a/s for average/standard deviation, y/n for yes/no and m/f for male/
female.
In‑the‑clinic dataset. The clinical dataset, named EBePa-at-Clinic (EaC), was collected at the Department
of Neurology of the Technical University Dresden (TUD) in Germany. The EaC dataset contains a total of 28 meal
sessions from 28 subjects (i.e., one meal per subject). Out of the 28 subjects, 7 are HC and 21 are PD patients. For
the data collection, participants were invited to the Department of Neurology of TUD to eat a provided stand-
ardized meal in a quiet room dedicated to the experiment around their usual lunch time (11:00–15:00) during a
weekday. The meal included 200 g of pre-heated sausages, 400 g of cold potato salad, 200 g of apple puree and a
bottle containing 500 ml of water to drink during the meal freely, a representative German meal.
Prior to commencing the meal, subjects were asked to wear two smartwatches, one on each wrist, and per-
form a single hand clapping motion in order to synchronize the video and inertial streams. Video capturing was
achieved by using two Gopro Hero 5 cameras, one with a frontal and one with an angled viewpoint. No other
specific instructions were given to the subjects, apart from notifying the supervising researchers when they have
finished their meal. Participants were free to eat and drink as much as they wanted, at their own pace and with-
out time constrains. Video recordings were analyzed independently in two different centers (AUTH and KI) to
provide bite GT information (true timestamps of bite events) as well as the start and end points of upwards hand
motions that lead to a bite. The EaC dataset sums to over 4 h of IMU recordings with a total of 1062 performed
bite events (according to the video GT). Detailed technical information about the EaC dataset and the subject
demographics can be found in Table 1, while Fig. 4 depicts the clinical experiment setup.
Scientific Reports | (2021) 11:1632 | https://doi.org/10.1038/s41598-020-80394-y 7
Vol.:(0123456789)www.nature.com/scientificreports/
In‑the‑wild datasets. In addition to the clinical data (EaC dataset in section "In-the-clinic dataset") we
also collected two datasets from in-the-wild settings, namely EaH and SaH.
The EBePa-at-Home (EaH) dataset is the in-the-wild extension of the EaC dataset. More specifically, the
majority of EaC participants were given a smartwatch to take home for seven days, and to wear it on the wrist of
the hand that they use to operate the spoon/fork during their main warm meals. The intersection between EaH
and EaC datasets (i.e., EaH ∩ EaC) is 12 participants (3 HC and 9 PD patients), which corresponds to a Jaccard
Index (JI) of 0.4. Out of the 14 participants in EaH, 4 are HC and 10 are PD patients. In total, EaH contains 37
meal sessions summing up to a total duration of more than 7 h of IMU recordings.
As already mentioned, SData-at-Home (SaH) was collected as part of a different study within i-PROGNOSIS.
As a result of this, no overlap exists between SaH and either the EaC or EaH. In more detail, SaH contains meal
recordings from 6 participants, 3 HC and 3 PD patients. Despite of containing less subjects than the EaH or
EaC counterparts, the SaH dataset incorporates significantly more meals, as the smartwatches were provided for
approximately 3 months. In particular, SaH contains a total of 629 sessions. The total duration of IMU recordings
in SaH is approximately 200 h.
In both in-the-wild datasets, the subjects were instructed to wear the smartwatch on the wrist of the hand that
they use to operate the spoon/fork and enable data recording prior to the beginning of the main meal. Participants
were instructed to disable the recording process after they finished eating. No other instructions were given and
the participants were free to eat their meal of preference, at their own pace. Detailed technical information about
the EaH and SaH datasets and their subject demographics can be found in Table 1.
Evaluation
In addition to the EaC/EaH and SaH datasets, we make use of the, previously collected and analyzed, external
Food Intake Cycle (FIC) dataset in order to train the SVM array and the RNN that are responsible for the recogni-
tion of micromovements and the modeling of their temporal evolution, respectively. The FIC dataset contains the
3D acceleration and orientation velocity signals from 21 meal sessions from 12 HC. Meals were recorded under
realistic conditions in the cafeteria of the Aristotle University of Thessaloniki using commercial smartwatches.
More specifically, the Microsoft band 2 was used to record ten out of the twenty-one meals (at a rate of 62 Hz) and
the Sony smartwatch 2 for the remaining meals (at a rate of 200 Hz). Based on the supporting videos, FIC also
includes detailed annotations regarding wrist gestures (e.g., wrist moving upwards) and the exact bite moments.
The total number of annotated food intake cycles (i.e., bite events) in FIC sums to 1332. It should be emphasized
that there is no overlap between the subjects of the FIC and the EaC, EaH and SaH datasets. In depth information
about the FIC dataset can be found in a previous work of our group47.
The extraction of a meal’s PtM durations depends heavily on the first part of the proposed algorithm, i.e., the
upwards micromovement and bite moments detection. This is because the meal’s PtM durations are calculated
independently for all inter-bite intervals. As a result, for the first experiment (EXI) we evaluate the bite detec-
tion effectiveness in a train/test split fashion. More precisely, we use the EaC dataset as the test set and the FIC
dataset as the train set.
Goal of the next experiment (EXII), performed in the EaC dataset, is to evaluate the quality of the smart-
watch-extracted PtM durations. More specifically, in EXII we compare the PtM durations as extracted by the
proposed method using the smartwatch 6 DoF IMU data, against the PtM durations that are extracted by manual
ground truth annotation produced by two independent researchers analyzing the meal videos.
In the third series of experiments (EXIII) we evaluate the performance of the proposed method and specifi-
cally, how well the extracted subject-level PtM indicator can discriminate between the eating behavior of PD
and HC. The diagnosis of PD or HC was provided by movement disorders specialists during clinical evaluations
based on a standardized protocol. In every experiment under EXIII we follow a Leave-One-Subject-Out (LOSO)
cross-validation scheme, meaning that in each repetition of the experiment we use the data of all but one subject
as the training set and the left-out subject as the test set. The experiment ends when all subjects in the dataset
have been left-out once. In more detail, we performed four LOSO experiments to evaluate the performance of
the proposed subject-level indicator. Experiments EXIII-A and EXIII-B make use of the EaC and EaH datasets,
respectively. For EXIII-C we use the dataset that result from the intersection of subjects between EaC and EaH
(i.e., EaC ∩ EaH). Finally, for EXIII-D we employ the SaH dataset.
Results
For all experiments, we selected d to be equal to 0.5 s. We support this choice as it approximates the median
duration (0.483 s) of non-upwards movements that occur between upwards movements that contribute to the
bite’s PtM, according to the video GT of the EaC dataset. In addition, experimentation with a small part of the
EaC dataset allowed us to select 5 s as the value for b ; however, this parameter has minimal effect. Finally, in
order to deal with the incompatibilities in the sensor sampling frequency among the different datasets (EaC,
EaH, SaH and FIC), all data were resampled to a constant rate of fs = 100 Hz.
Table 2 presents results of EXI in the form of a confusion matrix. Essentially, the confusion matrix reflects the
performance of the micromovement and bite detection part of the algorithm when trained with a dataset that
solely contains HC (the FIC dataset) and evaluated using a dataset that contains a combination of HC and PD
patients. Performance metrics are produced by adopting the strict evaluation s cheme47 (representative examples
are depicted in Fig. 5) which allows for a single detected bite to be considered as true positive in a GT bite interval.
By using the number of True Positives (TP), False Positives (FP) and False Negatives (FN) we can calculate the
precision, recall and F1 metrics which are equal to 0.929, 0.975 and 0.952, respectively. It should be noted that it
is critical to obtain satisfactory results in EXI as the estimation of the PtM indicator (and as a result the outcome
of all upcoming experiments) depends on the quality of the micromovement and bite moment detection.
Scientific Reports | (2021) 11:1632 | https://doi.org/10.1038/s41598-020-80394-y 8
Vol:.(1234567890)www.nature.com/scientificreports/
True bites
Positive Negative
Positive 1036 78
Predicted bites
Negative 26 N/A
Table 2. Confusion matrix depicting the bite detection performance of EXI using the EaC dataset. N/A
(i.e., Not Available) is used to indicate TN cannot be calculated using the adopted evaluation s cheme47; this
is depicted in Fig. 5. The total number of true bites in EaC is 1062 (sum of TP and FN). Given the confusion
matrix, the performance metrics precision/recall/F1 are calculated to be 0.929/0.975/0.952.
Bite detec on moment TP FP FN TP FP
Food intake cycle GT
t
Figure 5. Representative examples of the evaluation scheme47 that was used to produce the results in EXI. The
first bite within a GT interval counts as a True Positive (TP), any further detected bites count as False Positives
(FP). In addition, detected bites outside GT intervals also count as FP. Empty GT intervals without any detected
bites count as False Negatives (FN). It should be noted that the adopted evaluation method cannot calculate the
number of True Negatives (TN).
Figure 6. Comparison of the video and smartwatch-based extraction of Plate-to-Mouth durations (n = 1036)
in the context of EXII (EaC dataset). The normalized superimposed histograms (left) and box plots (right)
showcase the large overlap between the two distributions. Regarding the left figure, the dark blue color
represents the overlap between the two histograms.
Given the fact that bite detection performance is not flawless (this is reflected in Table 2), the direct, one-
versus-one, comparison of the smartwatch-based and video-based PtM durations is not feasible. For this reason,
we performed EXII using the PtM durations for the n = 1036 bites (i.e., the number of TP from Table 2) that
are correctly classified. As a result, the Mean Squared Error (MSE) and the Mean Average Error (MAE) where
found to be 0.214 and 0.310 s, respectively. Figure 6 depicts the video and smartwatch-based PtM duration
distributions. The Pearson’s correlation coefficient for the GT annotations between the two independent raters,
indicating the inter-rater agreement, was r = 0.902 (with ρ < 0.001) for average meal-level PtM durations and
r = 0.755 (with ρ < 0.001) for one-versus-one bite-level PtM durations.
Scientific Reports | (2021) 11:1632 | https://doi.org/10.1038/s41598-020-80394-y 9
Vol.:(0123456789)www.nature.com/scientificreports/
Figure 7. Figure presenting the ROC curves (1-specificity against sensitivity) for the four experiments under
EXIII. The obtained AUC metrics are also provided in the bottom right corner of each sub-figure. The presented
ROC curves illustrate how well the extracted subject-level PtM indicator can be used to discriminate between
the eating behavior of PD patients and HC.
Operating Point Experiment Specificity Sensitivity (recall) Precision F1
EXIII-A 0.571 0.904 0.863 0.883
EXIII-B 0.500 1.000 0.833 0.909
Sensitivity ≥ 0.85
EXIII-C 1.000 0.888 1.000 0.941
EXIII-D 1.000 1.000 1.000 1.000
EXIII-A 0.857 0.476 0.909 0.625
EXIII-B 1.000 0.500 1.000 0.667
Specificity ≥ 0.85
EXIII-C 1.000 0.888 1.000 0.941
EXIII-D 1.000 1.000 1.000 1.000
Table 3. Table aggregating the results from the series of experiments under EXIII; essentially, how well the
subject-level PtM indicator can be used to discriminate between the PD and HC populations. The obtained
results are presented in two operating points, one requiring high sensitivity (upper half) and one requiring
high specificity (lower half).
Having obtained satisfactory results from EXI and EXII, we proceed with the EXIII series of experiments. In
particular, experiments EXIII-A, EXIII-B and EXIII-D deal with the classification of eating behavior profiles to
the PD or the HC populations given the EaC/EaH/SaH datasets. We report an Area Under the Curve (AUC) of
0.748, 0.775 and 1.000 for EXIII-A, EXIII-B and EXIII-D, respectively. In EXIII-C we perform classification by
only taking into consideration the meals from the subjects that participated both in EaC and EaH (EaC ∩ EaH).
For EXIII-C we report an AUC of 0.926, which hints that a subject’s PtM-based eating behavior profile can be
more accurate if the subject has contributed more meals. Figure 7 depicts the Receiver Operating Characteristic
(ROC) curves, while Table 3 aggregates the obtained results and presents them in two different operating points,
one requiring high sensitivity (≥ 0.85) and one requiring high specificity (≥ 0.85). In all experiments under
EXIII, classification is achieved by using a binary SVM with the RBF kernel and regularization parameter C
equal to 1. The subject-level indicators that belong to PD patients constitute the positive class and the ones that
belong to HC the negative class. Furthermore, in order to resolve the imbalance between the two classes (HC and
PD) during training, for all experiments each class was proportionally weighted based on it’s prior probability.
Scientific Reports | (2021) 11:1632 | https://doi.org/10.1038/s41598-020-80394-y 10
Vol:.(1234567890)www.nature.com/scientificreports/
Figure 8. Box plots depicting (from left to right) how: (i) the duration of meals, (ii) the time between
consecutive bites, (iii) the number of bites and (iv) the PtM durations extracted from all inter-bite intervals, are
distributed to the PD and HC populations of the EaC dataset.
Discussion
There is a single UPDRS item which subjectively asks PD patients to evaluate their ability to use eating utensils.
This UPDRS part II item 9 covers different aspects of food handling such as speed, the ability to cut food, fine
motor skills and the need for assistance. As a consequence, it is a rough item which does not cover the differ-
ent aspects of food intake in detail neither separately. According to a recent study51, indices that are commonly
used to model and determine eating behavior are: (1) the meal duration, (2) the time between bites (i.e., eating
rate), and (3) the number of bites. Even though the meal duration, the eating rate and the number of bites can be
objectively measured, early experimentation using the EaC dataset revealed that those three metrics do not allow
for separation between the PD and HC populations. This is illustrated in Fig. 8. The figure showcases the large
overlap between the PD and HC populations regarding the meal duration, the time between consecutive bites
and the number of bites. It should be mentioned that despite the large overlap between the two populations in
the cases of meal duration and number of bites, the range of values for the HC population is much more narrow
than the PD one. In addition, the rightmost part of Fig. 8 demonstrates how the PtM durations extracted from
all inter-bite intervals differ between the two populations. More specifically, it can be seen that approximately
50% of the PtM durations that belong to the HC distribution are outside the Interquartile Range (IQR) of the PD
distribution. The methodology presented in this paper allows for the objective measurement of PtM, in clinical
and in-the-wild settings.
The obtained results presented in the "Results" section showcase the high performance of the proposed meth-
odology towards the classification of eating behavior profiles to the PD and HC populations. More specifically,
EXI results show that the food intake detection algorithm generalizes well on the EaC dataset (the only dataset
among EaC, EaH and SaH with video GT) when trained using the external, and non-overlapping, FIC dataset
(F1 score of 0.952). Since PtM is calculated for all inter-bite intervals within a meal, high performance of the food
intake detection part of the methodology is crucial in order to obtain reliable PtM estimates. Results from EXII
demonstrate that smartwatch-based PtM extraction approximates the video-based one, with an MSE/MAE of
0.214/0.310. Having obtained satisfactory results from EXI and EXII, we proceed with the EXIII series of experi-
ments. In particular, experiments EXIII-A/-B/-D deal with the classification of eating behavior profiles to the
PD or the HC populations given the EaC/EaH/SaH. We report an AUC of 0.748, 0.775 and 1.000 for EXIII-A,
EXIII-B and EXIII-D, respectively. In EXIII-C we perform classification by only taking into consideration the
meals from the subjects that participated both in EaC and EaH (EaC ∩ EaH). For EXIII-C we report an AUC
of 0.926, which hints that a subject’s PtM-based eating behavior profile can be more accurate if the subject has
contributed more meals.
In our previous w ork26 we introduced a less elaborate adaptation of the PtM indicator and performed experi-
ments using solely the EaC dataset. However, even the simpler version of the proposed indicator uncovered the
high potential of the initial idea. Early experimental results revealed an F1 score of 0.789 (compared to the 0.883
of the current approach presented in Table 3, high sensitivity operating point of EXIII-A) towards the correct
classification of eating behavior profiles to the PD or healthy population, using a simple one-dimensional optimal
threshold scheme (according to Otsu’s m ethod52).
Scientific Reports | (2021) 11:1632 | https://doi.org/10.1038/s41598-020-80394-y 11
Vol.:(0123456789)www.nature.com/scientificreports/
Both our previous26 and current work attempt to objectify the in-meal eating behavior of PD patients and
HC by extracting indicators using IMU sensor data originating from commercial smartwatches. The reasons
behind selecting the smartwatch as the sensor platform of choice is that modern wearable technologies, such
as smartwatches, are widely available and increasingly used by the general population. In addition, they require
minimal effort to wear and handle and do not raise suspicion as to being a medical monitoring device, thus
reducing social s tigma53. Distributed via application stores, an application could be made publicly available that
screens for alterations in eating behavior. This offers an opportunity to screen a large group of healthy individuals
who may manifest symptoms compatible with a diagnosis of prodromal PD. In addition to screening the general
population, alterations in eating behavior can be monitored, via remote sensing, in those with a PD diagnosis
using a continuous assessment approach during treatment. The methodology described in this study is capable
of monitoring the temporal evolution of eating behavior profiles, a largely neglected aspect of PD symptomatol-
ogy, and allow clinicians to keep track of the progression of this motor issue and indirectly monitor efficacy of
dopaminergic therapy as well as side effects.
A limitation of our approach is that in-the-wild meal recordings require input from the participants. Spe-
cifically, the participant needs to initiate and terminate data recording prior and after each meal. Such manual
collection configuration can lead to sparsity in the collected dataset. However, a past work of our group49 exploits
all-day IMU recordings and introduces a bottom-up method that uses the distribution of bites during the day
to effectively detect meal start and end moments. An additional limitation of the current method is that it can
exhibit unpredictable behavior when the subject performs drinking gestures or eats without the fork and/or the
spoon. This is attributed to not have introduced instances of eating with e.g., bare hands or chopsticks to the
SVM and LSTM mechanisms during the training process. Obtaining a dataset that is more diverse in the use of
eating utensils and contains drinking gestures will allow to resolve this unpredictable behavior. Finally, it should
be noted that the quality of the extracted PtM durations depends heavily on the bite detection performance.
This is because PtM is calculated for all periods in-between bites during the course of a meal. As it can be seen
from Table 2, bite detection performance is high (precision/recall/F1 equal to 0.929/0.975/0.952) but not without
errors; this can cause erroneous measurements in situations where the subject performs limited amount of bites
and/or meals.
In addition, an incident that was observed in the EaC dataset using the video GT, is that in rare occasions PD
participants were leaning their upper body towards the surface of the table. Essentially, this means that a simple,
small rotation of the wrist is enough to transfer food from the plate to the mouth (no acceleration is registered by
the sensor). Such food intake gestures can go unnoticed from the upwards micromovement recognition (and bite
detection) mechanism and have an immediate effect on the extraction of the PtM indicator. However, despite the
appearance of such sitting postures, the obtained bite detection performance in EXI (which is directly affected by
the micromovement recognition quality) and the comparison of video- and IMU-based PtM durations in EXII
(which is affected by both the micromovement recognition and the bite detection quality), is proven to be satisfac-
tory (F1 of 0.952 for EXI and MSE/MAE of 0.214/0.310 for EXII). The way different sitting/eating postures can
affect the extracted indicators is a complex topic and we consider it as a future direction for the presented work.
Conclusions
In this paper we have defined PtM, an indicator that relates with the time spent for the hand that operates the
utensil to transfer a quantity of food from the plate into the mouth. Furthermore, we also presented a methodol-
ogy towards the objective calculation of individual PtM durations and the creation of the subject’s in-meal eating
behavior profile. Experimental results using three datasets (one in clinical and two in-the-wild settings) reveal
the high potential of our approach towards the classification of in-meal eating profiles to the PD or the healthy
populations. To this day, this is the first endeavor towards the introduction of an automatically estimated, eating
behavior indicator for PD based on objective sensor measurements using commercial smartwatches.
Received: 30 September 2020; Accepted: 14 December 2020
References
1. Schapira, A. H., Chaudhuri, K. R. & Jenner, P. Non-motor features of Parkinson disease. Nat. Rev. Neurosci. 18, 435 (2017).
2. Kansara, S., Trivedi, A., Chen, S., Jankovic, J. & Le, W. Early diagnosis and therapy of Parkinson’s disease: can disease progression
be curbed?. J. Neural Transm. 120, 197–210 (2013).
3. Pagan, F. L. Improving outcomes through early diagnosis of Parkinson’s disease. Am. J. Manag. Care 18, S176 (2012).
4. Dorsey, E. R. et al. Global, regional, and national burden of Parkinson’s disease, 1990–2016: a systematic analysis for the global
burden of disease study 2016. Lancet Neurol. 17, 939–953 (2018).
5. Chaudhuri, K. R. & Titova, N. Societal burden and persisting unmet needs of Parkinson’s disease. Eur. Neurol. Rev. 14, 3–9 (2019).
6. Meara, J., Bhowmick, B. K. & Hobson, P. Accuracy of diagnosis in patients with presumed Parkinson’s disease. Age Ageing 28,
99–102 (1999).
7. Hughes, A. J., Ben-Shlomo, Y., Daniel, S. E. & Lees, A. J. What features improve the accuracy of clinical diagnosis in Parkinson’s
disease: a clinicopathologic study. Neurology 42, 1142–1142 (1992).
8. Postuma, R. B. et al. Mds clinical diagnostic criteria for Parkinson’s disease. Mov. Disord. 30, 1591–1601 (2015).
9. Melchionda, N. & Cuzzolaro, M. Parkinson’s disease, dopamine, and eating and weight disorders: an illness in the disease? Eat.
Weight. Disord. on Anorexia, Bulim. Obes. 3, 383–384 (2019).
10. Aiello, M., Eleopra, R. & Rumiati, R. . I. Body weight and food intake in Parkinson’s disease: a review of the association to non-
motor symptoms. Appetite 84, 204–211 (2015).
11. De Chazeron, I. et al. Compulsive eating behaviors in Parkinson’s disease. Eat. Weight Disord. Stud. Anorex. Bulim. Obes. 24,
421–429 (2019).
12. Kistner, A., Lhommée, E. & Krack, P. Mechanisms of body weight fluctuations in Parkinson’s disease. Front. Neurol. 5, 84 (2014).
Scientific Reports | (2021) 11:1632 | https://doi.org/10.1038/s41598-020-80394-y 12
Vol:.(1234567890)You can also read