Kmerator Suite: design of specific k-mer signatures and automatic metadata discovery in large RNA-seq datasets
←
→
Page content transcription
If your browser does not render page correctly, please read the page content below
Published online 23 June 2021                                                       NAR Genomics and Bioinformatics, 2021, Vol. 3, No. 3 1
                                                                                                    https://doi.org/10.1093/nargab/lqab058

Kmerator Suite: design of specific k-mer signatures
and automatic metadata discovery in large RNA-seq
datasets
Sébastien Riquier1,† , Chloé Bessiere1,† , Benoit Guibert1 , Anne-Laure Bouge2 ,
Anthony Boureux1 , Florence Ruffle1 , Jérôme Audoux2 , Nicolas Gilbert1 , Haoliang Xue3 ,
Daniel Gautheret3 and Thérèse Commes1,*
1
 IRMB, University of Montpellier, INSERM, 80 rue Augustin Fliche, 34295, Montpellier, France, 2 SeqOne, 34000,

                                                                                                                                                                  Downloaded from https://academic.oup.com/nargab/article/3/3/lqab058/6308460 by guest on 12 July 2021
Montpellier, France and 3 Institute for Integrative Biology of the Cell, CEA, CNRS, Université Paris-Saclay, 91198, Gif
sur Yvette, France

Received November 17, 2020; Revised May 10, 2021; Editorial Decision May 31, 2021; Accepted June 17, 2021

ABSTRACT                                                                          INTRODUCTION
The huge body of publicly available RNA-sequencing                                Publicly available human RNA-sequencing (RNA-seq)
(RNA-seq) libraries is a treasure of functional infor-                            datasets are precious resources for biomedical research.
mation allowing to quantify the expression of known                               RNA-seq data are widely used to identify actively tran-
or novel transcripts in tissues. However, transcript                              scribed genes, quantify gene or transcript expression, iden-
                                                                                  tify new fusion transcripts or identify alternative splicing
quantification commonly relies on alignment meth-
                                                                                  or mutation events. The search for specific transcriptional
ods requiring a lot of computational resources and
                                                                                  events or RNAs across large-scale data has become essential
processing time, which does not scale easily to large                             in precision medicine. Advanced tools such as recount2 (1)
datasets. K-mer decomposition constitutes a new                                   have achieved transcript counts in large datasets, available
way to process RNA-seq data for the identification                                in an online resource. However, these tools are reference
of transcriptional signatures, as k-mers can be used                              based and only provide counts for precomputed transcripts.
to quantify accurately gene expression in a less                                  An increasing number of studies attempt to analyze in a ret-
resource-consuming way. We present the Kmerator                                   rospective fashion the vast repository of RNA-seq data, in-
Suite, a set of three tools designed to extract specific                          cluding normal and pathological conditions, to discover or
k-mer signatures, quantify these k-mers into RNA-                                 validate RNA biomarkers for disease diagnosis (2,3).
seq datasets and quickly visualize large dataset char-                               For this purpose, it is important to select relevant RNA-
                                                                                  seq datasets with homogeneous characteristics and suffi-
acteristics. The core tool, Kmerator, produces spe-
                                                                                  cient samples among thousands of publicly available files.
cific k-mers for 97% of human genes, enabling the                                 The reanalysis of RNA-seq datasets poses two major chal-
measure of gene expression with high accuracy in                                  lenges. The first challenge is to filter data series and select
simulated datasets. KmerExploR, a direct application                              the most homogeneous and reliable set of libraries for ex-
of Kmerator, uses a set of predictor gene-specific                                ploration in the context of incomplete metadata (4). The
k-mers to infer metadata including library protocol,                              second challenge is to perform RNA biomarker quantifi-
sample features or contaminations from RNA-seq                                    cation in reasonable time and with sufficient accuracy to
datasets. KmerExploR results are visualized through                               extract biological information in such datasets. Alignment-
a user-friendly interface. Moreover, we demonstrate                               based methods like STAR (5) and CRAC (6) require signifi-
that the Kmerator Suite can be used for advanced                                  cant computational resources, making them inadequate for
queries targeting known or new biomarkers such as                                 querying datasets on the order of 100–1000 files for a spe-
mutations, gene fusions or long non-coding RNAs                                   cific biomarker. Pseudo-alignment algorithms like Kallisto
                                                                                  (7) and Salmon (8) are much faster but most commonly
for human health applications.                                                    use a reference transcriptome far from the real complex bi-
                                                                                  ological RNA diversity. This highlights the need for tools
                                                                                  enabling fast and specific quantification of candidate se-

* To   whom correspondence should be addressed. Tel: +33 4 67330190; Email: therese.commes@inserm.fr
†
    These authors contributed equally to this work.

C The Author(s) 2021. Published by Oxford University Press on behalf of NAR Genomics and Bioinformatics.
This is an Open Access article distributed under the terms of the Creative Commons Attribution-NonCommercial License
(http://creativecommons.org/licenses/by-nc/4.0/), which permits non-commercial re-use, distribution, and reproduction in any medium, provided the original work
is properly cited. For commercial re-use, please contact journals.permissions@oup.com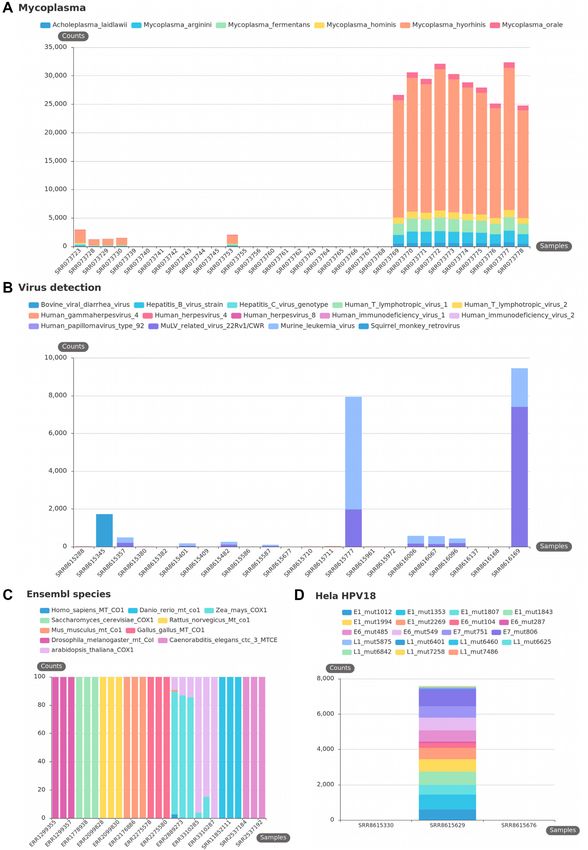
2 NAR Genomics and Bioinformatics, 2021, Vol. 3, No. 3

quences in a large set of RNA-seq data. Recently, ap-              reference genome and an Ensembl-like fasta transcrip-
proaches relying on k-mers from raw sequence files have            tome (see Figure 1A and Supplementary Figure S1A). It
emerged and are used for the query of transcriptomic data.         is implemented in Julia programming language (https://
These methods require less time and computational re-              julialang.org) and distributed with GitHub (https://github.
sources than common ones and are suited to various bio-            com/Transipedia/kmerator). Kmerator strictly depends on
logical questions, including the analysis of unannotated and       a reference genome [fasta or Jellyfish (13) index format]
atypical RNA transcriptional events. For instance, Oka-            and on an Ensembl fasta format transcriptome, to define
mura and Kinoshita proposed an ultrafast mRNA quan-                a k-mer as specific or not, depending on the number of
tification method, based on unique k-mers, that outper-            occurrences on each reference. The reference genome and
forms conventional approaches (9). Yu et al. (10) investi-         transcriptome fasta, used in this paper, have been down-
gated gene fusion queries of all tumor samples from The            loaded here: https://www.ensembl.org/info/data/ftp/index.
Cancer Genome Atlas project using k-mer sets. The DE-              html. The procedure also needs a list of gene/transcript
kupl pipeline developed by Audoux et al. (11) finds differ-        Ensembl IDs (or gene symbols) or sequences in fasta for-

                                                                                                                                     Downloaded from https://academic.oup.com/nargab/article/3/3/lqab058/6308460 by guest on 12 July 2021
ential events between two groups of RNA-seq data at the            mat from which Kmerator will extract specific k-mers. As
k-mer level.                                                       shown in Supplementary Figure S1A, Kmerator first uses
   Moreover, classical methods fail to interrogate the whole       the Jellyfish software to index and count k-mers from the
transcriptome complexity as each RNA is the result of              reference genome and transcriptome. For both genome and
a complex chain of events that combines genetic varia-             transcriptome fasta files, Jellyfish produces a hash table
tion, transcription regulation and RNA processing com-             including all possible k-mers and their number of occur-
bined with pathological alterations (12). The k-mer ap-            rences. These hash tables are stored for further querying.
proach we propose is not an equivalent method compared             Second, using Jellyfish query, Kmerator generates, for each
to the above-mentioned ones, but a new way to explore              input gene/transcript, the list of k-mers derived from this se-
RNA-seq data that could also be used for in-depth explo-           quence and their corresponding genome and transcriptome
ration outside the reference.                                      counts. These k-mers are then filtered according to the fol-
   Although any transcript sequence can be decomposed              lowing criteria: (i) only k-mers associated with a biological
into k-mers, only a subset of these k-mers is specific for the     event (transcript or gene, splice variant, chimeric RNA, cir-
transcript. We call this subset the k-mer signature. These         cular RNA, etc.) are retained and (ii) k-mers must be spe-
specific k-mers can then be quantified in RNA-seq raw data,        cific according to Kmerator rules (see Figure 1C and Sup-
making it quick and easy to measure the candidate tran-            plementary Figure S1A). Indeed, Kmerator includes three
script expression level in a wide range of RNA-seq datasets.       different levels of specificity (–level option), ‘gene’, ‘tran-
   In this paper, we present the Kmerator Suite, a set of three    script’ and ‘chimera’, detailed below:
tools designed to (i) extract k-mer signatures from tran-
scripts, (ii) quantify these k-mers into RNA-seq datasets          • Gene level specific k-mers are found zero (to include k-
and (iii) visualize large RNA-seq dataset characteristics us-        mers containing splicing junctions) or one time in the
ing precomputed signatures. The core of this suite is Kmer-          reference genome. They are also present in the reference
ator, which generates k-mer signatures specific for genes or         transcriptome in at least one isoform transcript sequence.
transcripts. The second tool, countTags, is used to quantify         If we want to select only k-mers matching at least n iso-
selected k-mers across raw RNA-seq files. We first tested the        forms on a total of N, a threshold can be set to the pro-
performance of Kmerator + countTags over the whole tran-             portion of isoforms n/N the k-mer has to be specific to,
scriptome and showed that k-mer signature quantification             using the –threshold option.
results were close to simulated count data. The third tool,        • Transcript level specific k-mers are found zero or one time
KmerExploR, demonstrates the capacity of the Kmerator                in the reference genome. They also match the reference
+ countTags pipeline combined to a set of predefined k-              transcriptome only once (transcript specificity). If the
mer signatures, to perform metadata extraction from raw              candidate transcript is not annotated, the –unannotated
RNA-seq data. KmerExploR extracts sample characteris-                option must be added. In this case, k-mers found zero or
tics related to the sequencing protocol (ribosomal deple-            one time in the reference genome and that do not map to
tion, polyA+, strand-specific protocol, 5 /3 bias, etc.), tis-     the reference transcriptome are retained.
sue origin (sex) and possible contaminations (mycoplasma,          • Chimera level specific k-mers are found neither in the ref-
virus, other species or cell lines). Such high-level quality         erence genome nor in the reference transcriptome. This
control procedures are valuable as a screening tool be-              level must be combined to the –unannotated option.
fore analyzing datasets of uncertain quality, such as public         Kmerator outputs the list of specific k-mers (also called
datasets. KmerExploR can also be used in advanced appli-             k-mer gene/transcript signature) according to the chosen
cations to look for user-defined transcripts resulting from          parameters in fasta format, for each input sequence.
mutated alleles or gene fusions in RNA-seq datasets.
                                                                   Kmerator command line options. The k-mer length can be
MATERIALS AND METHODS                                              set using the –length option. In the present study, we used
                                                                   the default 31 nt k-mer length according to the literature
Kmerator: k-mer signature identification
                                                                   (11). The level of specificity is chosen among ‘gene’, ‘tran-
An overview of the Kmerator Suite is provided in Fig-              script’ and ‘chimera’ with the –level option. When using the
ure 1A. Kmerator is a tool designed for the prediction             gene level, the APPRIS database (http://appris.bioinfo.cnio.
of specific k-mers from input sequences, considering a             es) can be queried to identify the ‘PRINCIPAL’ transcript,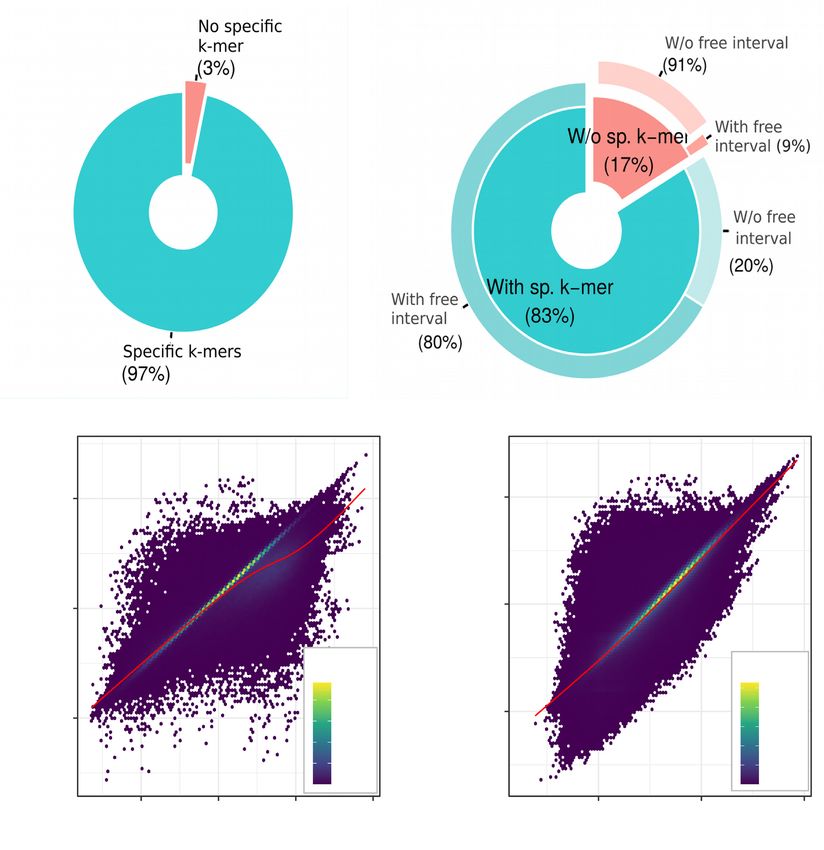
NAR Genomics and Bioinformatics, 2021, Vol. 3, No. 3 3

             A

                                                                                                                                                                Downloaded from https://academic.oup.com/nargab/article/3/3/lqab058/6308460 by guest on 12 July 2021
              B

Figure 1. Kmerator Suite and Kmerator levels: definitions. (A) The Kmerator Suite is a set of three tools: (1) Kmerator extracts gene/transcript k-mer
signatures. It takes as input a reference genome and a reference transcriptome + a list of gene or transcript sequences to extract specific k-mers from.
The output is a set of fasta files (one per input gene/transcript sequence) with the specific k-mers. (2) countTags quantifies input k-mers in a set of input
sequencing raw files (fastq files) and outputs a count table. (3) KmerExploR is a particular application of Kmerator/countTags to visualize input RNA-
seq dataset (set of fastq files) characteristics. The default usage includes characteristics related to the sequencing protocol (ribosomal depletion, polyA+,
strand-specific protocol, 5 /3 bias), tissue origin (sex) and possible contaminations (mycoplasma, virus, other species or HeLa cell line). Users can also
visualize their own signatures with the advanced usage. Details are given in the text and Supplementary Figure S1. (B) Kmerator extracts gene/transcript
k-mer signatures with three possible levels of stringency. This figure describes how the different levels are defined (transcript, gene or chimera) for two
example genes A and B. Example gene A has three isoforms: A1, A2 and A3. A1 is the only one with a free interval, i.e. a region not covered by other
isoforms, and is defined as the principal transcript (APPRIS database). Therefore, at the transcript level, each transcript has its own specific k-mer set,
depending on its coverage with other isoforms. At the gene level, the principal transcript defined with the APPRIS database is used, and specific k-mers
can be common to several isoforms. At the chimera level (example of A1–B1 fusion), the k-mer is not described in annotations.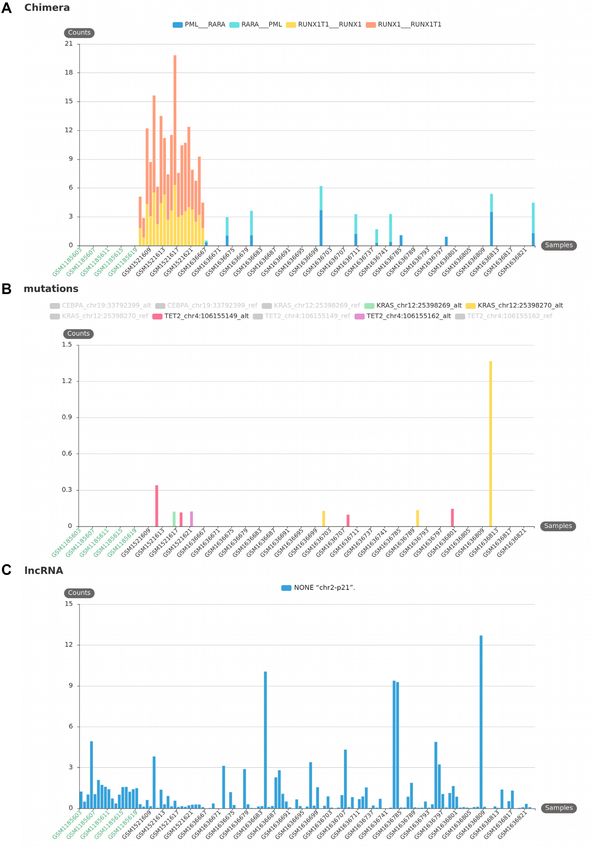
4 NAR Genomics and Bioinformatics, 2021, Vol. 3, No. 3

using the –appris option. APPRIS defines as the ‘PRIN-           occurrences. We used a k-mer length of 31 nt (–k 31) and the
CIPAL’ isoform a CDS (coding sequence) variant for each          paired-end option (–paired), and we also used the count-
gene, based on the range of protein features. When this op-      Tags normalization option to normalize k-mer counts per
tion is not used or no principal sequence is given by APPRIS     billion of k-mers present in the dataset, using the –kbp op-
[i.e. for long non-coding RNA (lncRNA)], the isoform with        tion. As many specific k-mers are associated with one sin-
the longest sequence is kept. In this study, we always used      gle transcript/gene, we computed the mean k-mer count by
the gene level in combination with the –appris option.           transcript/gene.
Kmerator usage on the entire transcriptome for performance       Comparison with Kallisto. We compared the Kmerator
assessment. Kmerator was tested to extract k-mer signa-          + countTags pipeline with Kallisto regarding the perfor-
tures from the whole human Ensembl transcriptome (com-           mances in transcript/gene expression quantification on sim-
bination of cDNA and ncRNA fasta files, version 91). The         ulated data detailed above. As our pipeline cannot quan-
Ensembl reference transcriptome was filtered to remove any       tify genes/transcripts without specific k-mers, we limited

                                                                                                                                     Downloaded from https://academic.oup.com/nargab/article/3/3/lqab058/6308460 by guest on 12 July 2021
transcript with alternate loci (labels with ‘ alt’) and have     Kallisto quantification to the genes/transcripts having spe-
been processed by Kmerator at both transcript (i.e. 199 181      cific k-mers. Kallisto 0.43.1 (7) was run using the –fr-
transcripts) and gene (54 874 genes) levels with the –appris     stranded option with the Ensembl v91 annotation file. For
option previously described. At the transcript level, 62 tran-   each pipeline, TPM (transcripts per million) counts were
scripts have been ignored due to their length inferior to the    compared to true normalized TPM using the Spearman’s
k-mer length (31 nt). The processing to generate the specific    correlation, either at the transcript level or at the gene level.
k-mers on the whole transcriptome has been completed in          Counts estimated by Kallisto were merged at the gene level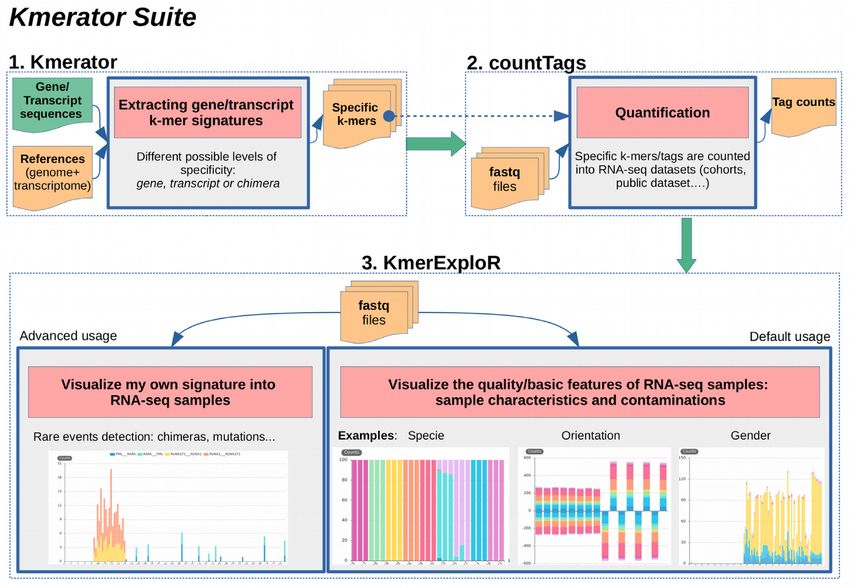
NAR Genomics and Bioinformatics, 2021, Vol. 3, No. 3 5

From input fastq files, KmerExploR runs countTags, with          corresponding animal reference genome and transcriptome
a multithreading option, to quantify built-in k-mer selec-       sequences (Ensembl v91 for each). Finally, sequences of
tion associated with each predictor gene. The detailed dia-      virus genomes have been downloaded from RefSeq using
gram is shown in Supplementary Figure S1B. KmerExploR            the common virus list provided by Uphoff et al. (22). All
can also directly take countTags output files, as for large      these potential contamination sequences were used to pro-
datasets it could be useful to separately run countTags on       duce specific k-mers using Kmerator at the chimera level,
a cluster, for example. KmerExploR outputs an html file          to select tags that can be found neither in the human refer-
with css and javascript in separate files, using the echart-     ence genome nor in the transcriptome. For the advanced ap-
sjs library to display user-friendly and graphical informa-      plication of KmerExploR, we designed k-mers correspond-
tion (https://echarts.apache.org/en/index.html). Categories      ing to new or rare transcriptional events detected in the
to show are described either in the built-in config file or in   Leucegene dataset (https://leucegene.ca/). For chimera de-
the user personal config file. KmerExploR also produces a        tection, we used two well-known fusion RNA examples as-
tabulated text file with mean counts for each predictor gene     sociated with chromosomal translocation and their recip-

                                                                                                                                 Downloaded from https://academic.oup.com/nargab/article/3/3/lqab058/6308460 by guest on 12 July 2021
in each category (rows) and in each sample (columns).            rocal counterparts [RUNX1–RUNXT1 t(x,21) RUNXT1–
                                                                 RUNX1, PML–RARA t(15,17) and RARA–PML]. Spe-
Predictor gene selection. We selected a subset of house-         cific k-mers are designed with Kmerator on 60 bp sequences
keeping genes from the list previously published by Eisen-       spanning the junction. For mutation detection, we manually
berg and Levanon (16) as well as some widely expressed           designed 31 bp k-mers centered on the mutation for refer-
histone genes that produce non-polyadenylated transcripts        ence and alternative sequences of three genes currently used
barely detected in polyA+ RNA-seq (see Table 1). We also         in acute myeloid leukemia (AML) diagnosis: TET2, KRAS
selected specific genes from chromosome Y that have a            and CEBPA. We finally designed k-mers with Kmerator at
ubiquitous expression, from Maan et al.’s publication (17).      the transcript level for a new lncRNA previously published
For these different sets of genes, we designed specific k-mers   in (23) as NONE ‘chr2-p21’.
using Kmerator at the gene level and also computed the k-
mer reversed complementary counterparts for the orienta-         RNA-seq dataset. In this paper, we illustrated KmerEx-
tion category. Housekeeping genes’ ubiquitous expression         ploR output on several datasets, depending on the bio-
profile in various tissues, chromosome Y genes’ specific ex-     logical question, all described in Supplementary Table S1.
pression pattern in male tissues and histone genes’ low ex-      Characteristics related to RNA-seq protocol, which we
pression in polyA+ RNA-seq samples have been validated           call basic features, are tested on 103 paired-end samples
by exploring the GTEx database (https://www.gtexportal.          from ENCODE (Dataset-FEATURES). For the contami-
org) (see Supplementary Figure S2).                              nations part, we used the 33 single-read samples from the
   For the detection of 5 /3 -end biases, we used the spe-     PRJNA153913 study (24) previously described as highly
cific k-mers from ubiquitous genes (orientation set) and in-     contaminated by mycoplasma (Dataset-MYCO) (25). We
dividually attributed them to their corresponding region,        also selected three public RNA-seq samples by species to
5 untranslated region (UTR), 3 UTR or CDS, depend-             check the relevance of our species-specific k-mers (Dataset-
ing on their position in the principal transcript, according     SPECIES). HeLa contamination was tested in three cer-
to the APPRIS database. For that purpose, we used En-            vical cancer CCLE (Cancer Cell Line Encyclopedia) cell
sembl annotations with the biomaRt R package that gives          lines: one HeLa and two negative controls (Dataset-HELA-
the information of the UTR and CDS regions for each tran-        CLE). Finally, for virus detection we used 19 samples from
script. We searched the k-mers in transcript CDS and UTR         the CCLE dataset reported by Uphoff et al. (22) as con-
sequences to label them by region. For mycoplasma tag            taminated by viruses and three control non-contaminated
selection, we first selected the most frequent mycoplasma        cell lines also included in the Uphoff et al. study (Dataset-
found in cell contamination according to Drexler and Up-         VIRUS-CCLE).
hoff (18). We then downloaded ribosomal RNA (rRNA)
sequences of the six selected mycoplasma species from the        RESULTS
SILVA database v132 (19), which provides updated and cu-
                                                                 Kmerator performances
rated rRNA sequences from Bacteria, Archaea and Eukary-
ota. Some species have several associated strains and there-     To assess the Kmerator methodology, we first extracted
fore, several rRNA sequences. We have included them all          k-mer signatures from all the human Ensembl transcrip-
for the k-mer design. For HeLa detection, we selected HPV-       tome (i.e. 199 181 transcripts) and genes (i.e. 54 874 coding
18 transcripts reported to be expressed in HeLa cells (20).      and non-coding genes). We were able to identify specific k-
Using UGENE software (21), we manually modified these            mers (k = 31 nt) for 83% of human transcripts and 97% of
transcripts to match the mutations reported as HeLa spe-         human genes as shown in Figure 2A and B.
cific in the Cantalupo et al. study (20). We then defined se-       This way, the transcriptome information has been almost
quences taking 30 nt on both sides of each mutation, before      entirely summarized by 69 760 957 k-mers at the transcript
passing them to Kmerator to keep only k-mers not present         level and 88 003 855 k-mers at the gene level, corresponding
in the human genome and transcriptome. For species iden-         to 23.8% and 30% of the total number of k-mers in the refer-
tification, we selected those principally found in the SRA       ence transcriptome, respectively. The attribution of specific
database. We then downloaded mitochondrially encoded             k-mers at the gene and transcript levels is fundamentally
cytochrome c oxidase I (MT-CO1) human gene sequence              different: whereas the gene level (–appris option) accepts
and its orthologs in each of the selected species, using the     specific k-mers shared with other isoforms, the transcript
6 NAR Genomics and Bioinformatics, 2021, Vol. 3, No. 3
A B
Downloaded from https://academic.oup.com/nargab/article/3/3/lqab058/6308460 by guest on 12 July 2021
C D
Figure 2. Kmerator performances on the whole transcriptome. We extracted k-mer signatures from all the human Ensembl transcriptome v91 at both gene
(54 874 coding and non-coding genes, left) and transcript (i.e. 199 181 transcripts, right) levels. (A) The first pie chart represents the proportion of genes
having specific k-mers (turquoise) versus those without specific k-mers (red). (B) In the same way, we represented the proportion of transcripts having
specific k-mers (turquoise) or not (red). For these two classes, we looked at the percentage having free intervals, i.e. regions in the transcript not shared with
other isoforms (secondary pie). Most of the transcripts lacking specific k-mers do not have free intervals (91%). We tested Kmerator sensitivity to quantify
simulated data, at both gene (C) and transcript (D) levels. We represented the k-mer counts normalized per billion of k-mers in the sample (Y-axis) as a
function of the true expression in TPM (X-axis), on the whole simulated dataset. R is the Spearman’s correlation coefficient between k-mer counts and
TPM. Each point on the graph is a transcript and the color scale depends on the transcript density on the graph.
level is more stringent and eliminates each k-mer shared ure 1B). As expected, 91% of transcripts without specific k-
by other ones. This explains the higher percentage of tran- mer have no ‘free interval’, which means that they are com-
scripts without specific k-mer compared to the gene level. pletely covered by other transcripts, thus confirming the val-
To explain the absence of specific k-mers for some tran- idation of the Kmerator process. The set of specific k-mers
scripts, we used BiomaRt genomic intervals to calculate the designed with Kmerator strongly depends on the input se-
part of each transcript not covered by other isoforms, con- quence and on the level of selection. At the gene level, we
sidering the strand, and named it ‘free interval’ (see Fig- observed that the length of the input sequence was corre-NAR Genomics and Bioinformatics, 2021, Vol. 3, No. 3 7
lated with the number of designed specific k-mers (R = 0.91, Figure S4E). These results support an optimized usage of
P < 2.2e−16; see Supplementary Figure S3A) but not at the the Kmerator Suite protocol for its primary usage: the re-
transcript level (R = 0.22, P < 2.2e−16; see Supplementary search of a limited number of signatures in large RNA-seq
Figure S3B). On the contrary, the transcript level depends datasets.
on the overlap between the input transcript and the differ-
ent isoforms. A high number of isoforms is correlated to a
KmerExploR for inspecting large RNA-seq datasets
low number of specific k-mers (R = 0.79, P < 2.2e−16; see
Supplementary Figure S3C) and, in addition, the length of We developed KmerExploR to improve the characteriza-
free intervals is strongly correlated to the number of spe- tion of large RNA-seq datasets using the quantification of
cific k-mers (R = 0.94, P < 2.2e−16; see Supplementary selected predictor genes. Predictor genes have been selected
Figure S3D). Finally, k-mer design differs between biotypes based on the literature to answer specific questions (see Ta-
and selection levels: the biotypes without specific k-mers ble 1). As described in the ‘Materials and Methods’ section,
mainly correspond to small RNAs (miRNAs, rRNA) at the we first extracted with Kmerator sets of specific k-mers from
Downloaded from https://academic.oup.com/nargab/article/3/3/lqab058/6308460 by guest on 12 July 2021
gene level (see Supplementary Figure S3E) and to coding gene sequences and use KmerExploR to count the k-mer
and pseudo-genes at the transcript level (see Supplementary occurrences in RNA-seq datasets and visualize the results.
Figure S3F). Here, we present the results obtained with specific datasets
The Kmerator Suite has been designed as a new way to (Table 1 and Supplementary Table S1) selected to highlight
explore RNA-seq data and rapidly quantify some chosen the rapid control of biological and technical parameters us-
sequences called predictors. Kmerator, the first key element ing KmerExploR. The results of the basic features, includ-
of this suite, can extract unique k-mers from any sequence. ing sample sex, polyA or ribo-depletion, orientation and
In combination with countTags, it is used to generate large 5 /3 bias, are presented in Figure 3.
k-mer count tables. To situate our tool in relation to a widely As previously described, sample sex is determined by
used, referenced and benchmarked quantification tool, we searching for k-mers corresponding to genes located on
tested the Kmerator + countTags pipeline accuracy to es- the Y chromosome. The k-mer signature clearly separates
timate gene and transcript expression using simulated data samples depending on the sex. To help the user classify
(see the ‘Materials and Methods’ section). Indeed, using a his samples, we defined, in KmerExploR, a threshold of
simulated dataset, for which we have the exact counts, even five k-mers per billion, above which we expect with con-
if it fails to capture the complexity of real data, is the best fidence that it is a male. Moreover, Y chromosome gene
way to proceed to illustrate our purpose (26). We have run expression variance between the samples can be explained
Kmerator and countTags to search for all human gene and by the variability of cell types and public RNA-seq exper-
transcript expression levels in a set of 10 simulated data. iment parameters, including sequencing depth and meth-
We assessed Spearman’s correlation between normalized k- ods of RNA extraction and selection. For instance, the four
mer counts and the ground truth. We used countTags k- male samples with the lowest expression (ENCFF232KGN,
mer mean count per transcript reported to the total of k- ENCFF434EMO, ENCFF831HCD and ENCFF992HBZ)
mers contained in the input fastq. As shown in Figure 2, come from a unique study (ENCSR999ZCI). However, the
the Spearman’s correlation factor comparing Kmerator + sex classification is more complicated in case of cancer-
countTags results to the truth is 0.86 for the gene level (Fig- ous data. When we are looking at cancerous RNA-seq
ure 2C) and 0.94 for the transcript level (see Figure 2D), cell lines, some samples with male metadata show low
indicating a highly positive relationship with normalized Y chromosome-specific gene expression (data not shown).
counts (P < 2e−16). This extreme downregulation of chromosome Y gene ex-
Quantification results are comparable when using the pression has already been described in previous studies and
Kallisto pseudo-alignment method, despite slightly higher strongly associated with cancer risk in men (27).
correlation factors (gene and transcript R = 0.97; see Sup- Gene abundance can be measured in RNA-seq data
plementary Figure S4A and B). This result is consistent with through sequencing of mRNA or ribo-depleted total RNA
the recent paper describing Matataki (9), another quantifi- samples. The mRNA protocol relies on polyA selection,
cation tool based on k-mers. Our pipeline being not specif- when the total RNA method is based on rRNA depletion
ically dedicated to gene quantification but for rapid explo- (Ribozero protocol). However, non-polyadenylated tran-
ration of large datasets is accurate enough to evaluate gene scripts should only be found in data produced using this
and transcript expression levels in RNA-seq data. Inter- procedure, when they should barely be detectable in mRNA
estingly, the precision of Kallisto quantification decreases samples. As the majority of histone transcripts are known
strongly with transcripts/genes not covered by Kmerator to be non-polyadenylated, we used this characteristic first to
(see Supplementary Figure S4C and D), showing that each detect sample contamination by non-polyadenylated RNA,
protocol using the k-mer principle struggles to correctly and second to infer from the result the RNA preparation
quantify sequences that do not possess distinctive k-mers. procedure. We first investigated the expression level of all
Finally, we tested speed performance of countTags pro- histone genes and retained the most highly expressed ac-
cessing time on random subparts of sample simulated data cording to the literature. Second, we analyzed their expres-
(10 million, 101 nt paired-end reads), while increasing the sion pattern using the GTEX resource. As RNA-seq from
number of quantified k-mers (1/1000/1 million). It appears GTEX are exclusively produced from polyA selected RNA
that processing time remains low compared to alignment- samples, we used this database to select histone genes show-
based protocols (∼1 min for 10 million reads) and depends ing the lowest expression levels (see Supplementary Fig-
on the number of k-mers quantified (see Supplementary ure S2B). We used this set of histone genes to test a se-8 NAR Genomics and Bioinformatics, 2021, Vol. 3, No. 3
Downloaded from https://academic.oup.com/nargab/article/3/3/lqab058/6308460 by guest on 12 July 2021
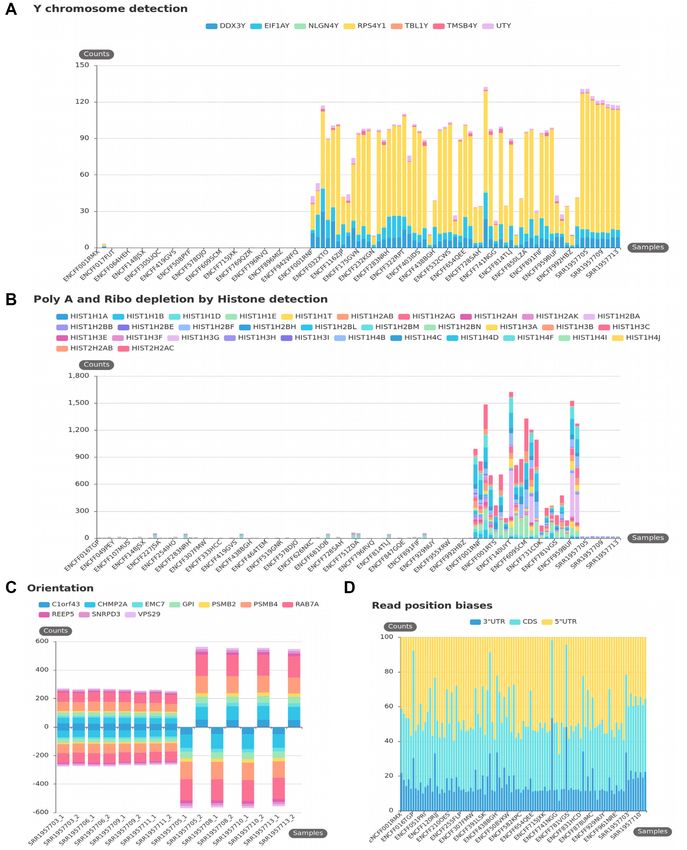
Figure 3. KmerExploR default usage: basic features. All presented bar plots are direct output of KmerExploR and they are generated from the Dataset-
FEATURES described in Supplementary Table S1 (103 paired-end ENCODE samples) except for the orientation (C), which is a subset of eight RNA-seq
from the Dataset-FEATURES. For each bar plot, the legend lists the set of predictor genes for which k-mer mean counts are computed (see also Table
1). Samples are on the X-axis. Panels (A), (B) and (C) have the mean k-mer counts by gene normalized per billion of k-mers on the Y-axis. (A) Sex
determination. Samples are sorted by sex in the order female, then male. (B) PolyA+ selection versus ribo-depletion by histone detection. Samples are
sorted by protocol in this order: polyA, ribo-depletion, unknown. (C) Stranded versus unstranded sequencing protocol. For this category, both fastq files
by sample are shown. The first four samples are unstranded and the last four samples are stranded. (D) Read position biases along 5 UTR, 3 UTR and
CDS regions. After computing k-mer mean counts by gene, they are summed up by 5 UTR, 3 UTR or CDS regions and converted in % (Y-axis).NAR Genomics and Bioinformatics, 2021, Vol. 3, No. 3 9
Table 1. List of predictor genes, by category, included in KmerExploR and associated RNA-seq dataset names used in this paper
Total k-mer References and
Datasets Predictor genes number details
PolyA/RiboD Dataset- HIST2H2AC, HIST2H2AB, HIST1H4J, HIST1H4I, 24 512 Supplementary
FEATURES HIST1H4F, HIST1H4D, HIST1H4C, HIST1H4B, Figure S2
HIST1H3I, HIST1H3H, HIST1H3G, HIST1H3F,
HIST1H3E, HIST1H3C, HIST1H3B, HIST1H3A,
HIST1H2BN, HIST1H2BM, HIST1H2BL,
HIST1H2BH, HIST1H2BF, HIST1H2BE, HIST1H2BB,
HIST1H2BA, HIST1H2AK, HIST1H2AH,
HIST1H2AG, HIST1H2AB, HIST1H1T, HIST1H1E,
HIST1H1D, HIST1H1B, HIST1H1A
Orientation Dataset- VPS29, SNRPD3, REEP5, RAB7A, PSMB4, PSMB2, 36 638 Supplementary
FEATURES GPI, EMC7, CHMP2A, C1orf43, VPS29 rev, Figure S2 (16)
Downloaded from https://academic.oup.com/nargab/article/3/3/lqab058/6308460 by guest on 12 July 2021
SNRPD3 rev, REEP5 rev, RAB7A rev, PSMB4 rev,
PSMB2 rev, GPI rev, EMC7 rev, CHMP2A rev,
C1orf43 rev
Sex Dataset- UTY, TMSB4Y, TBL1Y, RPS4Y1, NLGN4Y, EIF1AY, 21 996 Supplementary
FEATURES DDX3Y Figure S2 (17)
5 /3 bias Dataset- VPS29, SNRPD3, REEP5, RAB7A, PSMB4, PSMB2, 12 705 Supplementary
FEATURES GPI, EMC7, CHMP2A, C1orf43 Figure S2 (16)
Mycoplasma Dataset-MYCO Mycoplasma orale, Mycoplasma hyorhinis, 363 025 (18)
Acholeplasma laidlawii, Mycoplasma hominis,
Mycoplasma arginini, Mycoplasma fermentans
Virus Dataset-VIRUS- Human gammaherpesvirus 4, Human herpesvirus 4, 516 882 (22)
CCLE Human herpesvirus 8, Murine leukemia virus,
Hepatitis C virus genotype,
Human immunodeficiency virus 1,
Human T lymphotropic virus 1,
Squirrel monkey retrovirus,
Human T lymphotropic virus 2,
Human papillomavirus type 92, Hepatitis B virus strain,
Human immunodeficiency virus 2,
MuLV related virus 22Rv1/CWR,
Bovine viral diarrhea virus
HeLa Dataset-HELA- L1 mut7486, L1 mut7258, L1 mut6842, L1 mut6625, 589 (20)
CCLE L1 mut6460, L1 mut6401, L1 mut5875, E7 mut806,
E7 mut751, E6 mut549, E6 mut485, E6 mut287,
E6 mut104, E1 mut2269, E1 mut1994, E1 mut1843,
E1 mut1807, E1 mut1353, E1 mut1012
Species Dataset- Homo sapiens MT CO1, Danio rerio mt co1, 12 119 MT-CO1 (and
SPECIES Zea mays COX1, Saccharomyces cerevisiae COX1, orthologs)
Rattus norvegicus Mt co1, Mus musculus mt Co1,
Gallus gallus MT CO1,
Drosophila melanogaster mt CoI,
Caenorhabditis elegans ctc 3 MTCE,
Arabidopsis thaliana COX1
Chimeras Dataset- PML–RARA, RARA–PML, RUNX1T1–RUNX1, 724
LEUCEGENE RUNX1–RUNX1T1
lncRNA Dataset- NONE 78 (23)
LEUCEGENE
Mutations Dataset- TET2, KRAS, CEBPA 10
LEUCEGENE
The samples included in each dataset and some metadata are detailed in Supplementary Table S1.
lection of ENCODE samples that metadata indicates ei- their ability to retain or not RNA strand information. To
ther polyA or ribo-depletion protocol (Supplementary Ta- detect this characteristic from RNA-seq data, we designed
ble S1). The results clearly demonstrate differences between k-mers, specific for a set of ubiquitous genes (Table 1) and
libraries prepared by ribo-depletion versus polyA selection their reverse complement counterparts. K-mers on the for-
for most of the chosen histone genes. We observe histone ward strand are counted as positive and their reverse com-
gene expression variability between the samples demon- plement as negative, permitting to determine the orienta-
strating again the disparity of public data. To help users cat- tion of the library. If forward and reverse tags are found
egorize their RNA-seq data, we defined in the KmerExploR in equivalent proportions in the same fastq file, data are
tool a threshold of 200 k-mer counts per billion for this cat- considered as ‘unstranded’. This leads graphically to a bal-
egory, above which we expect to have only the ribo-depleted anced distribution between positive and negative counts.
samples and not the polyA ones. As shown in Figure 3, using this property we are able to
Strand-specific and unstranded library preparation are clearly separate unstranded and stranded libraries. 5 to 3 -
two commonly used preparation protocols that differ by end bias is a difference of reads’ repartition along the tran-10 NAR Genomics and Bioinformatics, 2021, Vol. 3, No. 3
scripts, classically linked to library preparation: incomplete some samples, with a prevalence for the M. hyorhinis species.
retrotranscription or specific protocols. A comparison be- Comparing our results with the Olarerin-George and Ho-
tween polyA selection and ribo-depletion protocols has pre- genesch study that used Bowtie 1 alignment and BLAST+
viously shown coverage differences across transcripts with a to filter non-specific reads, we were able to confirm my-
poor 5 -end coverage with the polyA selection method (28). coplasma rRNA presence for the same samples (see Supple-
Knowing whether an RNA-seq sample possesses a read mentary Figure S5A). Moreover, we observe a high propor-
repartition bias is critical for isoform detection, or simply to tionality between our k-mer counts and their read counts
give an indication on the library construction protocol used on the 33 single-read samples (Dataset-MYCO described in
in large-scale analysis of public data. Using previously de- Supplementary Table S1), for each of the six common My-
scribed housekeeping genes (Table 1), we have selected dif- coplasma species.
ferent sets of specific k-mers depending on their position in Viruses are a significant cause of human cancers. Several
the regions defined as 5 UTR, 3 UTR and CDS. Figure studies interrogate for the presence of major viruses known
3C shows the repartition in percent of these k-mers across to infect human and other mammalian cells (22,34,35). Re-
Downloaded from https://academic.oup.com/nargab/article/3/3/lqab058/6308460 by guest on 12 July 2021
the Dataset-FEATURES samples. Representing the mean cently, Uphoff et al. screened >300 CCLE RNA-seq data
k-mer counts as a percentage allows us to evaluate the dis- using the Taxonomer interactive tool and compared the
tribution homogeneity across 5 UTR, 3 UTR and CDS results to virus-specific polymerase chain reaction (PCR)
regions between the 103 ENCODE samples. This global analysis, revealing 20 infected cell lines with different viruses
representation grouping together several genes allows us (22). To rapidly explore the potential presence of viruses in
to identify samples for which one region has a very little RNA-seq datasets with our k-mer-based approach, we used
coverage. Here, four samples haveNAR Genomics and Bioinformatics, 2021, Vol. 3, No. 3 11
Downloaded from https://academic.oup.com/nargab/article/3/3/lqab058/6308460 by guest on 12 July 2021
Figure 4. KmerExploR default usage: contaminations. All presented bar plots are direct output of KmerExploR and all bar plot datasets are described in
Supplementary Table S1. For each bar plot, the legend lists the set of predictors for which k-mer mean counts are computed (details in Table 1). Samples are
on the X-axis. Panels (A), (B) and (D) have the mean k-mer counts by gene normalized per billion of k-mers on the Y-axis. (A) Mycoplasma contamination
on the Dataset-MYCO (33 single-read samples). (B) Virus detection on the Dataset-VIRUS-CCLE (22 paired-end samples). (C) Species determination on
the Dataset-SPECIES (27 paired-end samples). For this category, after computing k-mer mean counts by species, they are converted in % (Y-axis) to avoid
big expression differences between species. (D) HeLa determination on the Dataset-HELA-CCLE (three paired-end samples). The sample in the middle is
a HeLa cell line and the two others are negative controls (SF767 and SiHa cells).12 NAR Genomics and Bioinformatics, 2021, Vol. 3, No. 3
As for HeLa cells, cross-species contamination remains mance of the approach. The results obtained with a part of
a documented ‘danger’ for the interpretation of results in the Leucegene cohort are presented in Figure 5.
molecular biology (37). The probability of mixed cell lines The selection includes different AML subtypes and nor-
in sample preparation, usage of PCR that can accidentally mal CD34+ cells as control (Dataset-LEUCEGENE de-
amplify the wrong piece of DNA, and an unknown proba- scribed in Supplementary Table S1). The results obtained
bility of error in metadata assignation motivated us to cre- with two well-known fusion RNAs associated with chro-
ate a quality check to determine the species of an RNA- mosomal translocation, RUNX1–RUNXT1 t(x,21) and
seq sample. In (38), the usage of mitochondrial DNA for PML–RARA t(15,17), and their reciprocal counterparts
phylogenetic and taxonomic inference was discussed and RUNXT1–RUNX1 and RARA–PML are presented in Fig-
two extreme viewpoints emerged: using exclusively the mi- ure 5A. In this case, the k-mers, once designed by Kmerator,
tochondrial DNA or fully excluding it. It appears that mi- are restricted to those spanning the fusion junction with at
tochondrial DNA does not fully answer or impairs the per- least 10 nucleotides in gene 1 or gene 2 of the fusion. All the
spectives of advanced phylogenetics. However, the ‘mito- normal CD34+ cells are negative and we only observe an ex-
Downloaded from https://academic.oup.com/nargab/article/3/3/lqab058/6308460 by guest on 12 July 2021
chondrial barcode’ approach does show an interesting gene pression in corresponding positive AML subtypes. Figure
marker, MT-CO1 (39), that could be sufficient for a quick 5B illustrates the results obtained for mutations in TET2,
check of the species of RNA-seq data. Indeed, this gene is KRAS and CEBPA genes currently used in AML diagno-
highly expressed and reference sequences from many dis- sis. Once again, we only observe the presence of these mu-
tinct species of animals are available. Thus, we selected spe- tations in positive samples, demonstrating the high speci-
cific k-mers with Kmerator, at the gene level, for MT-CO1. ficity of the approach by k-mers. The expression of a new
We repeated the procedure for MT-CO1 orthologs in dif- lncRNA was also quickly searched in the Leucegene dataset
ferent species, principally found in the SRA database, us- (see Figure 5C); we observe a homogeneous and low expres-
ing the appropriate species reference genome and transcrip- sion in CD34 normal cells compared to a heterogeneous
tome. These k-mers have been then quantified in three pub- one in AML subtypes. This lncRNA candidate was already
lic data by species to check the efficiency of their usage. As described in (23), using for the first time the ‘k-mer con-
shown in Figure 4C, the research of MT-CO1 k-mers alone cept’ for checking new biomarker candidates, and we have
can discriminate most of the common Ensembl species and demonstrated a restricted expression of the NONE ‘chr2-
can be usable for a quick quality check. However, without p21’ lncRNA in the hematopoietic lineage using the Leuce-
proper experiments we cannot support its usage with phy- gene and ENCODE datasets. Hence, for lncRNA candi-
logenetically close species. dates, following their discovery in a tissue/disease type, their
To conclude, we developed KmerExploR to rapidly con- specificity could be easily evaluated through quantification
trol RNA-seq raw data quality and filter samples on un- in a wide range of RNA-seq data including normal and
usual profiles or presence of contaminations. KmerExploR pathological conditions as recently described by Riquier et
is a tool that provides a modular set of analyses like fastQC al. (40).
(https://qubeshub.org/resources/fastqc). It can be used in a In conclusion, the high specific expression of transcrip-
complementary way to fastQC analysis to complete miss- tional events may lead them to be used as biomarkers for bi-
ing metadata in public datasets or to give a quick profile of ological and health applications, including cell therapy, di-
the RNA-seq contents. The modular analysis is based on a agnosis, prognosis or patient follow-up as it is already done
k-mer selection from predictor genes, included in KmerEx- with fusion RNAs and mutations.
ploR. The tool can be used to control any human RNA-seq
dataset, and it can also be easily modified adding any other
DISCUSSION
modular function.
Considering the growing number of RNA-seq data, the use
of raw data sequences is an important step to check with
RNA-seq protocols or bioinformatic pipelines bias. Here,
KmerExploR, an advanced usage for the detection of genomic
we demonstrated that the Kmerator Suite is an efficient
or transcriptomic events
and useful set of tools to verify RNA-seq quality and con-
The above ‘checking application’ of KmerExploR demon- trol intrinsic method and biological characteristics that of-
strated all its potential in the rapid exploration of large ten failed in technical description. We also showed that the
public RNA-seq datasets before performing any biological Kmerator Suite can be used to quantify gene/transcript-
query. However, the KmerExploR tool can also be used in a specific expression as well as to explore sequence variations
more advanced way such as biomarker search or discovery at the transcriptional level. In this first version, the tool is
in human health. This application is a powerful one as it can adapted to human data Ensembl entry, as main public data
compensate for the lack of completeness in genomic or tran- are available for this species (164 000 RNA-seq with >30
scriptomic references and we currently know that much im- million reads for Homo sapiens in the SRA database). A
portant information may be missed by ignoring the unref- new implementation with adapted predictors is necessary
erenced RNA diversity (12). As a proof of concept, we used for other species.
a set of k-mers designed with Kmerator to identify events The meta-analyses performed in the present study with
outside reference annotations including fusion or chimeric KmerExploR are a proof of concept of the procedure po-
RNA, oncogene mutations and new lncRNA expression. tential and could be extended to other biological RNA-seq
We then applied k-mer quantification in a tumoral and a questioning: (i) to extend the application to an enlarged
non-tumoral dataset to evaluate the specificity and perfor- set of microorganisms including new ones like SARS-Cov2NAR Genomics and Bioinformatics, 2021, Vol. 3, No. 3 13
Downloaded from https://academic.oup.com/nargab/article/3/3/lqab058/6308460 by guest on 12 July 2021
Figure 5. KmerExploR advanced usage: quantification of transcriptomic events outside the annotations. All presented bar plots are direct output of
KmerExploR and they are all generated from the Dataset-LEUCEGENE described in Supplementary Table S1 (131 paired-end samples). This dataset
includes normal CD34+ cells as control (in green on the X-axis) and different AML subtypes (in black on the X-axis). For each bar plot, the legend lists
the set of predictors for which k-mer mean counts normalized per billion (Y-axis) are computed. (A) Chimera detection. Two well-known fusion RNAs
associated with chromosomal translocation and their reciprocal counterparts are presented: RUNX1–RUNXT1 t(x,21) and PML–RARA t(15,17). (B)
Mutation detection. TET2, KRAS and CEBPA genes are used in AML diagnosis. The bar plot shows four different mutations for these genes, detected
specifically in some AML samples. The reference allele for each of these mutations is detected in almost all samples. (C) New lncRNA detection: NONE
‘chr2-p21’ lncRNA described in (23). This transcript is expressed in the whole dataset but shows different levels of expression depending on AML subtype.14 NAR Genomics and Bioinformatics, 2021, Vol. 3, No. 3
detection and (ii) to search for immunophenotyping pro- and C.B. participated in Kmerator code improvements. C.B.
file in cancer datasets as already published by Mangul analyzed RNA-seq data and generated figures. B.G. de-
et al. (41,42). Considering advanced applications, we also veloped KmerExploR code, and generated k-mer counting
demonstrated the potential of k-mers to explore gene ex- and figures. J.A. and A.B. computed and corrected count-
pression in RNA-seq to reinforce biological questions or Tags. F.R. validated the RNA-seq data for mutation and
biomarker usage and discovery. Moreover, many other re- chimeric RNAs, and helped in the interpretation of results.
quests could be easily considered for annotated gene explo- H.X. participated in Kmerator testing and checking. All au-
ration like gene co-expression, or to compensate the lack thors read and approved the final manuscript.
of completeness in genomic or transcriptomic references
to cover unreferenced RNA diversity and search for new
spliced events, intron retention or new transcript categories FUNDING
including circular RNAs. In order to increase the potential
of the k-mer approach, access to very large-scale datasets Agence Nationale de la recherche [ANR-10-INBS-09];
Downloaded from https://academic.oup.com/nargab/article/3/3/lqab058/6308460 by guest on 12 July 2021
like SRA level (164 000 human samples) could be consid- Canceropole Grand Ouest [2017-EM24]; Region Occitanie
ered with efficient indexing structure development (43). [R19073FF].
Finally, we showed that the Kmerator Suite can be used Conflict of interest statement. None declared.
to quantify gene/transcript expression as well as to ex-
plore sequence variations at the transcriptional level. The
simplicity of specific k-mer extraction principle and quan- REFERENCES
tification provide flexibility of usage. Indeed, Kmerator 1. Collado-Torres,L., Nellore,A., Kammers,K., Ellis,S.E., Taub,M.A.,
Suite quantification does not use probabilistic methods or Hansen,K.D., Jaffe,A.E., Langmead,B. and Leek,J.T. (2017)
expectation–maximization algorithms like in Kallisto (7), Reproducible RNA-seq analysis using recount2. Nat. Biotechnol., 35,
319–321.
Sailfish (44) or RNA-Skim (45). Therefore, the sets of spe- 2. Byron,S.A., Van Keuren-Jensen,K.R., Engelthaler,D.M.,
cific k-mers for quantification can be created, merged and Carpten,J.D. and Craig,D.W. (2016) Translating RNA sequencing
updated at will, without consequence on the quantification into clinical diagnostics: opportunities and challenges. Nat. Rev.
itself. The principle of user-owned collection of signatures Genet., 17, 257–271.
of interest that can be searched broadly among datasets is 3. Xi,X., Li,T., Huang,Y., Sun,J., Zhu,Y., Yang,Y. and Lu,Z.J. (2017)
RNA biomarkers: frontier of precision medicine for cancer.
the core of KmerExploR application. Non-Coding RNA, 3, 9.
4. Hippen,A.A. and Greene,C.S. (2020) Expanding and remixing the
metadata landscape. Trends Cancer, 7, 276–278.
DATA AVAILABILITY 5. Dobin,A., Davis,C.A., Schlesinger,F., Drenkow,J., Zaleski,C., Jha,S.,
Batut,P., Chaisson,M. and Gingeras,T.R. (2013) STAR: ultrafast
RNA-seq libraries were downloaded from the European universal RNA-seq aligner. Bioinformatics, 29, 15–21.
Nucleotide Archive of the European Bioinformatics Insti- 6. Philippe,N., Salson,M., Commes,T. and Rivals,E. (2013) CRAC: an
tute (46). The reference GRCh38 genome and Ensembl integrated approach to the analysis of RNA-seq reads. Genome Biol.,
v91 transcripts were downloaded from Ensembl. Kmer- 14, R30.
ator is distributed under the MIT license. The Kmera- 7. Bray,N.L., Pimentel,H., Melsted,P. and Pachter,L. (2016)
Near-optimal probabilistic RNA-seq quantification. Nat. Biotechnol.,
tor, KmerExploR and countTags software, documentation 34, 525–527.
and supplementary material presented herein are avail- 8. Patro,R., Duggal,G., Love,M.I., Irizarry,R.A. and Kingsford,C.
able from https://github.com/Transipedia/kmerator, https: (2017) Salmon provides fast and bias-aware quantification of
//github.com/Transipedia/kmerexplor and https://github. transcript expression. Nat. Methods, 14, 417–419.
9. Okamura,Y. and Kinoshita,K. (2018) Matataki: an ultrafast mRNA
com/Transipedia/countTags, respectively. quantification method for large-scale reanalysis of RNA-seq data.
BMC Bioinformatics, 19, 266.
10. Yu,Y., Liu,J., Liu,X., Zhang,Y., Magner,E., Qian,C. and Liu,J. (2018)
SUPPLEMENTARY DATA SeqOthello: querying RNA-seq experiments at scale. Genome Biol.,
Supplementary Data are available at NARGAB Online. 19, 167.
11. Audoux,J., Philippe,N., Chikhi,R., Salson,M., Gallopin,M.,
Gabriel,M., Le Coz,J., Drouineau,E., Commes,T. and Gautheret,D.
(2017) DE-kupl: exhaustive capture of biological variation in
ACKNOWLEDGEMENTS RNA-seq data through k-mer decomposition. Genome Biol., 18, 243.
The authors are grateful to Henrietta Lacks, now deceased, 12. Morillon,A. and Gautheret,D. (2019) Bridging the gap between
reference and real transcriptomes. Genome Biol., 20, 112.
and to her surviving family members for their contributions 13. Marçais,G. and Kingsford,C. (2011) A fast, lock-free approach for
to biomedical research. The HeLa cell line that was estab- efficient parallel counting of occurrences of k-mers. Bioinformatics,
lished from her tumor cells without her knowledge or con- 27, 764–770.
sent in 1951 has made significant contributions to scientific 14. Soneson,C. (2014) compcodeR: an R package for benchmarking
differential expression methods for RNA-seq data. Bioinformatics,
progress and advances in human health. The authors are 30, 2517–2518.
also grateful to Rayan Chikhi for his comments and correc- 15. Frazee,A.C., Jaffe,A.E., Langmead,B. and Leek,J.T. (2015) Polyester:
tions. simulating RNA-seq datasets with differential transcript expression.
Author contributions: S.R. and T.C. designed the study. S.R., Bioinformatics, 31, 2778–2784.
C.B. and T.C. wrote the manuscript. A.-L.B., N.G. and D.G. 16. Eisenberg,E. and Levanon,E.Y. (2013) Human housekeeping genes,
revisited. Trends Genet., 29, 569–574.
were contributors in the design of the study and manuscript 17. Maan,A.A., Eales,J., Akbarov,A., Rowland,J., Xu,X., Jobling,M.A.,
corrections. S.R. developed the code of Kmerator, selected Charchar,F.J. and Tomaszewski,M. (2017) The Y chromosome: a
and downloaded public datasets, and analyzed data. B.G. blueprint for men’s health? Eur. J. Hum. Genet., 25, 1181–1188.NAR Genomics and Bioinformatics, 2021, Vol. 3, No. 3 15
18. Drexler,H.G. and Uphoff,C.C. (2002) Mycoplasma contamination of Taxonomer: an interactive metagenomics analysis portal for universal
cell cultures: incidence, sources, effects, detection, elimination, pathogen detection and host mRNA expression profiling. Genome
prevention. Cytotechnology, 39, 75–90. Biol., 17, 111.
19. Yilmaz,P., Parfrey,L.W., Yarza,P., Gerken,J., Pruesse,E., Quast,C., 34. Cao,S., Strong,M.J., Wang,X., Moss,W.N., Concha,M., Lin,Z.,
Schweer,T., Peplies,J., Ludwig,W. and Glöckner,F.O. (2014) The O’Grady,T., Baddoo,M., Fewell,C., Renne,R. et al. (2015)
SILVA and ‘All-species Living Tree Project (LTP)’ taxonomic High-throughput RNA sequencing-based virome analysis of 50
frameworks. Nucleic Acids Res., 42, D643–D648. lymphoma cell lines from the Cancer Cell Line Encyclopedia Project.
20. Cantalupo,P.G., Katz,J.P. and Pipas,J.M. (2015) HeLa nucleic acid J. Virol., 89, 713–729.
contamination in The Cancer Genome Atlas leads to the 35. Cantalupo,P.G., Katz,J.P. and Pipas,J.M. (2018) Viral sequences in
misidentification of human papillomavirus 18. J. Virol., 89, human cancer. Virology, 513, 208–216.
4051–4057. 36. Selitsky,S.R., Marron,D., Hollern,D., Mose,L.E., Hoadley,K.A.,
21. Okonechnikov,K., Golosova,O. and Fursov,M. and UGENE Team Jones,C., Parker,J.S., Dittmer,D.P. and Perou,C.M. (2020) Virus
(2012) Unipro UGENE: a unified bioinformatics toolkit. expression detection reveals RNA-sequencing contamination in
Bioinformatics, 28, 1166–1167. TCGA. BMC Genomics, 21, 79.
22. Uphoff,C.C., Pommerenke,C., Denkmann,S.A. and Drexler,H.G. 37. Ballenghien,M., Faivre,N. and Galtier,N. (2017) Patterns of
(2019) Screening human cell lines for viral infections applying cross-contamination in a multispecies population genomic project:
Downloaded from https://academic.oup.com/nargab/article/3/3/lqab058/6308460 by guest on 12 July 2021
RNA-seq data analysis. PLoS One, 14, e0210404. detection, quantification, impact, and solutions. BMC Biol., 15, 25.
23. Rufflé,F., Audoux,J., Boureux,A., Beaumeunier,S., Gaillard,J.-B., 38. Rubinoff,D. and Holland,B.S. (2005) Between two extremes:
Bou Samra,E., Megarbane,A., Cassinat,B., Chomienne,C., Alves,R. mitochondrial DNA is neither the panacea nor the nemesis of
et al. (2017) New chimeric RNAs in acute myeloid leukemia. phylogenetic and taxonomic inference. Syst. Biol., 54, 952–961.
F1000Res., 6, https://doi.org/10.12688/f1000research.11352.2. 39. Hebert,P. D.N., Cywinska,A., Ball,S.L. and deWaard,J.R. (2003)
24. Prensner,J.R., Iyer,M.K., Balbin,O.A., Dhanasekaran,S.M., Cao,Q., Biological identifications through DNA barcodes. Proc. R. Soc. Lond.
Brenner,J.C., Laxman,B., Asangani,I.A., Grasso,C.S., B: Biol. Sci., 270, 313–321.
Kominsky,H.D. et al. (2011) Transcriptome sequencing across a 40. Riquier,S., Mathieu,M., Bessiere,C., Boureux,A., Ruffle,F.,
prostate cancer cohort identifies PCAT-1, an unannotated lincRNA Lemaitre,J.-M., Djouad,F., Gilbert,N. and Commes,T. (2021) Long
implicated in disease progression. Nat. Biotechnol., 29, 742–749. non-coding RNA exploration for mesenchymal stem cell
25. Olarerin-George,A.O. and Hogenesch,J.B. (2015) Assessing the characterisation. BMC Genomics, 22. 412.
prevalence of mycoplasma contamination in cell culture via a survey 41. Mangul,S., Yang,H.T., Strauli,N., Gruhl,F., Porath,H.T., Hsieh,K.,
of NCBI’s RNA-seq archive. Nucleic Acids Res., 43, 2535–2542. Chen,L., Daley,T., Christenson,S., Wesolowska-Andersen,A. et al.
26. Mangul,S., Martin,L.S., Hill,B.L., Lam,A.K.-M., Distler,M.G., (2018) ROP: dumpster diving in RNA-sequencing to find the source
Zelikovsky,A., Eskin,E. and Flint,J. (2019) Systematic benchmarking of 1 trillion reads across diverse adult human tissues. Genome Biol.,
of omics computational tools. Nat. Commun., 10, 1393. 19, 36.
27. Cáceres,A., Jene,A., Esko,T., Pérez-Jurado,L.A. and González,J.R. 42. Mandric,I., Rotman,J., Yang,H.T., Strauli,N., Montoya,D.J., Van
(2020) Extreme downregulation of chromosome Y and cancer risk in Der Wey,W., Ronas,J.R., Statz,B., Yao,D., Petrova,V. et al. (2020)
men. J. Natl Cancer Inst., 112, 913–920. Profiling immunoglobulin repertoires across multiple human tissues
28. Cui,P., Lin,Q., Ding,F., Xin,C., Gong,W., Zhang,L., Geng,J., using RNA sequencing. Nat. Commun., 11, 3126.
Zhang,B., Yu,X., Yang,J. et al. (2010) A comparison between 43. Marchet,C., Boucher,C., Puglisi,S.J., Medvedev,P., Salson,M. and
ribo-minus RNA-sequencing and polyA-selected RNA-sequencing. Chikhi,R. (2021) Data structures based on k-mers for querying large
Genomics, 96, 259–265. collections of sequencing datasets. Genome Research, 31, 1–12.
29. McLaughlin-Drubin,M.E. and Munger,K. (2008) Viruses associated 44. Patro,R., Mount,S.M. and Kingsford,C. (2014) Sailfish enables
with human cancer. Biochim. Biophys. Acta, 1782, 127–150. alignment-free isoform quantification from RNA-seq reads using
30. Sangiovanni,M., Granata,I., Thind,A.S. and Guarracino,M.R. lightweight algorithms. Nat. Biotechnol., 32, 462–464.
(2019) From trash to treasure: detecting unexpected contamination in 45. Zhang,Z. and Wang,W. (2014) RNA-Skim: a rapid method for
unmapped NGS data. BMC Bioinformatics, 20, 168. RNA-seq quantification at transcript level. Bioinformatics, 30,
31. Bhuvaneshwar,K., Song,L., Madhavan,S. and Gusev,Y. (2018) i283–i292.
viGEN: an open source pipeline for the detection and quantification 46. Silvester,N., Alako,B., Amid,C., Cerdeño-Tarrága,A., Clarke,L.,
of viral RNA in human tumors. Front. Microbiol., 9, 1172. Cleland,I., Harrison,P.W., Jayathilaka,S., Kay,S., Keane,T. et al.
32. Wood,D.E., Lu,J. and Langmead,B. (2019) Improved metagenomic (2018) The European Nucleotide Archive in 2017. Nucleic Acids Res.,
analysis with Kraken 2. Genome Biol., 20, 257. 46, D36–D40.
33. Flygare,S., Simmon,K., Miller,C., Qiao,Y., Kennedy,B., Di Sera,T.,
Graf,E.H., Tardif,K.D., Kapusta,A., Rynearson,S. et al. (2016)You can also read