ASTRONOMICAL DETECTION OF A RADIOACTIVE MOLECULE 26ALF IN A REMNANT OF AN ANCIENT EXPLOSION - ALMA OBSERVATORY
←
→
Page content transcription
If your browser does not render page correctly, please read the page content below

Astronomical detection of a radioactive molecule 26AlF in a remnant
                      of an ancient explosion
           Tomasz Kamiński1*, Romuald Tylenda2, Karl M. Menten3, Amanda Karakas4,
    Jan Martin Winters5, Alexander A. Breier6, Ka Tat Wong5, Thomas F. Giesen6, Nimesh A. Patel1
1
  Harvard-Smithsonian Center for Astrophysics, MS 78, 60 Garden Street, Cambridge, MA 02138, USA
2
  Department for Astrophysics, N. Copernicus Astronomical Center, Rabiańska 8, 87-100, Toruń, Poland
3
  Max-Planck Institut für Radioastronomie, Auf dem Hügel 69, 53121 Bonn, Germany
4
  Monash Centre for Astrophysics, School of Physics and Astronomy, Monash University, VIC 3800, Australia
5
  IRAM, 300 rue de la Piscine, Domaine Universitaire de Grenoble, 38406, St. Martin d’Héres, France
6
  Laborastrophysik, Institut für Physik, Universität Kassel, Heinrich-Plett-Straße 40, Kassel, Germany
*Correspondence to: tkaminsk@cfa.harvard.edu

Decades ago, γ-ray observatories identified diffuse Galactic emission at 1.809 MeV (1-3)
originating from β+ decays of an isotope of aluminium, 26Al, that has a mean-life time of 1.04
million years (4). Objects responsible for the production of this radioactive isotope have
never been directly identified, owing to insufficient angular resolutions and sensitivities of
the γ-ray observatories. Here, we report observations of millimetre-wave rotational lines of
the isotopologue of aluminium monofluoride that contains the radioactive isotope (26AlF).
The emission is observed toward CK Vul which is thought to be a remnant of a stellar merger
(5-7). Our constraints on the production of 26Al combined with the estimates on the merger
rate make it unlikely that objects similar to CK Vul are major producers of Galactic 26Al.
However, the observation may be a stepping stone for unambiguous identification of other
Galactic sources of 26Al. Moreover, a high content of 26Al in the remnant indicates that prior
to the merger, the CK Vul system contained at least one solar-mass star that evolved to the
red giant branch.

Historic records (8,9) show that CK Vul or Nova 1670 underwent an unusual outburst in 1670-
1672. It was similar to outbursts of objects known as red novae which erupt in a stellar merger
after which they cool off to low temperatures (10, 11). In this cool phase they produce large
amounts of molecular gas and dust. CK Vul was recently discovered to be associated with a
significant amount of dust and molecular gas, as well (12). What distinguishes CK Vul, even
among red novae, is a high abundance of isotopes that are rare in matter of normal cosmic
composition (5,12). In particular, our discovery of 26AlF in four rotational transitions (Methods)
is the first firm detection of a radioactive molecule in any astronomical object, although numerous
attempts to detect 26AlF have been made in the past (13-15). The unstable nucleus of 26Al is
virtually absent in solar-composition objects and has a modest abundance of 10-5 with respect to
27
   Al in the Galactic interstellar medium whereas in CK Vul it is only ∼7 times less abundant than
the stable isotope 27Al (Methods).
         The molecular remnant of CK Vul was discovered at millimeter wavelengths in rotational
emission lines from a large variety of molecules (5,12). Imaging has shown that CO emission
region has an extent of ~13" and a morphology of bipolar lobes and a torus-like feature which all
are located at a center of a much larger (71") bipolar optical nebula of recombining plasma (5,16).
The main AlF emission is observed in a small region of a full-width at half maximum size of
1.80(±0.05)×0.84(±0.06) arcsec, with the major axis at a position angle of 60°(±1°), and centered
close to the radio-continuum source of CK Vul (16). At a distance of 0.7 kpc (17), the maximum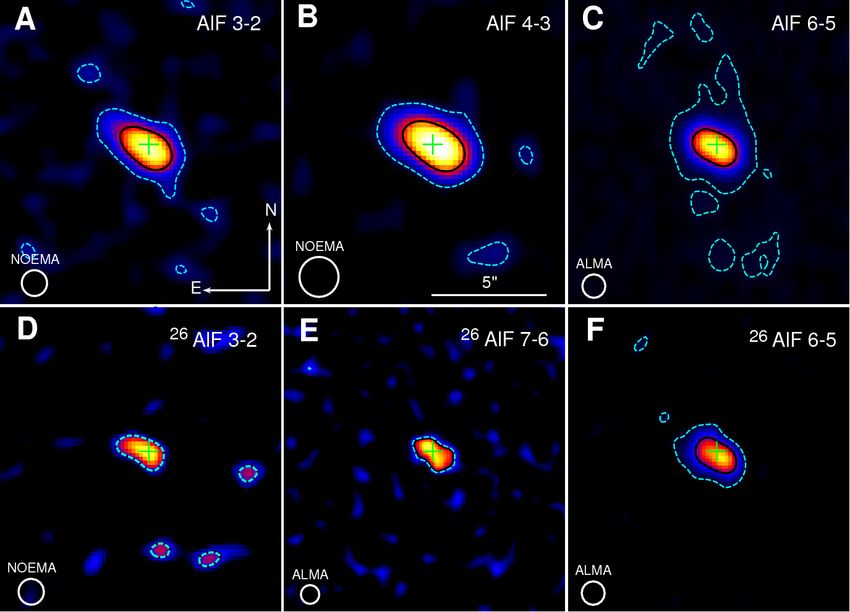
extent corresponds to an e-folding radius of 430 AU. The AlF emission appears as a pair of two
axisymmetric and collimated streams emanating from the center of the remnant and heading
towards the east-northern and west-southern walls of lobes seen in CO and continuum dust
emission (Fig. 1). Additionally, our most sensitive observations trace weak 27AlF emission, at a
level of 3% of the peak, within the lobes out to a radius of 5.5 arcsec. The emission lines have an
intrinsic full width of ~140 km/s, smaller than that of most other species observed in this source
(12). The north-eastern part of the AlF region contributes most to the redshifted emission and the
opposite side dominates the blueshifted emission, consistent with the overall kinematics of the
molecular remnant.
         Amongst all the molecular species that have been mapped thus far in CK Vul (examples of
which are shown in Methods Fig. M1; see also Methods Table M3), the AlF emission has a unique
distribution. That we observe the radioactive molecule of 26AlF only in a small region of the
remnant is likely a chemical effect related to the formation and destruction of AlF. Observations
of the AlF molecule in circumstellar media are rare but suggest that AlF forms close to stellar
photospheres, i.e. at relatively high densities (18 ,19). Shocks and dust sputtering were also
considered as a source of AlF (20). None of the scenarios can be excluded for CK Vul. The
synthesis of AlF is likely limited by the elemental abundance of fluorine, not aluminum (18). The
remnant can therefore contain other atomic and molecular forms of aluminum, some possibly
depleted into dust. Thus, our AlF observations constrain only a lower limit on the content of 26,27Al
in CK Vul. A search of other likely molecular carriers of aluminum, e.g. of AlCl, AlO, AlOH, and
AlCN, has been performed (12) but none has been detected, suggesting a small reservoir of Al-
bearing molecules other than AlF. On the other hand, a contribution from atomic Al to the
recombining nebula may be significant. There are currently no observations that could be used to
verify whether atomic aluminum is present. Based on the excitation analysis presented in Methods,
we derive a total mass of the observed 26Al of (3.4±1.8)×1024 g, equivalent to about a quarter of
the mass of Pluto.
         The 26Al isotope is produced in the Mg-Al cycle in hydrogen burning via the 25Mg(p, γ)26Al
reaction which requires temperatures above 30 ∙ 10( K (21). It is thought to be efficiently produced
in a variety of stars, including: classical novae with O-Mg-Ne white dwarfs; Wolf-Rayet stars;
core-collapse supernovae; and asymptotic-giant-branch (AGB) stars that experienced hot bottom
burning (3, 22). The progenitor of CK Vul was neither of these objects (5, 17, 23). However, more
ordinary low-mass stars can produce 26Al as well. The 26Al synthesis takes place on the red giant
branch (RGB) when hydrogen is burnt in a shell surrounding a helium core. Our model simulations
(30; Methods) show that the most favorable conditions for producing 26Al occur when a star
develops a condensed degenerate core, i.e. for initial stellar masses 0.8-2.5 *⨀ . The 26Al isotope
is then deposited in a narrow outermost layer of the He core (Fig. 2). In a single RGB star, envelope
convection never reaches the He core and therefore there is no way to dredge 26Al up to the stellar
surface (and disperse it into the circumstellar and interstellar media). However, if the star is in a
binary system and collides with a companion, matter from interiors of both stars can be mixed and
ejected into the circumstellar medium. In particular, if the companion has a condensed core, the
26
   Al-rich outer layers of the He core of the RGB primary can be disrupted and exposed to
eventually form a remnant such as that of CK Vul. Only a small portion of the available 26Al would
have to be dispersed to explain the observed mass of 26Al and the aluminum isotopic ratio measured
in CK Vul. Our calculations show that stars of 0.8-2.5 *⨀ store a few times 1027 g of 26Al in the
outermost layers of the He core, i.e. a factor of 1000 more than that found in CK Vul. Given this
result and other observational constrains, a merger of two low-mass stars with at least one being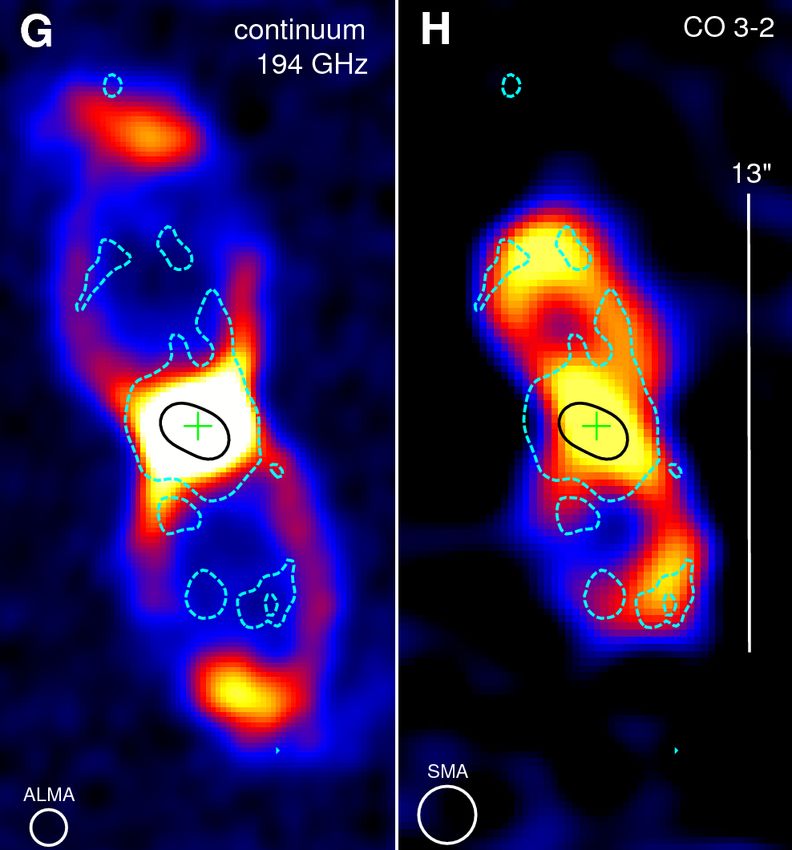
on the RGB is the most likely scenario to explain CK Vul. Population-synthesis studies indeed
indicate that low-mass binaries evolving off the main sequence to the RGB (and with orbital
periods of 1-30 days) have a high chance to merge (24,25).
        The 26Al decays are followed by emission of energetic positrons which may be an
important local ionization source in CK Vul. Following Glassgold (26), our results suggest a 26Al-
induced ionization rate of 2.0·10-16 s-1 per H nucleus for CK Vul. This is a lower limit considering
that the derived 26Al mass is a lower limit and we adopted the solar elemental abundance for an
object where aluminum is likely enhanced (12). The derived rate is the same as the typical
ionization rate by cosmic rays in the Galactic disk (27). The regions of strong emission in the two
ions, N2H+ and HCO+, which were observed in CK Vul simultaneously with AlF, are more
extended than that of 26AlF (Methods Fig. M1) suggesting that additional ionization mechanisms
must be active in the remnant. It is possible that atomic forms of the radioactive nuclide of Al
extend and ionize the remnant beyond the region traced in 26AlF emission or that other radioactive
species are present in the remnant.
        From the intensity of the 1.8 MeV line, it was estimated that all Galactic sources produce
1-3 *⨀ of 26Al every 1 million yr (1, 2, 28). With our estimates on the 26Al mass in CK Vul, one
would need ~1100 mergers like CK Vul going off every year to explain the entire Galactic content
of 26Al. This figure is unrealistic as current rates of red novae suggest 1–2 such energetic transients
per decade (25) and the rates are probably even lower for eruptions more characteristic of CK Vul
(7). On the other hand, if the mass of 26Al in CK Vul is underestimated by a factor of 1100 – e.g.
by not accounting for 26Al present in the atomic phase, other molecules, and solids – objects like
CK Vul may be important contributors to the Galactic production of this radioactive nuclide. More
observations and realistic models of the ionization and chemical structure of the remnant are
necessary to investigate this issue further.
        The 1.8 MeV emission arising from 26Al decays is hardly absorbed by interstellar or
circumstellar matter (26) and easily escapes from the compact 26AlF region, even though it is
heavily obscured by dust and gas (Fig. 1). Using our 26AlF observational constraints as a lower
limit on the 26Al content in CK Vul, we calculate that the 26Al decay line has a flux of ≳1.6∙10-10
cm-2 s-1, much below the sensitivity limit of the contemporary SPectrometer on INTEGRAL (SPI;
~10-5 cm-2 s-1 in a 106 s integration) (29). At such low estimated flux, it will be challenging to
detect the 1.8 MeV line from CK Vul and probably from any other single stellar source even with
future more sensitive γ-ray instruments. The case of CK Vul illustrates, however, that millimeter-
wave spectroscopy, utilizing Atacama Large Millimeter/submillimeter Array (ALMA) and
Northern Extended Millimeter Array (NOEMA), can now be used to study Galactic sources of
radioactive nuclides, provided they produce molecules. Modern interferometer arrays not only can
detect but also spatially identify discrete objects which are actively enhancing the Galaxy in 26Al.
Because observations of molecules yield relatively easily the isotopologue (and thus isotopic)
ratios, not available through γ-ray observations, millimeter-wave spectroscopy has also the
potential to better identify the nucleosynthesis processes that lead to the Galactic 26Al production.

   1. Mahoney, W. A., Ling, J. C., Jacobson, A. S. & Lingenfelter, R. E. Diffuse galactic gamma-
       ray line emission from nucleosynthetic Fe-60, Al-26, and Na-22 - Preliminary limits from
       HEAO 3. The Astrophysical Journal 262, 742 (1982).
   2. Mahoney, W. A., Ling, J. C., Wheaton, W. A. & Jacobson, A. S. HEAO 3 discovery of Al-
       26 in the interstellar medium. The Astrophysical Journal 286, 578 (1984).
3. Diehl, R., et al. COMPTEL observations of Galactic 26Al emission. Astronomy and
Astrophysics 298, 445 (1995).
4. Samworth, E. A., Warburton, E. K. & Engelbertink, G. A. P. Beta Decay of the 26Al Ground
State. Physical Review C 5, 138–142 (1972).
5. Kamiński, T. et al. Nuclear ashes and outflow in the eruptive star Nova Vul 1670. Nature
520, 322–324 (2015).
6. Kato, T. CK Vul as a candidate eruptive stellar merging event. Astron. Astrophys. 399, 695-
697 (2003).
7. Tylenda, R. et al., OGLE-2002-BLG-360: from a gravitational microlensing candidate to an
overlooked red transient. Astron. Astrophys. 555, A16 (2013).
8. Hevelius, J. An Extract of a Letter, Written to the Publisher by the Excellent Johannes
Hevelius, Concerning, His Further Observations of the New Star Near the Beak of the
Swan. Philosophical Transactions of the Royal Society of London Series I 6, 2197 (1671)
9. Shara, M. M., Moffat, A. F. J., Webbink, R. F. Unraveling the oldest and faintest recovered
nova - CK Vulpeculae (1670). Astrophys. J. 294, 271-285 (1985).
10. Tylenda, R. & Soker, N. Eruptions of the V838 Mon type: stellar merger versus nuclear
outburst models. Astronomy & Astrophysics 451, 223–236 (2006).
11. Tylenda, R. et al., V1309 Scorpii: merger of a contact binary. Astron. Astrophys. 528,
AA114 (2011).
12. Kamiński, T. et al. Organic molecules, ions, and rare isotopologues in the remnant of the
stellar-merger candidate, CK Vulpeculae (Nova 1670). Astronomy & Astrophysics (2017).
13. Oberlack, U. et al. COMPTEL limits on 26Al 1.809 MeV line emission from -2 Velorum.
Astronomy and Astrophysics 353, 715-721 (2000).
14. Guelin, M. et al. Nucleosynthesis in AGB stars: Observation of 25Mg and 26Mg in
IRC+10216 and possible detection of 26Al. Astronomy and Astrophysics 297, 183-196
(1995).
15. Banerjee, D. P. K et al. A Search for Radioactive26Al in the Nova-like Variable V4332
Sagittarii. The Astrophysical Journal 610, (2004).
16. Hajduk, M., et al., The enigma of the oldest `nova': the central star and nebula of CK Vul.
Mon. Not. R. Astron. Soc. 378, 1298-1308 (2007).
17. Hajduk, M., van Hoof, P.A.M., and Zijlstra, A.A., CK Vul: evolving nebula and three
curious background stars. Mon. Not. R. Astron. Soc. 432, 167-175 (2013).
18. Highberger, J. L., Savage, C., Bieging, J. H. & Ziurys, L. M. Heavy-Metal Chemistry in
Proto–Planetary Nebulae: Detection of MgNC, NaCN, and AlF toward CRL 2688. The
Astrophysical Journal 562, 790–798 (2001).
19. Agúndez, M. et al. Molecular abundances in the inner layers of IRC 10216. Astronomy &
Astrophysics 543, (2012).
20. Andreazza, C. M. & Almeida, A. A. D. The formation of AlF by radiative association.
Monthly Notices of the Royal Astronomical Society 437, 2932–2935 (2013).
21. Arnould, M., Goriely, S., Jorissen, A. Non-explosive hydrogen and helium burnings:
abundance predictions from the NACRE reaction rate compilation. Astronomy and
Astrophysics 347, 572-582 (1999).
22. Karakas, A. & Lattanzio, J. C. Stellar Models and Yields of Asymptotic Giant Branch
Stars. Publications of the Astronomical Society of Australia 24, 103–117 (2007).
23. Evans, A., et al. CK Vul: a smorgasbord of hydrocarbons rules out a 1670 nova (and much
else besides). Monthly Notices of the Royal Astronomical Society 457, 2871-2876 (2016).24. Politano, M., Sluys, M. V. D., Taam, R. E. & Willems, B. Population Synthesis Of
Common Envelope Mergers. I. Giant Stars With Stellar Or Substellar Companions. The
Astrophysical Journal 720, 1752–1766 (2010).
25. Kochanek, C. S., Adams, S. M. & Belczynski, K. Stellar mergers are common. Monthly
Notices of the Royal Astronomical Society 443, 1319–1328 (2014).
26. Glassgold, A. E. 26Al and circumstellar envelopes. The Astrophysical Journal 438, (1995).
27. Indriolo, N., et al. Herschel Survey of Galactic OH+, H2O+, and H3O+: Probing the
Molecular Hydrogen Fraction and Cosmic-Ray Ionization Rate. The Astrophysical Journal
800, 40, (2015).
28. Diehl, R. et al. Radioactive 26Al from massive stars in the Galaxy. Nature 439, 45–47
(2006).
29. Diehl, R., et al. INTEGRAL gamma-ray line spectroscopy, ArXiv 1710.10139 (2017); see
also http://integral.esac.esa.int/integ_payload_spectro.html
30. Karakas, A. I. & Lugaro, M. Stellar Yields From Metal-Rich Asymptotic Giant Branch
Models. The Astrophysical Journal 825, 26 (2016).
31. Hedderich, H. G. & Bernath, P. F. The infrared emission spectrum of gaseous AlF. Journal
of Molecular Spectroscopy 153 (1-2), 73–80. DOI: 10.1016/0022-2852(92)90458-Z (1992)
32. Hoeft, J., Lovas, F., Tiemann, E., et al. Microwave Absorption Spectra of AlF, GaF, InF,
and TIF. Zeitschrift für Naturforschung A, 25 (7), 1029–1035. DOI:10.1515/zna-1970-
0706 (2014)
33. Lide, D. R. High-Temperature Microwave Spectroscopy. AlF and AlCl. The Journal of
chemical physics 42 (3), 1013–1018. DOI: 10.1063/1.1696035 (1965)
34. Western, C. M. PGOPHER: A program for simulating rotational, vibrational and electronic
spectra. Journal of Quantitative Spectroscopy and Radiative Transfer 186, 221–242. DOI:
10.1016/j.jqsrt.2016.04.010 (2017)
35. McMullin, J. P., Waters, B., Schiebel, D., Young, W. & Golap, K. CASA Architecture
and Applications. In Shaw, R. A., Hill, F. & Bell, D. J. (eds.) Astronomical Data Analysis
Software and Systems XVI 376, Astron. Society of the Pacific Conf. Series, 127 (2007).
36. Foreman-Mackey, D. et al. emcee: The MCMC Hammer. PASP 125 306 (2013)
37. Goodman, J. & Weare, J. Ensemble samplers with affine invariance. Communications in
Applied Mathematics and Computational Science 5 (1), 65–80 (2010)
38. Goldsmith, P. F. & Langer, W. D. Population Diagram Analysis of Molecular Line
Emission. The Astrophysical Journal 517, 209–225 (1999)
39. Gotoum, N., Hammami, K., Owono Owono, L. C. & Jaidane, N.-E. Collision induced
rotational excitation of AlF (X 1Σ ) by para-H2 (j=0). Astrophysics and Space Science 337,
553–561 (2011)
40. Gotoum, N. et al. Rotational excitation of aluminium monofluoride (AlF) by He atom at
low temperature. Astrophysics and Space Science 332, 209–217 (2010)
41. Lattanzio, J. C. The asymptotic giant branch evolution of 1.0-3.0 solar mass stars as a
function of mass and composition. The Astrophysical Journal 311, 708 (1986).
42. Karakas, A. I. Helium enrichment and carbon-star production in metal-rich populations.
Monthly Notices of the Royal Astronomical Society 445, 347–358 (2014).
43. Dunham, J. L. The Energy Levels of a Rotating Vibrator. Phys. Rev. 41: 721–731 (1932).
44. Young, P.A. et al. Observational Tests and Predictive Stellar Evolution, The Astrophysical
Journal 556, 230 (2001).45. Lutz, J. J. & Hutson, J. M. Deviations from Born-Oppenheimer mass scaling in
spectroscopy and ultracold molecular physics. Journal of Molecular Spectroscopy 330
(2016)
Acknowledgments. We are grateful to the directors K. Schuster, P. Cox, S. Dougherty, T. van
Zeeuw, R. Blundell, and T. Beasley for granting us discretionary time at NOEMA, ALMA, APEX,
SMA, and JVLA. T.K. thanks L. Matrá for an introduction to MCMC methods. R.T. acknowledges
a support from grant 2017/27/B/ST9/01128 financed by the Polish National Science Centre.
A.A.B. and T.F.G. acknowledge funding through the DFG priority program 1573 (Physics of the
Interstellar Medium) under grant GI 319/3-1 and GI 319/3-2, and the University of Kassel through
P/1052 Programmlinie "Zukunft". K.T.W. acknowledges support from the International Max
Planck Research School (IMPRS) for Astronomy and Astrophysics at the Universities of Bonn
and Cologne and also by the Bonn-Cologne Graduate School of Physics and Astronomy (BCGS).
This study made use of Atacama Pathfinder Experiment (APEX), which is a collaboration
between the Max-Planck-Institut für Radioastronomie, the European Southern Observatory, and
Onsala Space Observatory. Part of APEX data were collected under the programs 095.F-9543(A)
and 296.D-5009(A). This paper makes use of the following ALMA data:
ADS/JAO.ALMA#2015.A.00013.S and #2017.A.00030.S. ALMA is a partnership of ESO
(representing its member states), NSF (USA) and NINS (Japan), together with NRC (Canada) and
NSC and ASIAA (Taiwan) and KASI (Republic of Korea), in cooperation with the Republic of
Chile. The Joint ALMA Observatory is operated by ESO, AUI/NRAO and NAOJ. The National
Radio Astronomy Observatory is a facility of the National Science Foundation operated under
cooperative agreement by Associated Universities, Inc. The IRAM 30m observations were carried
out under projects 183-14, 161-15, and D07-14 and these with NOEMA under W15BN, E15AE,
S16AV, and E16AC. IRAM is supported by INSU/CNRS (France), MPG (Germany) and IGN
(Spain). The IRAM observations were supported by funding from the European Commission
Seventh Framework Programme (FP/2007-2013) under grant agreement No 283393 (RadioNet3).
Author Contributions. T.K. wrote the text and analysed the observations. A.A.B. and T.F.G
prepared the spectroscopic data used in this study. J.M.W. prepared, executed, and calibrated the
NOEMA observations. KT.W. prepared and reduced the JVLA observations. T.K. prepared and
reduced the ALMA and all single-dish observations. N.P. prepared and calibrated the SMA
observations. R.T. and A.K. ran stellar-evolution models. All authors contributed to the
interpretation of the data.Fig. 1. Maps of molecular emission of 26,27AlF. Panels A-F show images and contours of emission in different transitions of 27AlF (A-C) and 26AlF (D-F), as indicated in each panel. Black contour is drawn at half the peak flux and the dashed cyan contour represents emission at the 3s level. The contours overlap in panels D and E. In panels G-H, we compare the AlF 6-5 contours (from panel C) to the map of continuum emission (G) and that of CO 3-2 (H). All the colour images show flux in different linear scales. The cross indicates the position of the radio source.
Fig. 2. Mass-abundance profiles of He, 26Al, and 27Al in a model of a 1 *⨀ star at the tip of the
RGB. The abundance of He (blue line) defines the extent of the He core and the H envelope which
are indicated in the plot. The abundances of 26Al (red shaded area) 27Al (green dashed line) were
scaled by a factor of 104.

METHODS

Spectroscopic data for AlF isotopologues. The identification and analysis of the pure rotational
emission of 26AlF and 27AlF was based on spectroscopic data prepared in this study. For 27AlF, we
used mass-scaled Dunham parameters and hyperfine constants derived from laboratory
measurements (31). Accurate line positions of 26AlF were calculated through the mass-scaled
Dunham parameters of 27AlF. We used fourth-order correction terms to derive positions of
hyperfine components with an accuracy better than 1 MHz. The hyperfine splitting of 26AlF is
more complex than that of 27AlF owing to a twice larger nuclear spin (I=5). To derive the hyperfine
structure for 26AlF, we used higher-order Dunham corrections and scaled accordingly the 26Al
electric quadrupole moment Q (ref. 32) and the magnetic coupling parameter cI with the nuclear
gN factor. A permanent dipole moment of µ=1.53 D (ref. 33) was adopted for both isotopologues.
The spectroscopic constants we used to generate the line lists are given in Table M1. Line
frequencies, energies of the rotational levels above the ground (Eu), line strengths (Sulµ2), and
partition functions were derived using pgopher (34). The method of our calculations is similar to
that used in earlier studies of rotational spectra of 26AlF (14).
Spectroscopic laboratory studies of rare radioactive materials such as 26AlF would be very
challenging. Although laboratory measurements are usually needed to unambiguously identify
complex molecules, it is not necessary for simple di-atomic species, especially for most
astronomical applications. For di-atomic molecules and within the Born-Oppenheimer
approximation, the mass dependence of spectra can be separated from that of the bond length. The
underlying theory was developed by Dunham in 1932 (43) and has been successfully applied to
many molecules. The spectra of diatomic molecules of identical bond length differ only in the
mass scaling factors which are known to a high accuracy. Measurements for one isotopic species,
e.g. 27Al19F, are thus sufficient to determine spectra of other isotopologues, e.g. 26Al19F. High-
precision measurements of different isotopologues can show how accurate this approximation is
and higher order corrections, if necessary, can be added. The corrections are often insignificant, in
particular they are typically much smaller than the accuracy of astronomical observations (45).
Our calculations included these corrections but they turned out to be negligible in case of the
studied source whose line widths are of ~140 km/s.
        Because the AlF lines are so intrinsically broad in CK Vul, their hyperfine structure is
unresolved in most of our observations. As shown in Fig. M1, the hyperfine splitting is highest in
the J=1-0 transition which was however observed at insufficient sensitivity to reveal the hyperfine
structure (and is degraded in resolution in the figure). For both isotopologues, the hyperfine
splitting caused by the 19F nucleus is negligible. The full spectroscopic data which include the
hyperfine splitting of 26Al19F and uncertainties in line positions are available online
(goo.gl/uMV1h9). In our analysis, we often used the intensity-weighted mean frequency and the
sum of line strengths Sulµ2 to represent the position and strength of a given transition, respectively.
The centroid line frequencies and line strengths used in the analysis are given in Table M2.

Single-dish observations. The presence of 27AlF in CK Vul was revealed in the line survey
obtained with the IRAM 30 m and Atacama Pathfinder Experiment 12 m (APEX) telescopes in
2014-2017 (12). The survey provided measurements of 27AlF emission in the following transitions:
J=3-2, 4-3, 5-4, and 6-5. Additionally, the 7-6 transition was covered by IRAM 30m spectra but it
overlaps with a much stronger line of CO J=2-1and its flux could not be reliably measured. Two
other lines of 27AlF, i.e. J=8-7 and 9-8, were covered but not detected. Their upper 5. limits and
fluxes of the other detected lines are given in Table M2.
        Most of the corresponding transitions of 26AlF were also covered in the survey. We find a
weak spectral feature at the expected location of 26AlF 3-2 but the emission line partially overlaps
with a broader instrumental feature (12). The 4-3 line is also visible and it partially overlaps with
the J,Ka,Kc=8,2,6-8,1,7 line of SO2 (see below). Only rough flux constraints on the 26AlF 4-3
emission could be obtained from this blending feature. The J=5-4 transition of 26AlF overlaps with
a much stronger line of H13C15N 2-1 and the flux contribution of 26AlF could not be assessed.
Another covered line, J=7-6, appears to be clear of any contamination but is seen at a modest ~3.
level. All other lines are below our sensitivity limits. The three 26AlF features, i.e. J=3-2, 4-3, and
7-6, are observed at a modest signal-to-noise ratio (S/N) and their observations alone constitute
only a tentative indication of the presence of 26AlF in CK Vul. The three features, however,
provided a strong incentive to repeat the observations with more sensitive interferometers.

Interferometric observations. The sensitive observations of both AlF isotopologues were
obtained with JVLA, NOEMA, and ALMA. The interferometric observations are summarized in
Table M3. The line fluxes are given in Table M2. The following transitions were observed:
• The J=1-0 transitions of 26AlF and 27AlF were covered by a Ka-band spectrum obtained
with the Karl G. Jansky Very Large Array (JVLA) in the DnC configuration. The lowest
transition of AlF has a significant hyperfine splitting which is comparable to the intrinsic
line width of AlF emission (Fig. 1A). This extra broadening makes the line peak intensity
lower and harder to detect than for lines at higher frequencies. Only after smoothing the
spectrum to a resolution comparable to the hyperfine splitting is the emission of 27AlF 1-0
apparent (Fig. M1A). This transition should be considered as only tentatively detected. The
flux of the line is at a 2–5s level, which is insufficient to provide a good-quality map of
the 27AlF 1-0 emission. In order to extract the spectrum, we used an aperture defined in
maps of 27AlF 3-2 from NOEMA. The 26AlF 1-0 emission is not detected in the JVLA data,
consistent with the isotopologue ratio derived in this study.
• The J=3-2 transition of both AlF isotopologues was observed with the emerging NOEMA
interferometer. Observations were obtained in 2016 and 2017 with 7 and 8 antennas,
respectively. The WideX correlator was used. Both transitions are detected and their
emission regions resolved with a beam of ~0.78 arcsec. At this angular resolution, the peak
S/N of the two emission regions is 24 and 5 (and higher for source-averaged fluxes).
• The J=4-3 transitions were observed with 6 antennas of NOEMA and with WideX. The
27
AlF emission region is marginally resolved by the beam of ~1.64 arcsec. The 27AlF
emission may be contaminated by the HNCO (6,0,6-5,0,5) line whose rest frequency is
29.7 km/s away from that of 27AlF 4-3. The separation is smaller than the full width at half
maximum (FWHM) of the observed feature of 40.8 km/s. An excitation model of HNCO
based on the single-dish survey (12) implies that less than 6% of the total flux of the
observed feature may come from HNCO. However, the accuracy of this model is modest
and the model does not take into account the potential difference in spatial distributions of
HNCO and AlF emission. The characteristics of the emission region ascribed here to 27AlF
4-3 are the same as these of other AlF transitions and do not indicate any sign of
contamination. We therefore neglect the potential contribution from HNCO and interpret
the total flux of the emission feature as that of 27AlF 4-3. The corresponding 26AlF 4-3
transition is detected by NOEMA but blends partially with the SO2 8,2,6-8,1,7 line whose
rest frequency is blueshifted by 55.9 km/s with respect to the 26AlF line. Interferometric
ALMA imaging of another line of SO2, 4,2,2-3,1,3, shows that the extent of the emission
region of SO2 is similar to that of AlF (Fig. 1) and therefore the relative contribution of the
two species to the blend cannot be disentangled based on spatial information only. The
kinematic separation of the SO2 and 26AlF lines is however wide enough to perform a
deblending procedure in which the best-fitting combination of two Gaussian components
gives the line characteristics. The line centers were fixed while the amplitudes and widths
were free parameters in this /2 minimization procedure. The results are shown in Fig. M1
H-J and the flux of 26AlF 4-3 is given in Table M2. The flux of the SO2 line is 2.34 times
higher than that of 26AlF.
• Both isotopologues were observed with ALMA in the J=6-5 lines located in ALMA Band
5. These are the most recent observations (April 2018) and provided us with spectra and
maps of the best sensitivity. At a beam size of 1.4´1.1 arcsec (at natural weighting), both
emission regions are resolved and their peaks are observed at S/Ns of 170 and 33 (the
source-averaged fluxes give even higher S/Ns).
• The J=7-6 transition of both isotopic species was observed with ALMA in Band 6. Both
lines are observed at a high S/N and are well resolved with a 0.8 arcsec beam. The 27AlFline overlaps with a broad wing of an intense line of CO 2-1. The location of the 27AlF 7-
6 line corresponds to a velocity of 333 km/s with respect to the center of the CO 2-1
emission. At this velocity, the CO emission is relatively faint and extended, i.e. most of the
CO emission is spread over a region of a radius of ~6 arcsec from the center of the
molecular remnant. Our maps of AlF transitions, including the map of 26AlF 7-6 from the
same ALMA dataset, show that the AlF emission is enclosed within a radius of 1.05 arcsec.
Hence, by extracting the signal within the AlF emission region defined in other
observations, we minimized the contamination from the CO emission. Furthermore, the
spectrum extracted within the AlF emission region reveals that the 27AlF 7-6 transition
partially overlaps with an emission feature which we tentatively identify as a transition of
methylamine, CH3NH2 3,2,4-3,1,5, whose rest frequency is 140 km/s away from that of
27
AlF 7-6. To measure the pure flux of 27AlF 7-6, we replaced the small contaminated part
of its original profile by the mirrored unaffected wing, as shown in Fig. M1 (panel F). A
flux measured in such a modified profile is given in Table M2.
The line positions, line widths, sizes and shapes of the emission regions are consistent between
the different transitions leaving no doubt about their identification as 27AlF and 26AlF. In particular,
the consistency in the spatial distribution of the emission assigned to 26AlF with that of 27AlF
indicates that it must be an isotopologue of AlF – no other species observed in CK Vul has a spatial
distribution identical to that of AlF, what is illustrated in Fig. 1. The uncertainty in the calculated
positions of the 26AlF lines of ~1 MHz is insignificant compared to the observed linewidths of
approximately 50-120 MHz and the predicted line positions are in excellent agreement with the
centers of the emission lines assigned to 26AlF (in the rest frame of the object). The match between
the calculated and observed line positions of 26AlF are as good as for 27AlF (Fig. M1), whose
rotational spectra were measured in a laboratory. Also, within the observation errors, the line
intensities of 26AlF are consistent with excitation under thermal equilibrium conditions and the
excitation temperature of 26AlF is consistent with that of 27AlF (see below). In the 7.75 GHz wide
spectrum acquired with ALMA in Band 6, we observe only four features of similar intensity and
width as these of 26AlF 7-6. Within the accuracy to which we can determine the observed line
positions in CK Vul, the ALMA Band 6 spectrum indicates a probability of a chance coincidence
of 1:840. A probability that all four lines match the calculated frequencies is smaller than 10-11.
Therefore, a false identification is highly unlikely.
The spectra acquired to secure the AlF observations serendipitously covered transitions of
other species. Additionally, we observed CK Vul with NOEMA in two frequency setups centered
at about 89.3 and 146.0 GHz to map emission of species other than AlF. Interferometric imaging
of molecular emission was also obtained with the Submillimeter Array (SMA) and reported earlier
(5). Table M3 contains details of these complementary observations and provides a list of the main
lines that were observed. All the interferometric observations allowed us to measure continuum
emission. All these extra materials allowed us to trace the complex kinematical, chemical, and
excitation structure of the molecular remnant and thus provided an important context for the
interpretation of the AlF emission.
All the interferometric data were calibrated using standard procedures. ALMA and
NOEMA data were additionally self-calibrated on the strong continuum source. Continuum
emission was subtracted from the visibilities as a zeroth- or first order polynomial fitted to the full
band and avoiding strong lines. Interferometric maps presented here were obtained in CASA (35)
and using CLEAN. The weighting of visibilities, natural or robust, was adjusted to the aims of theanalysis. We often used images with a restoring beam of a circular shape and of a diameter equal
to the geometric mean of the “dirty” beam size.
Excitation analysis and determination of the isotopic ratio. The excitation temperature and
column densities of the AlF isotopologues were derived in a population-diagram analysis (37). The
population diagram is shown in Fig. M2. We used a python’s emcee implementation (36) of the
Monte Carlo Markov Chains method (38) to obtain linear fits to the data. In the associated error
analysis, we considered statistical uncertainties from the thermal noise in the flux measurements
and a 20% systematic errors in the flux calibrations. We assumed that both isotopologues are
located in the same volume and have the same single excitation temperature. That the temperatures
are, within uncertainties, equal for both species is evident from the same slopes of lines that can
be fitted to both sets of points independently. The source size of 1.80×0.84 arcsec was used to
calculate the beam filling factors. This size is a weighted mean of all beam-deconvolved sizes
measured in our 26AlF and 27AlF maps. Free parameters of the population-diagram fit were the
excitation temperature, Tex, the column density of 27AlF, N27, and the ratio of the column density
of 27AlF to that of 26AlF, N27/ N26. We used uniform (“uninformative”) priors for the three
parameters allowing their values to be in arbitrary but reasonably broad ranges. A few thousand
“walkers” were used in emcee to derive the posterior distributions. After the first determination of
the column densities, we calculated the line opacities and corrected the measured fluxes for the
corresponding saturation (38). The calculation of the free parameters was then repeated. The
maximum optical thickness in this second iteration was 0max=0.3. The saturation correction is only
1.4% higher than in the previous iteration; that figure is much smaller than uncertainties in the flux
measurement and therefore no further corrections were applied. The procedure yielded
7:.( 15
Tex=12.978.9
45.6 K, N27=3.04:.; ×10 cm-2, and N27/N26=7.17=.8
48.8 , where the median values are
associated with uncertainties corresponding to 97.3% confidence levels. These uncertainties are
underestimated and do not take into account, for instance, errors in the source size.
The population-diagram analysis relies on the assumption of thermodynamic equilibrium
(TE) in the gas. The assumption is not granted in CK Vul considering that some species appear to
be sub-thermally excited (12). However, the AlF population diagram itself does not indicate any
strong deviations from what is expected in TE. Also, the excitation temperature of AlF derived
here is consistent with the kinetic temperature constrained from the single-dish survey (12). Using
collision rates of AlF with p-H2 and with He at 10 K (39, 40), we calculated critical densities for
all observed transitions. They range from 104 cm-3 for J=1-0 to 107 cm-3 for J=7-6 and are therefore
comparable to critical densities of analogous transitions of low-density molecular tracers such as
CO. The AlF gas is likely thermalized and the level population are likely close to TE.
Nucleosynthesis of 26Al. In order to investigate the synthesis of 26Al in low-mass stars evolving
off the main sequence to RGB, we analyzed state of the art solar-metallicity evolutionary
sequences calculated with the Monash stellar-evolution code (41). The surface abundances on the
asymptotic giant branch (AGB) were investigated with the code in ref. 42. The models are evolved
from the zero-age main sequence to near the end of the thermally-pulsing AGB phase. For the
purposes of this study, we sampled the interior composition of the star at the tip of the RGB, before
core helium burning is ignited. The grid includes models between 1 and 8 *⨀ and we considered
models for 1-3 *⨀ for this study. The nuclear network and initial abundances used for the
nucleosynthesis calculations are described in ref. 30 and the input physics used in the stellar
evolutionary calculations are described in ref. 42. Evolution of a grid of low-mass stars (0.9-3.0*⨀ ) from the pre-main-sequence up to the He-flash (end of the red-giant phase) was also
performed using the TYCHO (version 6.0) stellar evolution code developed by David Arnett and
his collaborators (44).
We find that for all the considered models, the mass of 26Al increases with the time spent
on the RGB. The abundance profiles of the aluminum isotopes at the tip of the RGB (Fig. 2)
indicate a high content of 26Al only in the outermost parts of the well-developed He core. There is
not much difference between the amount of 26Al synthesized in 1 and 2 *⨀ models but the total
26
Al mass becomes smaller in models of stars of higher masses. For instance, the total mass of 26Al
in the 1 *⨀ model is 9 ∙ 108> g and only 4 ∙ 108( g in the 3 *⨀ model. The lower production of
26
Al in the more massive stars is related to their relatively short time spent on the RGB; also, stars
with initial masses of ³2.5 *⨀ burn H on the main sequence in a convective core which eventually
results in lower temperature of H shell burning on the RGB and consequently a lower production
of 26Al. We therefore consider 2.5 *⨀ as an upper limit on the mass of the CK Vul’s progenitor.
Stars with masses ≲0.8 *⨀ evolve longer than the age of the Universe and could not have
produced sufficient 26Al to explain our observations of CK Vul, setting an approximate lower mass
limit on the progenitor.0.4 A 27
AlF(1→0) 50 D 27
AlF(5→4)
Fig. M1. Spectra of rotational lines of
0.3
VLA 40 IRAM30m AlF in CK Vul. Green vertical lines
0.2
30
20
illustrate the hyperfine structure of the
10 transitions (in arbitrary intensity units).
0.1 0 Areas shaded in red and blue show the
27
0 -10
-20
AlF and 26AlF emission, respectively,
20 B 27 60 E 27 and represent the main emission region
AlF(3→2) AlF(6→5)
of AlF. Some spectra were smoothed in
Flux density (mJy)
NOEMA 50 ALMA
resolution, most heavily for 27AlF J=1-
15 40
30
10
20
0. The transition and telescope used to
5
10 collect the data are indicated in each
0 0 panel. For lines observed with a single-
C 27 40 F 27
dish telescope and with an
40 AlF(4→3) AlF(7→6)
NOEMA 35
30
ALMA interferometer, only the interferometric
30
25 spectrum is shown. A-F, Spectra of
27
20 20
AlF. F, The 27AlF 7-6 transition is
CH3NH2
15
contaminated by emission of
CO
10 10
5
0 0 methylamine and a mirrored profile is
-200 -100 0 100 200
-5
-200 -100 0 100 200
shown with a dashed line to illustrate
LSR velocity (km s-1) LSR velocity (km s-1) the contribution of 27AlF. G-J, Spectra
of 26AlF. K, The feature shown with a
3
G 26
AlF(3→2) black empty histogram was
NOEMA
decomposed into two Gaussians
2
corresponding to SO2 (red) and 26AlF
1
(blue). Shaded grey histogram shows
0 the best-fitting combined profile. L,
-1 K 26
AlF(4→3) Normalized profiles of unblended lines
NOEMA
15 H 26
AlF(4→3)
SO2
(82,6-81,7)
observed with interferometers are
NOEMA
10 26
overlaid to illustrate their close
AlF
alignment. Red lines correspond to
SO2
5 transitions of 27AlF, blue ones are 26AlF.
Flux density (mJy)
0
-200 -100 0 100 200
10
I 26 LSR velocity (km s-1)
8 AlF(6→5)
ALMA
6 1
L 27
AlF
4
26
AlF
2
0
0.5
-2
10 J 26
AlF(7→6)
8 ALMA
6
4
0
2
0
-2
-4
-200 -100 0 100 200 -200 -100 0 100 200
LSR velocity (km s-1) LSR velocity (km s-1)Fig. M2. Comparison of AlF emission regions to these of other molecules observed in CK Vul. Contours are drawn at arbitrarily chosen levels that illustrate the emission morphology. All maps were restored with circular beams for better comparison. A-B, Representative maps of emission in 26AlF and 27AlF. C-H, Sample maps of emission in species displaying a wide range of morphologies. C, Emission in SO2 is most similar to that of AlF but has a different position angle of its major axis. D-E, The emission of the only two molecular ions observed in this source appear generally more extended than AlF. F-G, In contrast to AlF, most of the observed species have a strong component within the bipolar lobes.
Fig. M3. The population diagram for AlF in CK Vul. Shaded cyan and green areas are 2000
trial Monte Carlo fits to the data. The errorbars represent only statistical errors.
Table M1. Spectroscopic constants in MHz of 26,27AlF used in our calculations. The 1s errors are
given in brackets.

Table M2. Spectroscopic data and flux measurements of AlF features.
 Line      Frequency Eu             Sµul2       Beam      Flux        Flux err.
                                                                                  Instrument
 (Ju-Jl) (GHz)            (K)       (D)         (“)       (Jy km/s) (Jy km/s)
 27
    AlF single dish
 3-2       98.92674       9.50      41.78         24.9    2.90        0.10        IRAM 30m
 4-3       131.89879      15.83     56.46         18.7    5.90        0.21        IRAM 30m
 5-4       164.86782      23.74     70.38         14.9    4.85        0.34        IRAM 30m
 6-5       197.83306      33.23     84.29         31.5    6.08        0.90        APEX
 8-7       263.74919      56.97     113.16        23.7
Table M3. Interferometric observations of AlF in CK Vul.
Native
Ang. resolution No. of Frequency
Observation spectral
Array Band ("), beam PA antennas range Main lines observed
dates binning
(°) or pads (GHz)
(kHz)
HC13CCN+HCC13CN (4-3), HC3N (4-3),
JVLA Ka 18, 22 Jan 2016 1.5×0.7, 85.9 27 29.9-37.9 1000
CH3CN (2,0-1,0), AlF (1-0)
HNCO(4,0,4-3,0,3), HCN(1-0), H15NC(1-0),
NOEMA Band 1 24 Sep 2016 2.7×1.5, 15.5 8 87.4-91.1 10000
HCO+(1-0), HNC (1-0), SiS(5-4), HC3N(10-9)
SO(2,3-1,2), HC13CCN+ +HCC13CN (11-10),
26, 28 Jan 2016;
NOEMA Band 1 1.0×1.6, 34.9 7, 8 98.2-101.8 10000 HC3N (11-10), SO2(2,2,0-3,1,3), AlF(3-2),
16, 18 Jan 2017 26
AlF(3-2)
HC13CCN(15-14), CH3NH2 133.98 GHz,
NOEMA Band 2 18 Nov 2015 2.0×1.5, 16.0 6 130.9-134.5 10000
AlF(4-3), 26AlF(4-3)
C34S (4-3), CH3OH (3,Ka,Kc-2,Ka,Kc), H2CO
NOEMA Band 2 27 Jul 2016 2.1×1.7, 41.3 8 144.2-147.8 10000 (2,0,2-1,0,1), H213CO (2,1,1-1,1,0), CS (3-2),
CH3CN (8-7)
N2H+(2-1), SO(6,6-6,7), PN(4-3), SO2(9,2,8-
185.7-189.4; 9,1,9), 13CH3OH 188.8 GHz, AlF(6-5), SiS(11-
ALMA Band 5 4, 5 Apr 2018 1.0×0.9, 156.5 41, 43 3906.3
197.7-201.4 10), CH2NH(3,1,2,2-2,1,1,2), HC3N(22-21),
26
AlF(6-5)
230.6-232.4;
CO (2-1), CH3NH2 (3,2,4-3,1,5), 13CS (5-4),
233.5-235.4;
ALMA Band 6 2, 3 Jun 2016 0.8×0.8, 96.5 41 3906.3 PN (5-4), SO2 (4,2,2-3,1,3), 34SO (6,5-5,4),
246.1-248.0;
AlF(7-6), 26AlF(7-6)
248.1-250.0
330.2-332.2;
335.2-337.2; 13
SMA 345 3 Jul 2014 2.0×1.3, 270 8 640.4 CO(3-2), H13CN(4-3), CO(3-2), H13CO+(4-3)
345.2-347.2;
350.2-352.2
216.9-218.8;
13
218.9-220.8; SiO(3-2), CN(2-1), C18O(2-1), 13
CO(2-1),
SMA 230 30 Jul 2014 8.4×4.7, 71.5 7 640.4 13
228.9-230.8; CS(5-4)
230.9-232.8
Notes: Angular resolution is given for robust weighting of visibilities.You can also read