Centuria Office REIT FY21 RESULTS

Page created by Eddie Taylor
 
CONTINUE READING
Centuria Office REIT FY21 RESULTS
Centuria
                                            Office REIT
                                            FY21 RESULTS
                                            A S X:COF   | 0 3 AUG 2021

                                                             CENTURIA OFFICE REIT   ASX:COF   1
100 BROOKES STREET, FORTITUDE VALLEY, QLD
Centuria Office REIT FY21 RESULTS
A QUALITY
                 PORTFOLIO OF
        HIGHLY CONNECTED AND                                             COF: NISHI, 2 PHILIP LAW STREET, CANBERRA, ACT

       AFFORDABLE OFFICE SPACE
       WITHOUT SINGLE MARKET
           CONCENTRATION
                                                                                                           Agenda
                                                                                                          1. Vision, Strategy
                                                                                                             and Objectives
                           COF: 54 MARCUS CLARKE STREET, CANBERRA, ACT
                                                                                                          2. Overview
           COF: 60 MARCUS CLARKE STREET, CANBERRA, ACT                                                    3. Financial Results
                                                                                                          4. Portfolio Metrics
                                                                                                          5. Market Overview
                                                                                                             & Guidance
                                                                                                          6. Appendices

                                                                                                               CENTURIA OFFICE REIT   ASX:COF   2
COF CANBERRA PORTFOLIO
Centuria Office REIT FY21 RESULTS
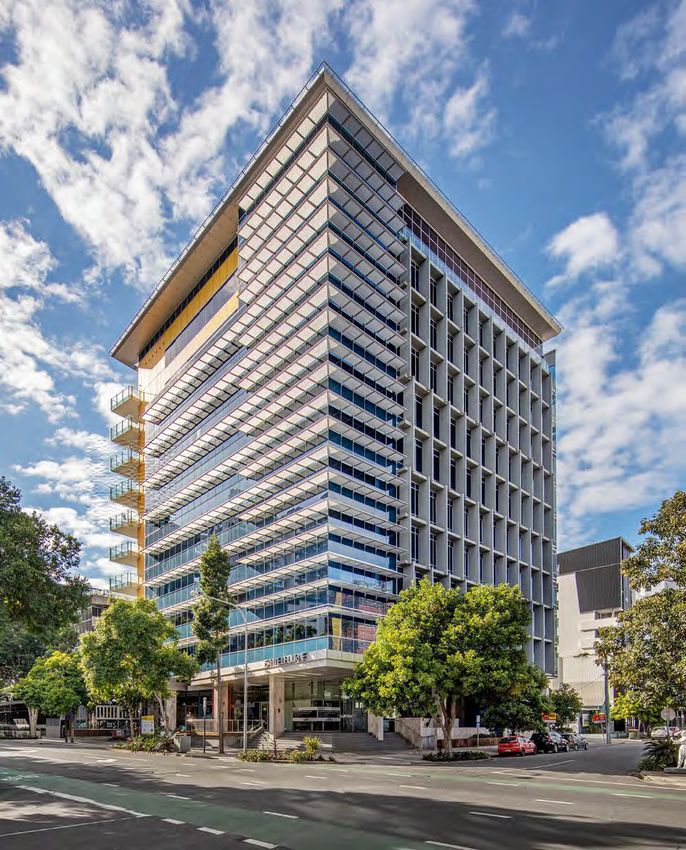
COF: Vision, strategy and objectives

VISION

To be Australia’s                                           Australia’s largest ASX-listed pure play office REIT.
leading pure play                      COF                  Overseen by an active management team with deep real
                                                            estate expertise. Strongly supported by Centuria Group.
office REIT

A CLEAR AND SIMPLE STRATEGY           KEY OBJECTIVES

                                      Portfolio Construction         Active Management         Capital Management         Unlock opportunities
Focused on generating sustainable     A portfolio of Australian      Primarily focused on      A robust and diversified   to create further value
and quality income streams and        office assets diversified by
                                      geography, tenants and
                                                                     maintaining occupancy
                                                                     and extending portfolio
                                                                                               capital structure, with
                                                                                               appropriate gearing
                                                                                                                          Continue to enhance
                                                                                                                          the portfolio and
executing initiatives to create       lease expiry                   WALE                                                 upgrade asset quality

value across a portfolio of quality
Australian office assets

                                                                                                                CENTURIA OFFICE REIT   ASX:COF      3
Centuria Office REIT FY21 RESULTS
ASSET QUALITY

 COF provides quality, highly connected and affordable office space
 With exposure to Australia’s better performing office markets

  Balanced geographic                               Portfolio of                       Access to recreational                     Connectivity with key                     COF exposed market
  diversification without                          young assets                       amenity, essential retail                    transport nodes &                           rents average a
      single market                                                                       & hospitality                          reduced commute time                      significant discount to
      concentration                                                                                                                                                             Sydney CBD

                                                                                                                               All assets serviced by
                                                                                      All assets within close
  COF’s largest single                          Average asset age                                                               public transport links                 Avg. portfolio rents of
                                                                                      proximity to a mix of retail
 market exposure is c.17%                            c.17 years                                                                c.80% of assets within                         c.$465psm
                                                                                       and hospitality amenity
                                                                                                                              close proximity of heavy rail

          42-46 COLINS STREET, WEST PERTH, WA                      235 WILLIAM STREET, NORTHBRIDGE, WA               2 KENDALL STREET, WILLIAMS LANDING, VIC            201-203 PACIFIC HIGHWAY, ST LEONARDS, NSW

                                                                                                                                                               CENTURIA OFFICE REIT       ASX:COF           4
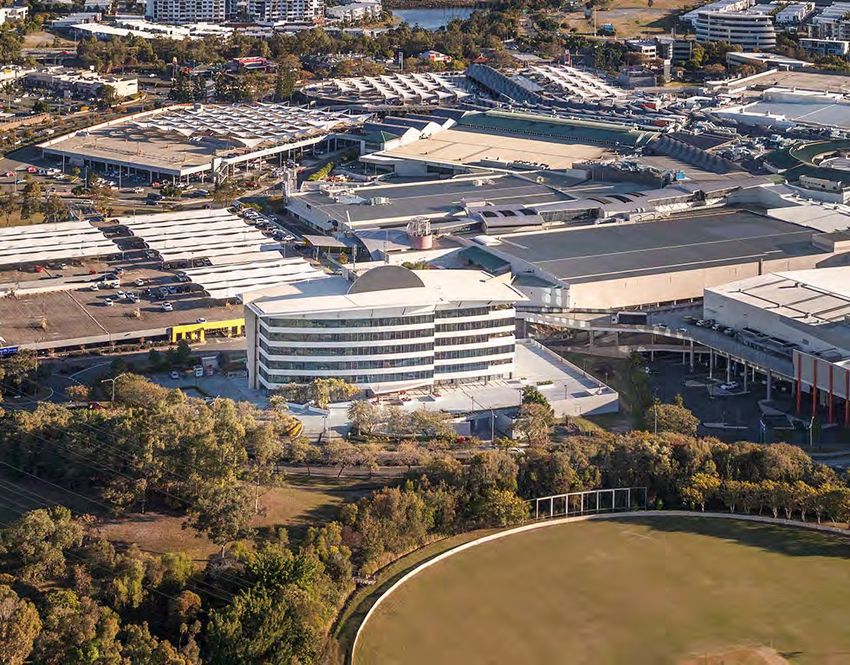
Centuria Office REIT FY21 RESULTS
A PORTFOLIO WITHOUT
                                                           SINGLE MARKET
                                                           CONCENTRATION

                                    SECTION TW O

                                    Overview
                                    A S X:COF

                                                   CENTURIA OFFICE REIT       ASX:COF   5
77 MARKET STREET, WOLLONGONG, NSW
Centuria Office REIT FY21 RESULTS
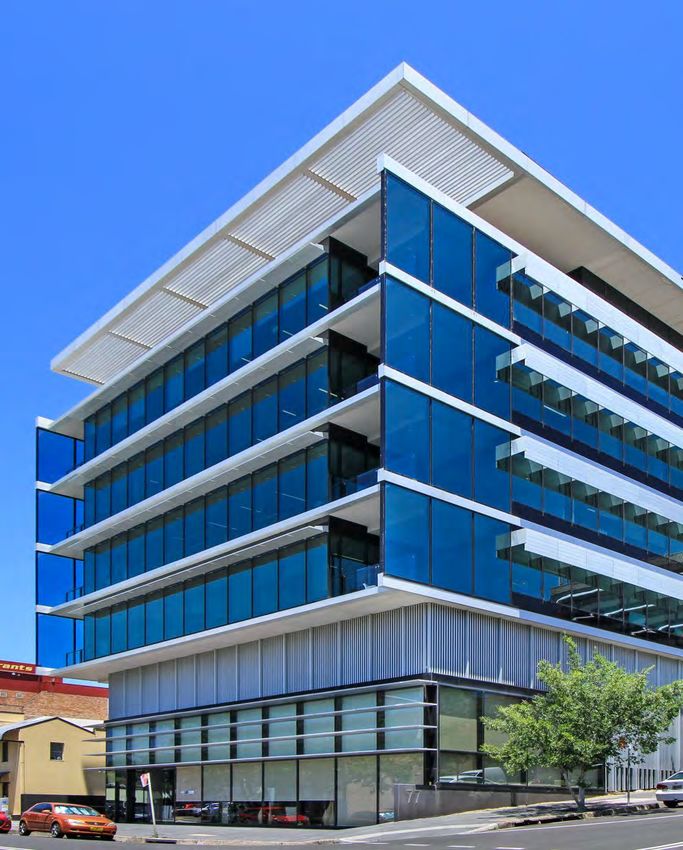
A leading Australasian real estate funds manager
CNI is the manager of COF and is included in the S&P/ASX200 Index

                                                                                                    $17.4bn                                                GROUP AUM

                                                                               $16.5bn REAL ESTATE AUM                                                        1

                                            $5.5bn                                                                                         $11.0bn                                             $0.9bn
                                                                                                                                                                                             INVESTMENT BONDS
                                             LISTED REAL ESTATE                                                                            UNLISTED REAL ESTATE

                                                                                                                                                                                               CENTURIA LIFE

                    $3.1bn                        $2.1bn                       $0.3bn                              $7.9bn                       $1.6bn                       $1.5bn              CENTURIA
                                                                                                                                                                                             INVESTMENT BONDS
                       CENTURIA                      CENTURIA                     ASSET PLUS                            SINGLE                       MULTI                     MULTI ASSET
                    INDUSTRIAL REIT                 OFFICE REIT                     LIMITED                             ASSET                        ASSET                      OPEN END     GUARDIAN FRIENDLY
                        ASX:CIP                       ASX:COF                      NZX:APL                              FUNDS                        FUNDS                       FUNDS           SOCIETY

Note: All figures above are in Australian dollars (currency exchange ratio of AU$1.000:NZ$1.0753). Numbers presented may not add up precisely to the totals provided due to rounding            CENTURIA CAPITAL GROUP   ASX:CNI   6
1. Includes commenced development projects valued on an as if completed basis, cash and other assets
Centuria Office REIT FY21 RESULTS
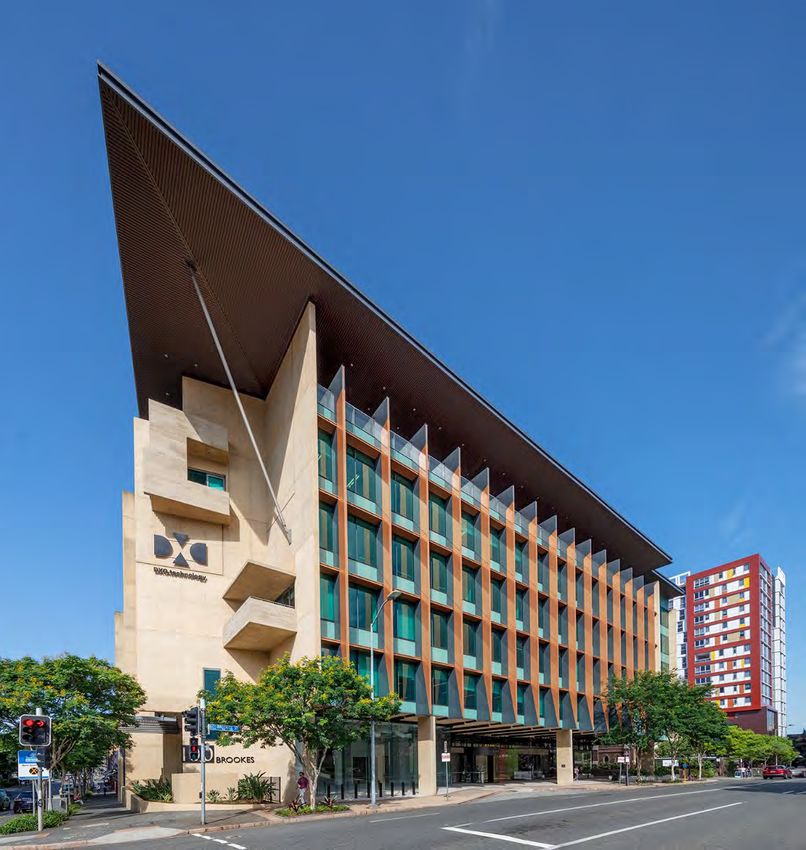
COF is aligned to a highly experienced real estate funds manager
    CNI manages COF as part of its Australasian real estate platform

CENTURI A CAPI TAL GROUP                                                                                       CENTURI A OFFICE REIT
                    ( ASX : CNI)                                                                                         ( ASX : CO F)

            STRONG TRACK RECORD
    Managing real estate funds                                                                                Australia’s largest ASX listed
for over 20 years, manager of COF                                                                                pure play office REIT
         since Dec-14 IPO

           HANDS ON MANAGEMENT                                                                                        Included in the
 In house property and facilities                                                                                   S&P/ASX 300 Index
management with deep leasing and                                                                           Positioned for potential inclusion in the
  capital transaction capability                                                                                 FTSE EPRA Nareit Indices

         SUBSTANTIAL COMMERCIAL
           PROPERTY PLATFORM                                                                                      CO-INVESTMENT ALIGNMENT
  $16.5bn AUM property platform                                                                                 CNI co-investment of 19.9%1
  provides economies of scale that                                                                               – COF’s largest unitholder
            benefit COF                                         35 ROBINA TOWN CENTRE DRIVE, ROBINA, QLD

1. Includes ownership by associates of Centuria Capital Group                                                     CENTURIA OFFICE REIT   ASX:COF   7
Centuria Office REIT FY21 RESULTS
CENTURIA MANAGEMENT

     Key metrics – Australia’s largest ASX listed pure play office REIT

                                PORTFOLI O                                                                                                                   FI NANCI AL

                  22                                      $2.0bn                                 19.9cpu                                     16.5cpu                                       6.7%                        25.0%
            High quality                             Portfolio book value                           FY21 FFO                                      FY21 DPU                              Forecast FY22                  Twelve month
              assets                                                                                                                                                                      DPU yield2                       TSR3

            93.1%                                          4.3yrs                                 98.3%                                       33.5%                                      $2.48                     $16.3m
     Portfolio      occupancy1                          Portfolio        WALE1                   Average rent                                    Gearing5                               Net tangible              2H21 like for like
                                                                                                 collections4                                                                             assets                 valuation increase
                                                                                                July 2020 to June 2021
                                                                                                                                                                                                                  over book value

1.   By gross income                                                                    4.   As COVID-19 impacts and the National Code of Conduct on Commercial Leases remained active, it is
2.   Based on COF closing price of $2.47 per unit on 30 July 2021                            possible that further rent relief claims could be received for FY21 period
3.   Total Securityholder Return (TSR) equals change in unit price during the period,   5.   Gearing is defined as total borrowings less cash divided by
     plus distributions declared                                                             total assets less cash and goodwill
                                                                                                                                                                                                CENTURIA OFFICE REIT     ASX:COF      8
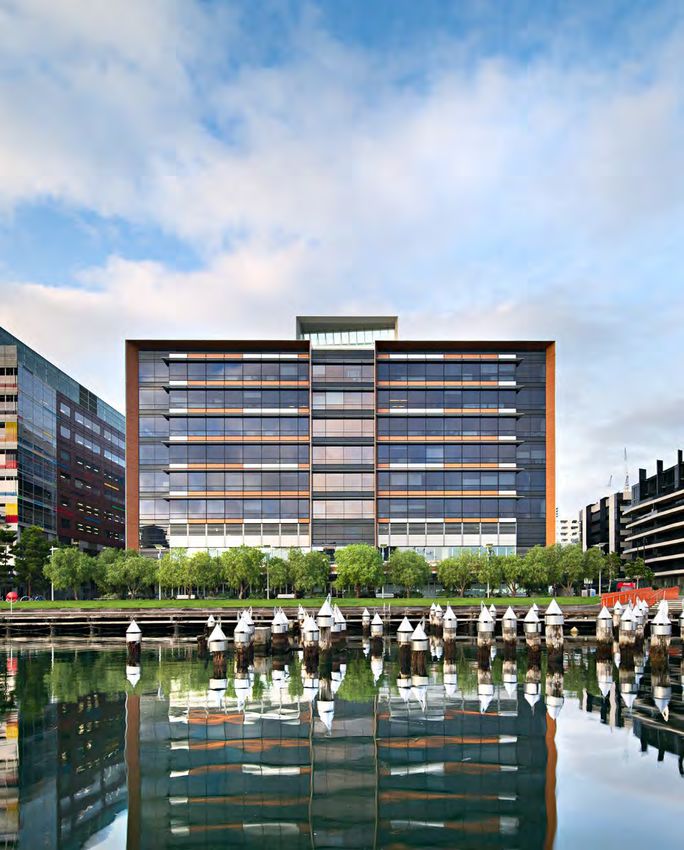
Centuria Office REIT FY21 RESULTS
FY21 Summary

                                                                              •    Consistently achieved substantial leasing success since IPO
                                                                              •    Leases agreed1 for over 52,077 sqm, representing 18.1% of the portfolio’s NLA
Active management
                                                              1               •    93.1% occupancy2, over 80% of income derived from multinational, ASX and government tenants
                                                                              •    WALE2 of 4.3 years

                                                                              •    Refinanced $405m during 2H21
                                                                              •    Weighted average debt term to maturity increased from 2.3 to 4.2 years

Capital management
                                                              2               •
                                                                              •
                                                                                   Maintained low all-in cost of debt of 2.4%3
                                                                                   Ample undrawn debt of $107m
                                                                              •    No debt tranche expiring until June 2024

                                                                               •    22 high quality office assets with an average building age of 17 years
                                                                               •    Highly sustainable portfolio, average NABERS Energy rating of 4.7 Stars
Portfolio construction
                                                              3                •
                                                                               •
                                                                                    Balanced geographic diversification with exposure to Australia’s better performing office markets
                                                                                    Strong tenant covenants with Australian Federal and State Governments representing c.27% of gross income
                                                                               •    Diversified lease expiry profile, c.63% of leases expiry at or beyond FY25
                                                                                                                                                                                                                     144 STIRLING STREET, PERTH, WA

1.   Includes Heads of Agreement
2.   By gross income
3.   Effective interest rate as at 30 June 2021 includes floating rate, all-in margin (base and line fees) and fixed interest costs under existing swaps (excludes capitalised borrowing costs)
                                                                                                                                                                                                  CENTURIA OFFICE REIT   ASX:COF            9
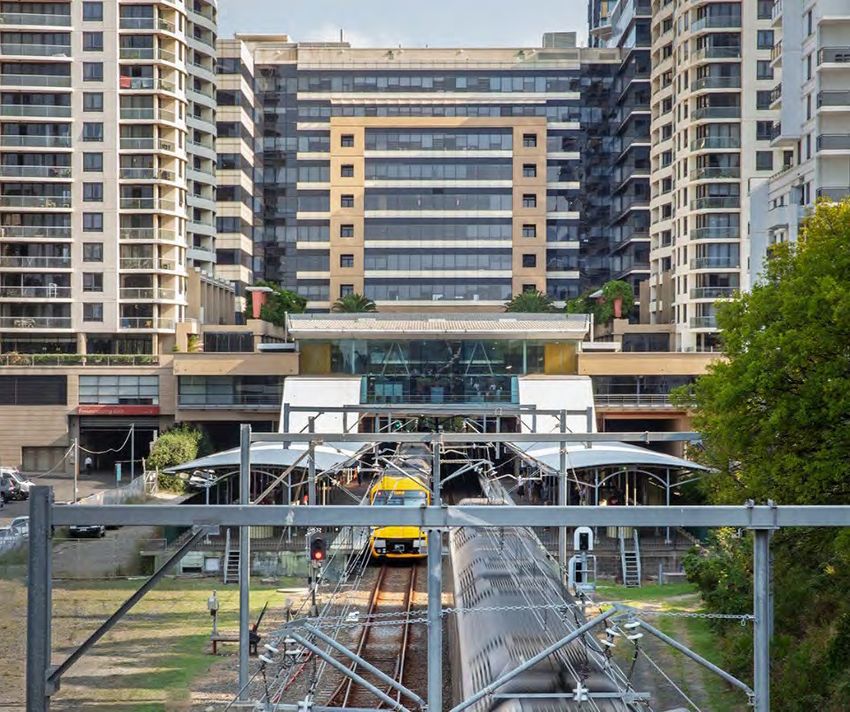
Centuria Office REIT FY21 RESULTS
CONNECTIVITY TO KEY
                                                             TRANSPORT

                                    SECTION THREE

                                    Financial Results
                                    A S X:COF

                                                    CENTURIA OFFICE REIT        ASX:COF   10
818 BOURKE STREET, DOCKLANDS, VIC
Funds from operations (FFO)

REVENUE                                                                  FY21       FY20   VARIANCE

Gross property income                                          $m      170.6      149.2          21.4
Interest income                                                $m            -       0.1        (0.1)                  FY21 benefited from the
Total revenue                                                  $m      170.6      149.3          21.3                   Foxtel surrender payment
                                                                                                                       at 35 Robina Town Centre
EXPENSES                                                                                                                          Drive
Direct property expenses                                       $m        35.0       31.6          3.4
Responsible entity fees                                        $m        11.5       10.4          1.1
Finance costs                                                  $m        18.4       16.8          1.6
Management and other administrative
                                                               $m         2.3        2.0          0.3
expenses
Expected credit loss and rental waiver                                                                                     FFO impact of
                                                               $m         1.2        3.2        (2.0)
expense                                                                                                                  COVID-19 (0.2) cpu
Total expenses                                                 $m        68.4       64.0          4.4
Funds from operations (FFO)                                    $m      102.2        85.4         16.8
Weighted average units on issue                                  m     514.5      459.3          55.2
Funds from operation per unit1                                 cpu       19.9       18.6          1.3
Distributions                                                  $m        84.9       84.5          0.4
                                                                                                                          Distributions per unit
Distribution per unit                                          cpu       16.5       17.8        (1.3)
                                                                                                                         (DPU) in line with FY21
Distribution yield2                                              %        7.0        8.6        (1.6)
                                                                                                                                guidance
Net tangible assets per unit3                                     $      2.48       2.49        (0.0)
                      4                                                                                                                                                                    203 PACIFIC HIGHWAY, ST LEONARDS, NSW
Return on equity                                                 %        6.0        7.2        (1.2)
Payout ratio (% of FFO)                                          %       83.0       95.8       (12.8)

1.   FFO is the Trust’s underlying and recurring earnings from its operations. This is calculated as the statutory net profit adjusted for certain non-cash and other items
2.   Based on COF current full year guidance divided by closing price ($2.34 per unit as at 30 June 2021 and $2.07 per unit as at 30 June 2020)
3.   NTA per unit is calculated as net assets less goodwill divided by total assets less cash and goodwill                                                                    CENTURIA OFFICE REIT     ASX:COF            11
4.   Return on equity calculated as (closing NTA minus opening NTA plus distributions) divided by opening NTA
$405m of debt refinanced in 2H21

                                                                                                            DEBT MATURITY PROFILE ($M)
                                                                                                             (A$m)

                                                                                                              $812.5m        $812.5m        $812.5m                                                         Drawn
                                                                                                                                                                                                                                        2.4%
                                                                                                                                                                                                                                     ALL IN COST OF DEBT2
 • Five major lenders provides                                                                                                                             $580.0m
                                                                                                                                                                                                            Undrawn

                                                                                                                                                                                                            Swap 4
       diversification to high quality                                                                                                                                    $480.0m
                                                                                                                                                                                         $380.0m
       financiers

 • Weighted average debt expiry                                                                                                                                                                    $75.0m
                                                                                                                                                                                                                 $0.0m
                                                                                                                                                                                                                                 $106.7m
                                                                                                                                                                                                                                 CURRENT FACILITY HEADROOM1
       increased to 4.2 years                                                                                   FY21           FY22           FY23           FY24           FY25           FY26     FY27         FY28

 • No debt tranche expiring until                                                                                 KEY DEBT METRICS                                                                  FY21              FY20

       June 2024                                                                                                  Facility limit
                                                                                                                  Drawn amount
                                                                                                                                                                                  $m
                                                                                                                                                                                  $m
                                                                                                                                                                                                   812.5
                                                                                                                                                                                                   704.3
                                                                                                                                                                                                                     880.0
                                                                                                                                                                                                                     749.0           33.5%
 • Significant covenant headroom                                                                                  Undrawn capacity1
                                                                                                                  Weighted average debt expiry
                                                                                                                                                                                  $m
                                                                                                                                                                                Years
                                                                                                                                                                                                   106.7
                                                                                                                                                                                                     4.2
                                                                                                                                                                                                                     129.5
                                                                                                                                                                                                                       3.3
                                                                                                                                                                                                                                           GEARING3

       ICR 6.6x (covenant 2.0x) and                                                                               Proportion hedged                                                %                80.2              75.4
       LVR 35.0% (covenant 50%)                                                                                   Weighted average hedge maturity                               Years                1.9               3.2
                                                                                                                  All in cost of debt2                                                                                 2.2
                                                                                                                                                                                                                                     80.2%
                                                                                                                                                                                   %                 2.4
                                                                                                                  Gearing3                                                         %                33.5              34.5
                                                                                                                  Interest cover ratio                                          Times                6.6               6.3
                                                                                                                                                                                                                                            HEDGING
                                                                                                                  Loan to value ratio                                              %                35.0              36.4

1.   Undrawn capacity excludes a $1.5m bank guarantee held as security over the 46 Colin Street, West Perth WA ground lease
2.   Effective interest rate as at 30 June 2021 includes floating rate, all-in margin (base and line fees) and fixed interest costs under existing swaps (excludes capitalised borrowing costs)
3.   Gearing is defined as total borrowings less cash divided by total assets less cash and goodwill
                                                                                                                                                                                                                             CENTURIA OFFICE REIT   ASX:COF   12
4.   Swap profile includes outstanding options which are currently in the money
A YOUNG PORTFOLIO
                                                            OF QUALITY ASSETS

                                        SECTION FOUR

                                        Portfolio Metrics
                                        A S X:COF

                                                       CENTURIA OFFICE REIT     ASX:COF   13
825 ANN STREET, FORTITUDE VALLEY, QLD
A record year of leasing for COF
                                         Leveraging Centuria’s leasing capability as part of COF’s active management approach
235 WILLIAM STREET, NORTHBRIDGE, WA

                                                                                                                                                  CURRENT VACANCY (>1,000 SQM)                NLA (SQM)

                                                                                                                                                  818 Bourke Street, Docklands                10,740
                                                                                                                                                                                                          VAC
                                                                                                                                                  576 Swan Street, Richmond                   3,512
                                                                                                                                                  60 Marcus Clarke Street, Canberra           3,290
                                                                                                                                                  235 William Street, Northbridge             1,726
                                                                                                                                                  9 Help Street, Chatswood                    1,079
                                                                                                                                                  35 Robina Town Centre Drive, Robina         1,039
                                                                                                                                                  Other                                       1,380
                                                                                                                                                  TOTAL                                       22,766
                                                                                                                                                  % of total NLA                              7.9%

                                              FY15          FY16           FY17          FY18           FY19           FY20          FY21
                                                                                                                                                  UPCOMING EXPIRIES (>1,000 SQM)              FY22

                                              LEASING       LEASING        LEASING        LEASING       LEASING        LEASING        LEASING
                                                                                                                                                  35 Robina Town Centre Drive, Robina         4,937       FY22
                                             EXECUTED      EXECUTED       EXECUTED       EXECUTED      EXECUTED       EXECUTED       EXECUTED     154 Melbourne Street, South Brisbane        4,233
                                         5,116sqm        12,493sqm      20,321sqm      17,970sqm     21,758sqm      32,378sqm      52,077sqm      201 Pacific Highway, St Leonards            1,247

                                         or 5.1% of      or 11.1% of    or 15.5% of    or 9.7% of    or 10.0% of    or 10.6% of    or 18.1% of    9 Help Street, Chatswood                    1,206

                                          portfolio       portfolio      portfolio      portfolio     portfolio      portfolio      portfolio     Other
                                                                                                                                                                                              6,543
                                                                                                                                                  TOTAL
                                                                                                                                                                                              18,165
                                                                                                                                                  % of total NLA                              6.3%
                                             PORTFOLIO      PORTFOLIO      PORTFOLIO     PORTFOLIO      PORTFOLIO      PORTFOLIO      PORTFOLIO
                                            OCCUPANCY1     OCCUPANCY1     OCCUPANCY1    OCCUPANCY1     OCCUPANCY1     OCCUPANCY1     OCCUPANCY1

                                            96.7%          97.2%          97.3%          98.9%         98.4%          98.1%          93.1%

                                                                                                                                                                       CENTURIA OFFICE REIT   ASX:COF       14
                                      1. By area
A high-quality geographically diversified portfolio
Over 52,000sqm of completed leasing representing 18% of COF’s portfolio
PORTFOLIO SNAPSHOT                                                                              FY21                        FY20      WEIGHTED AVERAGE LEASE EXPIRY
Number of assets                                                             #                    22                         23
Book value1                                                                 $m                 2,014.3                     2,053.3
WACR1                                                                       %                    5.81                       5.93
NLA                                                                        sqm                 287,007                     304,586         Income WALE (Jun-20) 4.7 yrs                                                                43.6%
Occupancy2                                                                  %                    93.1                       98.1
                                                                                                                                           Income WALE (Jun-21) 4.3 yrs
WALE2                                                                       yrs                  4.3                         4.7
                                                                                                                                                                                                                              35.0%
Average NABERS Energy rating (by value)                                    Stars                 4.7                         4.5
Average NABERS Water rating (by value)5                                    Stars                 3.2                          -
Buildings generating solar power                                            no.                    6                          1
Average building age (by value)                                             Yrs                 16.8                        15.9          OF THE VACANT 22,766 SQM,
                                                                                                                                          10,740 SQM ARE WITHIN 818
                                                                                                                                        BOURKE STREET, DOCKLANDS VIC
                                                                                                                                                                                                                      19.5%
         WA 14.2%                                                                           QLD 23.6%                                                                         17.7%
                                                                                                                                                                                                              16.1%
                                                                                                                                                                                      13.4%
        97.1              4.5                                                               98.2               3.3
                        WALE (YRS)
    OCCUPANCY (%)                                                                       OCCUPANCY (%)      WALE (YRS)                                                                                9.4%
                                                                                                                                                  6.9%      6.8%       7.2%                   7.3%

                                                                                                        NSW 25.0%                         1.8%
                                                       NT

                                                                          QLD                           97.8                5.4             Vacant             FY22             FY23            FY24             FY25           FY26+
                                                                                                    OCCUPANCY (%)        WALE (YRS)

                                 WA
                                                              SA
                                                                                                        ACT 16.7%
                                                                                 NSW
                                                                                  ACT                   93.5               5.5
                                                                                                                                                       18.1%                                           26,388sqm
                                                                                                   OCCUPANCY (%)        WALE (YRS)            PORTFOLIO NLA LEASED IN FY213,4                               33 NEW LEASES IN FY213,4
                                      SA 2.9%                               VIC
                                     100            3.8                                     VIC 17.6%
                                OCCUPANCY (%)    WALE (YRS)

                                                                                           69.9
                                                                                        OCCUPANCY (%)
                                                                                                               3.2
                                                                                                          WALE (YRS)
                                                                                                                                                 52,077sqm                                             25,689sqm
                                                                                                                                              PORTFOLIO NLA LEASED IN FY213,4                               28 RENEWALS IN FY213,4

1. As at 30 June 2021                           3. By area                                 5. Insufficient data for FY20                                                                         CENTURIA OFFICE REIT         ASX:COF          15
2. By gross income                              4. Includes Heads of Agreement
Case study – active management across COF’s QLD portfolio
100 BROOKES STREET                                           35 ROBINA TOWN CENTRE DRIVE                                825 ANN STREET                                555 CORONATION DRIVE

                  Four new tenants
                                                                 Occupancy increased to 88.6%1 following                                                                     Occupancy maintained at 100%1
           Increased occupancy to 100%1                                                                                       Occupancy increased from 97% to 100%1
                                                                 Foxtel full building surrender in July 2020                                                               WALE increased from 5.3 to 5.7 years1
       Increased WALE from 3.7 to 4.9 years1

   LEASE EXTENSIONS REDUCING FORECAST DOWNTIME
                                                                                                                                                    16,689sqm of terms agreed1,2 (6% of portfolio)
     BUILDING
                                  ACTUAL OCCUPANCY
                                    AS AT JUN-211,2
                                                             SQM LEASED
                                                               IN FY211
                                                                                                 COMMENT                                             to 15 tenants across the QLD sub-portfolio

     100 Brookes                                             5,310 sqm             Lease up of three vacant suites, along
     Street, Fortitude                    100%                                    with the surrender and re-lease of levels
     Valley QLD                                               56% NLA               one and two (former Aurizon space).

                                                                                                                                            14,607sqm of new tenants attracted to COF’s portfolio
     825 Ann Street,                                         2,787 sqm            Surrender and re-lease of ground floor,
     Fortitude Valley                     100%                                    along with level nine. Lease up of two
     QLD                                                      15% NLA                         vacant suites.

     35 Robina Town                                          7,964 sqm
                                                                                   Leased c.8,000 sqm following the full
     Centre Drive,                         89%
     Robina QLD                                               88% NLA
                                                                                   building surrender of Foxtel in Jul-20.                  Four of the new tenants were greater than 1,000sqm

1. By gross income
2. Includes Heads of Agreement                                                                                                                                              CENTURIA OFFICE REIT      ASX:COF      16
All figures are as at 30 June 2021 unless stated otherwise
Portfolio income underpinned by diverse, quality tenants

      ASX Listed           TENANT MIX                     2,000sqm                  9%                                     3%
                                                                                          7%                WA      14%                         concentration with no state having
      National        6%           26%                                                                                              25%
                                                                                                            SA                                  greater than a 25% allocation
      Other                                                                                12%
                   19%                                                                                            17%
                                                                                                                                            •   Approximately 82% of income
                                                                         72%
                         10%      27%                                                                                               23%         derived from government, listed
                                                                                                                        18%
             82%                                                                                                                                or multinational tenants
                                                                                                                                                   27% of income derived from
                                                                                                                                                    government tenants
                             82% of portfolio income derived from federal and state
                               government, ASX listed and multinational tenants                                                             •   Average tenant size of 1,112sqm
                                                                                                                                                across the portfolio
                                                TOTAL GOVERNMENT EXPOSURE 27%                                                                      72%2 of tenants
             CO MMO NWEAL T H                WA                          QLD                      NSW                          SA                   are at least 2,000sqm
                33,136sqm                 14,288sqm                    7,130sqm                 8,555sqm                    2,860sqm
              four properties
             15.7% of income
                                         two properties
                                        5.0% of income
                                                                     one property
                                                                    3.0% of income
                                                                                           two properties 2.4%
                                                                                                of income
                                                                                                                        one property 1.0%
                                                                                                                           of income        •   The Australian Federal Government
                                                                                                                                                is the only tenant making up more
                                                                                                                                                than 5% of COF’s income

1. By income                                                                                                                                           CENTURIA OFFICE REIT   ASX:COF   17
2. By area
Valuation summary
   2H21 like for like valuation uplift of $16.3m1

                                                                                                                     PORTFOLIO VALUATION SUMMARY 1

     Leasing success and market fundamentals drive                                                                                                            FY21              HY21            VALUATION          FY21        HY21       MOVEMENT
                                                                                                                        STATE
      like for like valuation gain of $16.3m1 in 2HY21                                                                                                     VALUATION          VALUATION         MOVEMENT          WACR2        WACR2      WACR (BPS)2

                                                                                                                        LIKE FOR LIKE PORTFOLIO
                                                                                                                                                              2,014.3            1,987.7            26.6            5.81         5.91          (10)
                                                                                                                        / WEIGHTED AVERAGE

                                                                                                                        DISPOSALS                               0.0               44.7             (44.7)           n.a          5.50           n.a

                                                                                                                        TOTAL PORTFOLIO
                                                                                                                                                              2,014.3            2,032.4           (18.1)           5.81         5.90           (9)
                                                                                                                        / WEIGHTED AVERAGE

    Driving 2H21 NTA per                                         WACR2 reduced
    unit increase of 1.3%                                          to 5.81%                                          KEY VALUATION MOVEMENTS

              14
           ASSETS
                                         Externally valued in June 2021

                                                                                                                            1 Richmond Road, Keswick, SA              100 Brookes Street, Fortitude Valley, QLD       8 Central Avenue, Eveleigh, NSW
            Cap rate compression driven by investor
                                                                                                                     $4.2m (12%) increase in value created         $5.5m (7%) increase in value created            $10.0m (5%) increase in value from
             demand for metropolitan office assets                                                                    through proactive leasing, along with       through leasing of vacant space, along            cap rate compression (25bps), the
                                                                                                                          cap rate compression (25bps)              with cap rate compression (25bps)               result of improved WALE (8.8 yrs)

1. Reflects gross increase, excluding capital expenditure incurred
                                                                                                                                                                                                              CENTURIA OFFICE REIT      ASX:COF         18
2. Weighted average capitalisation rate                              Past performance is not a reliable indicator of future performance
Sustainability at Centuria Capital
                     Developing a flexible and relevant sustainability framework
                      Centuria Office REIT is externally managed by Centuria Capital (ASX:CNI) and benefits from Centuria Capital’s sustainability approach.

                      Centuria Capital will be releasing its first Sustainability Report later this year. Highlights relating to Centuria Office REIT to be featured in this report are
                      summarised here.
                     ENVIRONMENTAL

                                                                                                                                                             Environmental data                       CENTURIA OFFICE REIT
                                                      ESG Reporting                                          Climate Action                              Energy, emission (scope 1 & 2),              NABERS Sustainability
                                            Centuria Capital to release its first                   Supports the recommendations                          and water data collected for                 Portfolio Index Ratings
                                                  Sustainability Report                                      of the TCFD                                       assets within COF                      4.7 Energy | 3.2 Water
SELECT INITIATIVES

                                                                                        91%                                $1.0bn                                         94%
                     SOCIAL

                                                 Member of the                 Tenant engagement1                      Specialised healthcare real                Employee engagement2
                                              Diversity Council of             91% of surveyed tenants                 estate under management                       94% of employees enjoy
                                                   Australia                  would recommend Centuria                 Completed $72.2m of social                      working at Centuria
                                                                                 as an asset manager                     and affordable housing

                                                    BOARD
                     GOVERNANCE

                                              DIVERSIFICATION
                                        Appointment of 4 independent                                                                    First Modern Slavery
                                      directors to Group and RE Boards                         Culture & ESG                             Statement delivered
                                                                                                                                                                                GENDER DIVERSITY           Employee training
                                     CENTURIA CAPITAL: Kristie Brown                         Board Committee                            Over a third of Cleaning
                                                                                                                                                                                  AT CENTURIA               Code of Conduct
                                                                                                Established                           Contract by value assessed
                                        (ASX:COF)   CPFL: Nicole Green                                                                                                                                     Financial Education
                                                                                            Oversight of modern                      using the Property Council of              62% male employees
                                       (ASX:CIP)   CPFL2: Jennifer Cook,                                                                 Australia 365 platform                                               Cyber security
                                                                                             slavery, diversity &
                                                   Natalie Collins                                                                                                             38% female employees
                                                                                         inclusion, climate change
                                     1. Centuria Capital undertake regular tenant surveys. The figure reported is from the Group’s FY21 survey                                                                                   CENTURIA OFFICE REIT   ASX:COF   19
                                     2. Centuria Capital undertake regular employee engagement surveys The reported figure is from the Group’s FY21 survey
Sustainability – Centuria Office REIT
  Operational Efficiency and NABERS ratings

                                                                                                                         CASE STUDY | 1 RICHMOND ROAD, KESWICK, SA
CONSUMPTION/EMISSIONS INTENSITY                                          CY2020   CY2019
                                                                                                                         Increased NABERS energy rating from 3 Stars to
Energy consumption intensity                           MJ/sqm             263       329                                  5 Stars over three years through smart design and base
                                                                                                                         building upgrades, substantially increasing efficiency
Water consumption intensity                               L/sqm           481       826

Scope 1 and 2 GHG                                      kg CO2-
emissions intensity                                      e/sqm
                                                                            71       92           4.7 NABERS
                                                                                              Energy Sustainability
                                                                                            Portfolio Index Rating, up
                                                                                           from 4.5 the previous year

                        Improvement in COF’s
                           overall operational
                         efficiency have been
                        driven by a focus asset
                          upgrades under the
                        NABERS rating scheme
                                                                                               3.2 NABERS
                                                                                            Water Sustainability
                                                                                           Portfolio Index Rating
                                                                                                                                                                      1 RICHMOND ROAD, KESWICK, SA

 1. Refer to Appendix E for COF energy, water and waste emissions data                                                                         CENTURIA OFFICE REIT    ASX:COF             20
CLOSE PROXIMITY
                                                                  TO KEY AMENITY

                                            SECTION FIVE

                                            Market Overview
                                            & Guidance
                                            A S X:COF

                                                           CENTURIA OFFICE REIT    ASX:COF   21
NISHI, 2 PHILIP LAW STREET, CANBERRA, ACT
Lead indicators for office demand are positive
   Positive job creation across office-based industries

   AUSTRALIAN JOB CREATION (‘000 job growth YoY)
                                                                                                               Continued job creation across those industries
             Accommodation and Food Services                                                   235.9
                                                                                                               which traditionally consume office space is a lead
Professional, Scientific and Technical Services                                        127.3
                                                                                                                       indicator of future tenant demand
                                        Retail Trade                               123.2

                           Education and Training                                  120.7

              Health Care and Social Assistance                                  112.8                 Office Demand          Jobs growth                   Jobs
                                                                                                       Industries                (YoY)                 (YoY % change)
                    Arts and Recreation Services                                95.9

                                     Other Services                         91.5                       NSW                       132,509                       9

             Transport, Postal and Warehousing                           68.6
                                                                                                       VIC                       115,944                      11
                                      Manufacturing                 51.1

                                               Mining             41.7                                 QLD                       27,263                        3
            Administrative and Support Services                  30.5
                                                                                                       SA                        19,307                        7
                Public Administration and Safety             21.5

                Financial and Insurance Services           1.7                                         WA                         6,643                        2
   Information Media and Telecommunications              (6.0)
                                                                                                       TAS                       (2,699)                      (4)
        Rental, Hiring and Real Estate Services          (8.5)

                                        Construction    (16.6)
                                                                                                       NT                        (5,264)                      (10)
    Electricity, Gas, Water and Waste Services          (19.7)

                                  Wholesale Trade       (22.2)                                         ACT                       (6,564)                      (5)

                Agriculture, Forestry and Fishing       (52.7)
                                                                                                       TOTAL                     287,139                       7

Source: ABS, Labour Force Statistics, Jun-21                                                                                                      CENTURIA OFFICE REIT   ASX:COF 22
COF is exposed to Australia’s better performing office markets

                                               6 MTH NET   12 MTHS NET          RENTAL                        COF
                                  VACANCY                                                   UPCOMING
                    MARKET 1                 ABSORPTION    ABSORPTION      DISCOUNT TO                   EXPOSURE
                                       (%)                                                SUPPLY (SQM)
                                                   (SQM)         (SQM)   SYDNEY CBD (%)                        (%)

                     SYDNEY CBD    13.2       (5,744)      (157,554)          n.a          199,109       0.0%        •   Positive net
                                                                                                                         absorption evident in a
                     SYDNEY
                     FRINGE
                                   8.5        14,360        7,849           (45.0)          14,527       9.9%            number of COF’s markets
                     CHATSWOOD     17.2       (4,193)      (13,903)         (48.7)             0         4.6%
                                                                                                                     •   Several markets demonstrated
                     ST
                                   18.4       (8,196)       4,461           (47.0)          20,208       8.7%            improved tenant demand
                     LEONARDS
                                                                                                                         throughout FY21, notably in
                     MELBOURNE                                                                                           2HFY21
                                   14.1       (49,620)     (187,837)        (45.2)         343,906       10.9%
                     CBD

                     MELBOURNE
                                   15.3       47,050         600            (57.3)         228,581       3.3%
                                                                                                                     •   Weakest tenant demand
                     FRINGE                                                                                              in markets with no or low
                     BRISBANE
                                                                                                                         COF exposure
                                   15.9       (6,305)      (36,618)         (47.0)          60,243       0.0%
                     CBD

                     BRISBANE
                                                                                                                     •   COF exposed markets generally
                                   17.2       12,028       (21,034)         (58.6)         102,140       17.7%
                     FRINGE                                                                                              have lower upcoming supply
                     ADELAIDE      16.9       (2,121)      (17,825)         (62.9)          88,643       0.9%
                                                                                                                     •   COF exposed market rents
                     PERTH         19.7        5,926        7,910           (44.4)          79,200       0.0%            average a significant discount
                     WEST PERTH    22.3        3,138        (6,493)         (63.0)             0         1.7%            to Sydney CBD
                     CANBERRA      7.0         9,126        33,465          (67.0)         100,497       16.7%

                                                                                                                               CENTURIA OFFICE REIT   ASX:COF 23
1. Source: JLL
Strong investment demand for metropolitan office assets
     Transaction evidence underpins COF NTA

                                                                                                                                                                               PRICE   CAP RATE     RATE    OCCUPANCY      WALE
•     A basket of comparable property transactions strongly
                                                                                             PROPERTY

                                                                                             Pinnacle, 4 Drake Street, Macquarie Park
                                                                                                                                                           STATE

                                                                                                                                                            NSW
                                                                                                                                                                      DATE

                                                                                                                                                                      Sep-20
                                                                                                                                                                                ($M)
                                                                                                                                                                               306.0
                                                                                                                                                                                          (%)
                                                                                                                                                                                        5.25%
                                                                                                                                                                                                  ($PSQM)
                                                                                                                                                                                                   8,777
                                                                                                                                                                                                               (%)
                                                                                                                                                                                                               96.4%
                                                                                                                                                                                                                           (YRS)
                                                                                                                                                                                                                            4.6
      support COF valuations                                                                 45 Kembla Street, Wollongong                                   NSW       Sep-20    57.4    5.40%      8,820      100.0%        7.1
                                                                                             1 Giffnock Avenue, Macquarie Park                              NSW       Sep-20   167.2    5.75%      8,628      100.0%        3.0
•     Transaction evidence suggests further cap rate compression                             Schneider, North Ryde                                          NSW       Sep-20   145.0    5.10%      9,900       74.9%        7.0
      across COF’s portfolio                                                                 ATO, 45 Kembla Street, Wollongong                              NSW       Sep-20    58.4    5.13%      8,820      100.0%        6.9
                                                                                             14 Stratton Street, Newstead                                   QLD       Oct-20   122.5    4.84%     13,478      100.0%       10.0

•     Increased transactional activity occurred throughout FY21                              Australian Naval Infrastructure, 620 Mersey Road, Osborne
                                                                                             60 Miller Street, North Sydney
                                                                                                                                                             SA
                                                                                                                                                            NSW
                                                                                                                                                                      Oct-20
                                                                                                                                                                      Oct-20
                                                                                                                                                                                48.7
                                                                                                                                                                               273.0
                                                                                                                                                                                        5.03%
                                                                                                                                                                                        5.24%
                                                                                                                                                                                                   6,086
                                                                                                                                                                                                  14,061
                                                                                                                                                                                                              100.0%
                                                                                                                                                                                                               96.0%
                                                                                                                                                                                                                            9.3
                                                                                                                                                                                                                            3.0

•     Deep capital pool from domestic and offshore investors                                 53 Berry Street, North Sydney
                                                                                             1-5 Thomas Holt Drive, Macquarie Park
                                                                                                                                                            NSW
                                                                                                                                                            NSW
                                                                                                                                                                      Nov-20
                                                                                                                                                                      Feb-21
                                                                                                                                                                                54.0
                                                                                                                                                                               295.0
                                                                                                                                                                                        5.07%
                                                                                                                                                                                        5.70%
                                                                                                                                                                                                  15,690
                                                                                                                                                                                                   7,528
                                                                                                                                                                                                              100.0%
                                                                                                                                                                                                              100.0%
                                                                                                                                                                                                                            2.4
                                                                                                                                                                                                                            4.3

•     Strong demand for metropolitan and regional assets
                                                                                             Quads 2 and 3, Sydney Olympic Park
                                                                                             3 Richardson Place, North Ryde
                                                                                                                                                            NSW
                                                                                                                                                            NSW
                                                                                                                                                                      Mar-21
                                                                                                                                                                      Mar-21
                                                                                                                                                                                66.1
                                                                                                                                                                               115.0
                                                                                                                                                                                        6.40%
                                                                                                                                                                                        6.20%
                                                                                                                                                                                                   6,591
                                                                                                                                                                                                   6,691
                                                                                                                                                                                                               72.0%
                                                                                                                                                                                                              100.0%
                                                                                                                                                                                                                            1.3
                                                                                                                                                                                                                            2.6

              Reflects investment demand for assets that offer
                                                                                             68 Waterloo Road, Macquarie Park
                                                                                             11 Murray Rose Avenue, Sydney Olympic Park
                                                                                                                                                            NSW
                                                                                                                                                            NSW
                                                                                                                                                                      Apr-21
                                                                                                                                                                      Apr-21
                                                                                                                                                                               106.5
                                                                                                                                                                                53.5
                                                                                                                                                                                        5.30%
                                                                                                                                                                                        5.38%
                                                                                                                                                                                                   7,897
                                                                                                                                                                                                   9,412
                                                                                                                                                                                                              100.0%
                                                                                                                                                                                                               97.2%
                                                                                                                                                                                                                            3.9
                                                                                                                                                                                                                            5.2
               relative affordability and accessibility for occupiers                        241 O'Riordan Street, Mascot                                   NSW       Apr-21   151.5    5.94%      7,956       97.7%        2.6
                                                                                             UNSW, 221-227 Anzac Parade, Kensington                         NSW       Apr-21    80.2    5.10%      7,501      100.0%       10.8
                                                                                             545 Queen Street, Brisbane                                     QLD       May-21   117.5    6.02%      8,793      100.0%        4.2
                                                                                             395-405 Royal Parade, Parkville                                 VIC      May-21   138.7    4.50%     10,429      100.0%       12.3
                                                                                             ATO 913 Whitehorse Road, Box Hill                               VIC      May-21   230.0    4.60%     11,534      100.0%        8.4
                                                                                             Louisa Lawson Building 25 Cowlishaw Street, Greenway           ACT       May-21   306.0    4.38%     11,746      100.0%       10.1

5.17%2                              5.81%2
                                                                                             Red Cross 17 O'Riordan Street, Alexandria                      NSW       May-21   159.0    4.40%     12,519      100.0%        9.7

                                                                           (0.64%)           ATO 520 Smollett Street, Albury
                                                                                             38 Sydney Avenue, Barton
                                                                                                                                                            NSW
                                                                                                                                                            ACT
                                                                                                                                                                      May-21
                                                                                                                                                                      Jun-21
                                                                                                                                                                                84.5
                                                                                                                                                                                73.8
                                                                                                                                                                                        5.50%
                                                                                                                                                                                        5.05%
                                                                                                                                                                                                   7,987
                                                                                                                                                                                                   8,286
                                                                                                                                                                                                              100.0%
                                                                                                                                                                                                              100.0%
                                                                                                                                                                                                                            6.9
                                                                                                                                                                                                                            8.3
AVERAGE CAP RATE                 COF AVERAGE CAP RATE                  DIFFERENCE CAP RATE   33 Richmond Road, Keswick                                       SA       Jun-21    80.0    5.00%     12,247       85.0%       11.8
                                                                                             37 Epping Road, North Ryde                                     NSW       Jul-21    55.0    5.50%      6,817      100.0%        3.2
                                                                                             1 McNab Avenue, Footscray1                                      VIC      Aug-21   224.0    4.67%     11,000      100.0%       11.8
                                                                                                                                                          AVERAGE
 9,9812                              7,9122                                 2,069
                                                                                             TRANSACTIONS

                                                                                             PORTFOLIO
                                                                                                                                                         (WEIGHTED)
                                                                                                                                                            COF
                                                                                                                                                                                        5.17%

                                                                                                                                                                                        5.81%
                                                                                                                                                                                                  9,981

                                                                                                                                                                                                  7,912
    AVERAGE RATE                    COF AVERAGE RATE                       DIFFERENCE RATE
       ($psqm)                           ($psqm)                                ($psqm)      CHANGE                                                        DELTA                        -0.64%    2,069

1. Transaction yet to settle. Metrics approx and based on market sources
2. Weighted average
Sources: m3, KF and Savills.                                                                                                                                                           CENTURIA OFFICE REIT      ASX:COF           24
FY22 Guidance

                                                                                   16.6c
                                                                                     DISTRIBUTION
                                                                                                                                6.7%
                                                                                                                                 FORECAST FY22
                                                                                                                                                         2

                                                                                       PER UNIT1
                                                                                                                                  DISTRIBUTION

                                                                                                                                                                                                              42-46 COLIN STREET, WEST PERTH, WA
                                                                                                                                      YIELD
203 PACIFIC HIGHWAY, ST LEONARDS, NSW

                                                                                                                                         DISTRIBUTIONS
                                                                                                                                         PAID IN EQUAL
                                                                                                                                          QUARTERLY
                                                                                                                                         INSTALMENTS

                                                                                                                                                             18.0c
                                                                                                                                                             FFO PER UNIT1

                                        1. Guidance remains subject to unforeseen circumstances and material changes in operating conditions
                                                                                                                                                                             CENTURIA OFFICE REIT   ASX:COF                                        25
                                        2. Based on COF closing price of $2.47 per unit on 30 July 2021
A PORTFOLIO EXPOSED TO
                                                                                    AFFORDABLE MARKETS

                                            SECTION SIX

                                            Appendices
                                            Appendix
                                            A S X : C O F A – Income statement

                                            Appendix B – FFO reconciliation
                                            Appendix C – Balance sheet
                                            Appendix D – Portfolio valuation summary
                                            Appendix E – Environmental data
                                            Appendix F – Investment portfolio

                                                                            CENTURIA OFFICE REIT      ASX:COF   26
154 MELBOURNE STREET, SOUTH BRISBANE, QLD
Appendix A – Income statement

 $'000                                                                                                                                              FY21               FY20

 Gross property income                                                                                                                         170,617            149,240
 Interest income                                                                                                                                         7              106
 Total revenue                                                                                                                                 170,624            149,346
 Direct property expenses                                                                                                                        35,001             31,573
 Responsible entity fees                                                                                                                         11,543             10,421
 Finance costs                                                                                                                                   18,418             16,777
 Management and other administrative expenses                                                                                                      2,251             1,975
 Expected credit loss and rental waiver expense                                                                                                    1,176             3,232
 Total expenses                                                                                                                                  68,389             63,978
 Funds from operations1                                                                                                                        102,235              85,368
 Gain/(loss) on fair value of investment properties                                                                                            (15,137)          (38,102)
 Realised/unrealised loss on fair value of derivatives                                                                                             4,816           (4,876)
 Straight-lining of rental income and amortisation of leasing commissions and tenant incentives                                                (15,039)            (7,048)
 Goodwill impairment                                                                                                                                      -        (6,356)
 One off refinancing costs                                                                                                                                -        (5,942)
 Interest and depreciation expense adjustments for AASB 16                                                                                             61                   57
 Transaction costs                                                                                                                                        -            (48)
 Statutory net profit                                                                                                                            76,936             23,053                   825 ANNE STREET, FORTITUDE VALLEY, QLD

                                                                                                                                                                                 CENTURIA OFFICE REIT     ASX:COF           27
1. FFO is the Trust’s underlying and recurring earnings from its operations. This is calculated as the statutory net profit adjusted for certain non-cash and other items
Appendix B – FFO reconciliation

  $'000                                                                                                                                         FY21             FY20

  Statutory net profit                                                                                                                       76,936           23,053

  Loss/(gain) on fair value of investment properties                                                                                         15,137           38,102

  Realised/unrealised loss on fair value of derivatives                                                                                      (4,816)            4,876

  Straight-lining of rental income and amortisation of leasing commissions and tenant incentives                                             15,039             7,048

  Goodwill impairment                                                                                                                                 -         6,356

  One off refinancing costs                                                                                                                           -         5,942

  Interest and depreciation expense adjustments for AASB 16                                                                                      (61)             (57)

  Transaction costs                                                                                                                                   -             48
                                      2
  Funds from operations                                                                                                                    102,235            85,368

  Distribution                                                                                                                               84,896           84,487

  FFO per unit (cents)                                                                                                                           19.9             18.6

  Distribution per unit (cents)                                                                                                                  16.5             17.8

  Annualised FFO yield1 (%)                                                                                                                        8.5              9.0

  Annualised distribution yield2 (%)                                                                                                               7.0              8.6                60 MARCUS CLARKE STREET, CANBERRA, ACT

1. FFO is the Trust’s underlying and recurring earnings from its operations. This is calculated as the statutory net profit adjusted for certain non-cash and other items
                                                                                                                                                                            CENTURIA OFFICE REIT     ASX:COF           28
2. Based on the COF full year guidance divided by closing price ($2.34 per unit on 30 June 2021) and FY20 FFO divided by closing price ($2.07 per unit on 30 June 2020)
Appendix C – Balance sheet

  $'000                                                                                              30-Jun-21   30-Jun-20

  Cash                                                                                                 15,644      28,809
                                  1
  Investment properties                                                                              2,046,221   2,085,650
  Trade and other receivables                                                                           5,369       3,263
  Other assets                                                                                          1,625       1,536
  Total assets                                                                                       2,068,859   2,119,258
                                       2
  Interest bearing liabilities                                                                        700,800     746,372
  Trade and other liabilities                                                                          31,943      22,260
  Derivative financial instruments                                                                      7,240      12,056
                        3
  Other liabilities                                                                                    53,884      55,618
  Total liabilities                                                                                   793,867     836,306

  Net assets                                                                                         1,274,992   1,282,952

  Units on issue (thousands)                                                                          514,522     514,522
  Net tangible assets per unit ($)                                                                        2.48        2.49
  Gearing (%)4                                                                                            33.5        34.5

                                                                                                                                            235 WILLIAM STREET, NORTHBRIDGE, WA
1. Investment properties of $2,046.2m includes a $32.0m leasehold asset under AASB 16
2. Drawn debt net of borrowing costs
3. Includes $21.2m distributions payable and lease liability of $32.7m
4. Gearing is defined as total borrowings less cash divided by total assets less cash and goodwill                           CENTURIA OFFICE REIT     ASX:COF           29
Appendix D – Portfolio valuation summary
                                                                                                      BOOK VALUE ($M)                                             CAP RATE (%)
                                   STATE                                            FY21 BOOK VALUE       HY21           VAR       %                       FY21                   HY21         BPS

                                    NSW                                                      503.5       488.0          15.5      3.2                      5.48                   5.67      (19.0)
     PORTFOLIO                      QLD                                                      475.5       471.8            3.7     0.8                      6.23                   6.27       (4.0)
     VALUATION                      VIC                                                      354.5       351.0            3.5     1.0                                                        (4.0)
                                                                                                                                                           5.32                   5.36
     SUMMARY1                       ACT                                                      335.8       333.7            2.1     0.6                                                       (15.0)
                                                                                                                                                           5.47                   5.62
                                    WA                                                       286.8       290.0          (3.2)   (1.1)                      6.44                   6.47       (3.0)
                                    SA                                                        58.2        53.3            4.9     9.2                      7.00                   7.25      (25.0)
                                    TOTAL                                                  2,014.3     1,987.7          26.6      1.3                      5.81                   5.91      (10.0)

                                                                                                                                 COF: NISHI, 2 PHILIP LAW STREET, CANBERRA, ACT

                                           COF: 54 MARCUS CLARKE STREET, CANBERRA, ACT

                       COF: 60 MARCUS CLARKE STREET, CANBERRA, ACT

                                                                                                                                                                    CENTURIA OFFICE REIT   ASX:COF   30
 1. Past Performance is not a reliable indicator of future performance
COF CANBERRA PORTFOLIO
Appendix E – Environmental Data

                                                                                                                                               UNIT OF MEASURE                  CY20        CY19

                                                                            NLA (annual weighted average)                                             sqm                      300,537    224,012
Environmental Data reported is for calendar years 2019
and 2020. Reported figures only represent data for assets
within the Centuria Office REIT.                                            RESOURCE CONSUMPTION                         (OPERATIONALLY CONTROLLED PROPERTIES)
Environmental data is reported where Centuria is deemed                     Base building grid connected electricity                                  MWh                      18,159      18,051
to have operational control of an asset.
                                                                            Gas use (whole building)                                                  MWh                       3,798       2,423
OPERATIONAL CONTROL                                                         Water use (whole building)                                                  kL                     144,576    185,134
Operational Control refers to Centuria’s capacity to directly manage the
day-to-day activities of assets, by employing Centuria’s or a nominated     GHG EMISSIONS               (OPERATIONALLY CONTROLLED PROPERTIES)
delegates management policies. This definition is consistent with the
principals outlined in the National Greenhouse and Energy Reporting Act     Scope 1                                                                 tCO2-e                      705          450
2007.                                                                       Scope 2                                                                 tCO2-e                     20,720      20,071
EMISSIONS                                                                   Total scope 1 and 2                                                     tCO2-e                     21,425      20,520
Centuria use emissions factors from each corresponding years National       Scope 3 (metered tenant usage)                                          tCO2-e                      5,901       5,210
Greenhouse and Energy Reporting (Measurement) Determination.
Emissions are reported for material energy sources collected including      CONSUMPTION / EMISSIONS INTENSITY
electricity and natural gas.
                                                                            Energy consumption intensity                                            MJ/sqm                      263          329
ENVIRONMENTAL DATA FOR FY2021                                               Water consumption intensity                                              L/sqm                      481          826
Environmental Data for FY2021 will be disclosed in Centruria’s first        Scope 1 and 2 GHG emissions intensity                              kg CO2-e/sqm                      71          92
Sustainability Report to be released later this year.

                                                                           Data Excludes: 131-139 Grenfell Street, Adelaide, SA and 483 Kingsford Smith Drive, Hamilton, QLD

                                                                                                                                                                  CENTURIA OFFICE REIT   ASX:COF    31
Appendix F – Investment portfolio

  PROPERTY                                                              STATE       OWNERSHIP (%)   BOOK VALUE ($M)   CAPITALISATION RATE (%)   AREA (SQM)   AREA ($/SQM)    WALE (YRS)1     OCCUPANCY (%)1

  8 Central Avenue, Eveleigh                                             NSW                 50%           $200.0m                     5.13%        36,619          10,923           9.4             99.4%
  201 Pacific Highway, St Leonards                                       NSW                 50%           $107.0m                     5.63%        16,498          12,971           2.9             98.7%
  9 Help Street, Chatswood                                               NSW                100%            $92.5m                     5.38%         9,384           9,858           2.2             90.9%
  203 Pacific Highway, St Leonards                                       NSW                 50%            $68.0m                     5.75%        11,735          11,590           3.8             99.3%
  77 Market Street, Wollongong                                           NSW                100%            $36.0m                     6.75%         6,755           5,330           4.0            100.0%
  2 Phillip Law Street, Canberra                                          ACT               100%           $252.0m                     5.00%        27,411           9,193           6.9             99.9%
  60 Marcus Clarke Street, Canberra                                       ACT               100%            $61.0m                     6.75%        12,094           5,044           2.1             76.9%
  54 Marcus Clarke Street, Canberra                                       ACT               100%            $22.8m                     7.25%         5,200           4,384           4.0             89.8%
  825 Ann Street, Fortitude Valley                                       QLD                100%           $155.0m                     6.00%        19,151           8,094           2.7            100.0%
  100 Brookes Street, Fortitude Valley                                   QLD                100%            $82.0m                     6.00%         9,533           8,602           4.9            100.0%
  154 Melbourne Street, South Brisbane                                   QLD                100%            $80.5m                     6.00%        11,292           7,129           2.0             99.0%
  483 Kingsford Smith Drive, Hamilton                                    QLD                100%            $77.0m                     6.25%         9,241           8,332           4.8             96.3%
  35 Robina Town Centre Drive, Robina                                    QLD                100%            $42.0m                     7.50%         9,003           4,665           1.0             88.6%
  555 Coronation Drive, Toowong                                          QLD                100%            $39.0m                     6.75%         5,567           7,006           5.7            100.0%
  818 Bourke Street, Docklands                                            VIC               100%           $220.0m                     5.13%        23,096           9,525           1.8             60.7%
  2 Kendall Street, Williams Landing                                      VIC               100%            $69.0m                     5.75%        12,961           5,324           7.4            100.0%
  576 Swan Street, Richmond                                               VIC               100%            $65.5m                     5.50%         8,240           7,949           2.8             66.6%
  1 Richmond Road, Keswick                                                 SA               100%            $39.2m                     7.00%         8,085           4,848           4.1            100.0%
  131-139 Grenfell Street, Adelaide                                        SA               100%            $19.0m                     7.00%         4,059           4,681           3.3            100.0%
  235 William Street, Northbridge                                          WA               100%           $181.8m                     6.50%        21,575           8,424           4.3             94.9%
  144 Stirling Street, East Perth                                          WA               100%            $70.0m                     6.00%        11,042           6,340           7.5            100.0%
  42-46 Colin Street, West Perth                                           WA               100%            $35.0m                     7.00%         8,467           4,134           2.0            100.0%

  Total / Weighted Average2                                                                              $2,014.3m                     5.81%       287,007           7,912           4.3                93.1%

1. By gross income (equity share)
2. Investment properties $2,014.3m, excludes $32.0m leasehold asset under AASB 16                                                                                     CENTURIA OFFICE REIT    ASX:COF           32
Disclaimer
This presentation has been prepared by Centuria Property Funds Limited (ABN 11 086 553 639, AFSL 231             The information in this presentation has been obtained from and based on sources believed by CPFL
149) (CPFL) as responsible entity of Centuria Office REIT (ARSN 124 364 718) (‘COF’ or the ‘Trust’).             to be reliable.

This presentation contains selected in summary information and does not purport to be all-inclusive or to        To the maximum extent permitted by law, CPFL and its related bodies corporate make no representation
contain all of the information that may be relevant, or which a prospective investor may require in              or warranty, express or implied, as to the accuracy, completeness, timeliness or reliability of the contents
evaluations for a possible investment COF. It should be read in conjunction with COF’s periodic and              of this presentation. To the maximum extent permitted by law, CPFL does not accept any liability
continuous disclosure announcements which are available at www.centuria.com.au. The recipient                    (including, without limitation, any liability arising from fault or negligence) for any loss whatsoever arising
acknowledges that circumstances may change and that this presentation may become outdated as a                   from the use of this presentation or its contents or otherwise arising in connection with it.
result. This presentation and the information in it are subject to change without notice and CPFL is not
obliged to update this presentation.                                                                             This presentation may contain forward-looking statements, guidance, forecasts, estimates, prospects,
                                                                                                                 projections or statements in relation to future matters (‘Forward Statements’). Forward Statements can
This presentation is provided for general information purposes only. It is not a product disclosure              generally be identified by the use of forward looking words such as “anticipate”, “estimates”, “will”,
statement, pathfinder document or any other disclosure document for the purposes of the Corporations             “should”, “could”, “may”, “expects”, “plans”, “forecast”, “target” or similar expressions. Forward
Act and has not been, and is not required to be, lodged with the Australian Securities & Investments             Statements including indications, guidance or outlook on future revenues, distributions or financial
Commission. It should not be relied upon by the recipient in considering the merits of COF or the                position and performance or return or growth in underlying investments are provided as a general guide
acquisition of units in COF. Nothing in this presentation constitutes investment, legal, tax, accounting or      only and should not be relied upon as an indication or guarantee of future performance. No independent
other advice and it is not to be relied upon in substitution for the recipient’s own exercise of independent     third party has reviewed the reasonableness of any such statements or assumptions. No member of
judgment with regard to the operations, financial condition and prospects of COF.                                CPFL represents or warrants that such Forward Statements will be achieved or will prove to be correct
                                                                                                                 or gives any warranty, express or implied, as to the accuracy, completeness, likelihood of achievement
The information contained in this presentation does not constitute financial product advice. Before              or reasonableness of any Forward Statement contained in this presentation. Except as required by law
making an investment decision, the recipient should consider their own financial situation, objectives and       or regulation, CPFL assumes no obligation to release updates or revisions to Forward Statements to
needs, and conduct their own independent investigation and assessment of the contents of this                    reflect any changes. The reader should note that this presentation may also contain pro forma financial
presentation, including obtaining investment, legal, tax, accounting and such other advice as they               information.
considers necessary or appropriate. This presentation has been prepared without taking account of any
person’s individual investment objectives, financial situation or particular needs. It is not an invitation or   Distributable earnings is a financial measure which is not prescribed by Australian Accounting Standards
offer to buy or sell, or a solicitation to invest in or refrain from investing in, units in COF or any other     (AAS) and represents the profit under AAS adjusted for specific non-cash and significant items.
investment product.                                                                                              The Directors consider that distributable earnings reflect the core earnings of the Trust.

                                                                                                                 All dollar values are in Australian dollars ($ or A$) unless stated otherwise.
                                                                                                                                                                                   CENTURIA OFFICE REIT         ASX:COF            33
CENTURIA OFFICE REIT   ASX:COF   34
You can also read