Characterisation of gas reference materials for underpinning atmospheric measurements of stable isotopes of nitrous oxide
←
→
Page content transcription
If your browser does not render page correctly, please read the page content below
Atmos. Meas. Tech., 14, 5447–5458, 2021
https://doi.org/10.5194/amt-14-5447-2021
© Author(s) 2021. This work is distributed under
the Creative Commons Attribution 4.0 License.

Characterisation of gas reference materials for underpinning
atmospheric measurements of stable isotopes of nitrous oxide
Ruth E. Hill-Pearce1 , Aimee Hillier1 , Eric Mussell Webber1 , Kanokrat Charoenpornpukdee1,2 , Simon O’Doherty2 ,
Joachim Mohn3 , Christoph Zellweger3 , David R. Worton1 , and Paul J. Brewer1
1 National
         Physical Laboratory, Hampton Road, Teddington, TW11 0LW, United Kingdom
2 Atmospheric Chemistry Research Group, University of Bristol, Bristol, United Kingdom
3 Empa, Swiss Federal Laboratories for Materials Science and Technology, Laboratory for Air Pollution/

Environmental Technology, Dübendorf, Switzerland

Correspondence: Ruth E. Hill-Pearce (ruth.pearce@npl.co.uk)

Received: 17 February 2021 – Discussion started: 25 February 2021
Revised: 21 May 2021 – Accepted: 1 June 2021 – Published: 9 August 2021

Abstract. The precise measurement of the amount fraction          332 nmol mol−1 have been published by the WMO (WMO,
of atmospheric nitrous oxide (N2 O) is required to understand     2020). The growing field of N2 O research is focused on im-
global emission trends. Analysis of the site-specific stable      proving understanding of the global N2 O budget. A compre-
isotopic composition of N2 O provides a means to differenti-      hensive identification of the N2 O sources and sinks and the
ate emission sources. The availability of accurate reference      contribution of each to the global N2 O budget is required for
materials of known N2 O amount fractions and isotopic com-        N2 O mitigation studies (Lewicka-Szczebak et al., 2014).
position is critical for achieving these goals. We present the       Anthropogenic N2 O is released into the atmosphere
development of nitrous oxide gas reference materials for un-      mainly via multiple reaction pathways from soil and ma-
derpinning measurements of atmospheric composition and            rine sources as a result of fertiliser use and technical emis-
isotope ratio. Uncertainties target the World Metrological Or-    sions from industrial and combustion processes (Snider et
ganisation Global Atmosphere Watch (WMO-GAW) com-                 al., 2015; Kantnerová et al., 2019; Toyoda et al., 2017).
patibility goal of 0.1 nmol mol−1 and extended compatibility      These different sources emit N2 O with distinct isotopic com-
goal of 0.3 nmol mol−1 , for atmospheric N2 O measurements        positions, which can be used as an isotopic signature or
in an amount fraction range of 325–335 nmol mol−1 . We also       fingerprint for identification (Denk et al., 2017). The most
demonstrate the stability of amount fraction and isotope ra-      abundant N2 O isotopocules are 14 N14 N16 O, 14 N14 N18 O,
tio of these reference materials and present a characterisation   14 N15 N16 O and 15 N14 N16 O. The site-specific isotopomers

study of the cavity ring-down spectrometer used for analysis      display 15 N substitution at the central, alpha (α, 14 N15 N16 O)
of the reference materials.                                       and the terminal beta (β, 15 N14 N16 O) positions.
                                                                     Isotopic abundances are given in the delta notation (δ) and
                                                                  expressed as the amount fraction ratio (x) of minor to major
                                                                  isotopic species in a sample (Rsample ), relative to a reference
1   Introduction                                                  value (Rreference ). For δ 15 N, the isotope abundance scale is
                                                                  AIR-N2 , and for δ 18 O it is VSMOW (Vienna Standard Mean
Nitrous oxide (N2 O) is a greenhouse gas with a global            Ocean Water) (Toyoda and Yoshida, 1999). As differences in
warming potential approximately 265 times that of carbon          isotopic composition between sample and reference are usu-
dioxide (CO2 ) (Myhre et al., 2013). Atmospheric amount           ally small, delta values are generally expressed in per mille
fractions of N2 O are increasing at a rate of ∼ 0.36 % yr−1       (‰).
(WMO, 2019b). Recent measurements of N2 O in the unpol-
luted troposphere are in an amount fraction range of 325–
335 nmol mol−1 (WMO, 2019a). Current amount fractions of

Published by Copernicus Publications on behalf of the European Geosciences Union.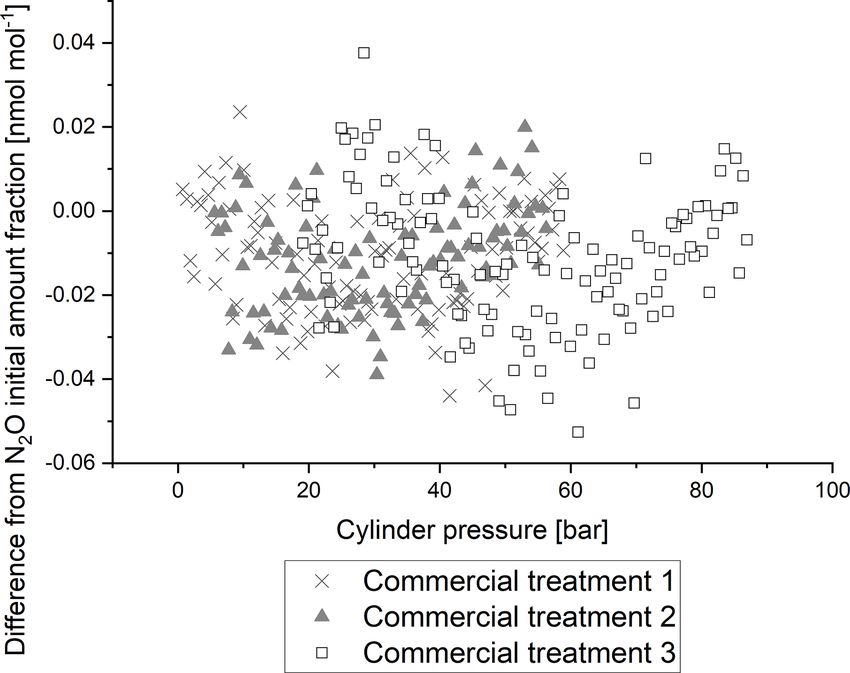
5448                                        R. E. Hill-Pearce et al.: Stable isotopes of nitrous oxide gas reference materials

                                                                   tion of the small variations in isotopocule abundances ob-
           15 N
                                                                  servable in ambient N2 O (Ostrom and Ostrom, 2017). Iso-
       x                                                           tope ratio reference materials are required which span the
R=         14 N
                                                           (1)
       x                                                           full range expected in ambient N2 O samples and covered

                      Rsample
                                                                  by the World Metrological Organisation (WMO) scale (260–
δ 15 N[‰] =                      −1                         (2)    370 nmol mol−1 ). The currently available pure N2 O sec-
                      Rreference
                                                                   ondary reference materials USG5S1 and USG5S2 (Reston
Isotopologue quantification is well established for atmo-          Stable Isotope Laboratory) differ in their δ 15 Nα and δ 15 Nβ
spheric CO2 (Flores et al., 2017). However, quantification         values but span a narrow range of δ 15 N and δ 18 O values
of N2 O isotopocules proves a greater analytical challenge         (< 1 ‰), limiting applicability for use as calibration mate-
due to (i) substantially lower atmospheric amount fractions;       rials (Ostrom et al., 2018). The availability of N2 O isotope
(ii) analytical difficulties in the provision of position speci-   ratio reference materials has the potential to improve calibra-
ficity of the standard technique, isotope ratio mass spectrom-     tion of analytical instrumentation and increase interlabora-
etry (IRMS), due to difficulty in the application of correc-       tory agreement.
tion factors to account for the re-arrangement of 15 N and 14 N       Crucial for the development of reference materials is the
within the ion source (Mohn et al., 2014); and (iii) the lack      stability of the N2 O composition and isotope ratio. Gane-
of internationally accepted N2 O isotope reference materials       san et al. (2013) reported no significant drift in amount frac-
with stated uncertainty (Ostrom et al., 2018).                     tion for a 325 nmol mol−1 N2 O in compressed air reference
   In summary, this results in a limited compatibility of labo-    material in an aluminium cylinder (Scott Marrin, now Prax-
ratory analyses for N2 O isotope measurements (Mohn et al.,        air) over a 3-year period. Similar findings were reported by
2014). In turn, an improvement in standardisation of the as-       Lushozi et al. (2019), but no study is available yet on the sta-
signment of delta values, within and between laboratories,         bility of the N2 O isotope ratio at ambient amount fractions.
can only be achieved through calibration with accurate iso-        In addition, improvements in the preparation and availability
tope ratio reference materials.                                    of N2 O reference materials at ambient amount fraction is re-
   Atmospheric N2 O has a relative abundance of                    quired to achieve the challenging WMO-GAW compatibility
0.9903 mol mol−1 for the major isotopolocule 14 N14 N16 O.         goals (Brewer et al., 2019b).
The minor isotopocules 14 N15 N16 O, 15 N14 N16 O and                 We present work on the development of N2 O reference
14 N14 N18 O display a relative abundance of 3.64 × 10⁻³ ,         materials for underpinning atmospheric composition and iso-
3.64 × 10⁻³ and 1.99 × 10⁻³ mol mol−1 , respectively               tope ratio with uncertainties targeting the WMO-GAW com-
(Kantnerová et al., 2019). This corresponds to less than           patibility goals. We describe the characterisation of preci-
1 nmol mol−1 for 14 N14 N18 O in ambient amount fraction           sion, repeatability and drift of a CRDS laser spectrometer.
N2 O reference materials. High-sensitivity instrumentation is      We also present work on all elements of the preparation pro-
required to precisely quantify the low amount fractions of         cess such as gravimetry, purity analysis, validation, stabil-
the minor N2 O isotopocules (Griffith et al., 2012).               ity, passivation of storage media and matrix effects. These
   Recent advances in spectroscopic instrumentation have           developments are extended to multi-component mixtures of
improved N2 O isotopolocule quantification. Cavity ring-           N2 O with other greenhouse gases (CO2 , CH4 and CO) in a
down spectroscopy (CRDS) has been applied to the real-             synthetic air matrix containing atmospheric amount fractions
time amount fraction and isotopic composition measure-             of argon, oxygen and nitrogen, as required for calibration of
ments of N2 O in ambient air. In the laboratory, this tech-        spectroscopic instruments for atmospheric measurements.
nique has demonstrated a precision (Allan deviation) of
< 0.05 nmol mol−1 for N2 O amount fraction and < 0.5 ‰
for δ 15 Nα , δ 15 Nβ and δ 18 O-N2 O with 5 min averaging         2     Experimental
times (Harris et al., 2020; Erler et al., 2015). This preci-
sion is comparable with off-axis integrated cavity output          2.1    Gravimetric preparation of primary reference
spectroscopy (OA-ICOS) analysis (van der Schoot et al.,                   materials (PRMs)
2015), which demonstrated in-field analytical precisions of
< 0.07 nmol mol−1 , and superior to the standard technique         All primary reference materials (PRMs) were prepared by
for N2 O amount fraction, gas chromatography with electron         gravimetry, in accordance with ISO 6142-1:2015, in 10 L
capture detector (GC–ECD) (Lopez et al., 2015). For δ 15 Nα        aluminium cylinders (Luxfer) with a range of outlet di-
and δ 15 Nβ the performance of CRDS is approaching IRMS            aphragm valves (Ceodeux): BS341 no. 14, DIN 477 no. 1 and
(Ostrom et al., 2018).                                             DIN 447 no. 8. The cylinders have SGS™ internal surface
   Advances in instrumentation must be coupled with ad-            (Luxfer) or were treated internally with a range of propri-
vances in high-precision isotope ratio reference materials,        etary passivation processes including SpectraSeal™ (BOC),
particularly for the calibration of the site-specific isotopic     Megalong™ and Aculife IV/III™ (Air Liquide). Cylinders
composition δ 15 Nα and δ 15 Nβ , to achieve accurate calibra-     were evacuated using an oil-free pump (Scrollvac SC15D,

Atmos. Meas. Tech., 14, 5447–5458, 2021                                             https://doi.org/10.5194/amt-14-5447-2021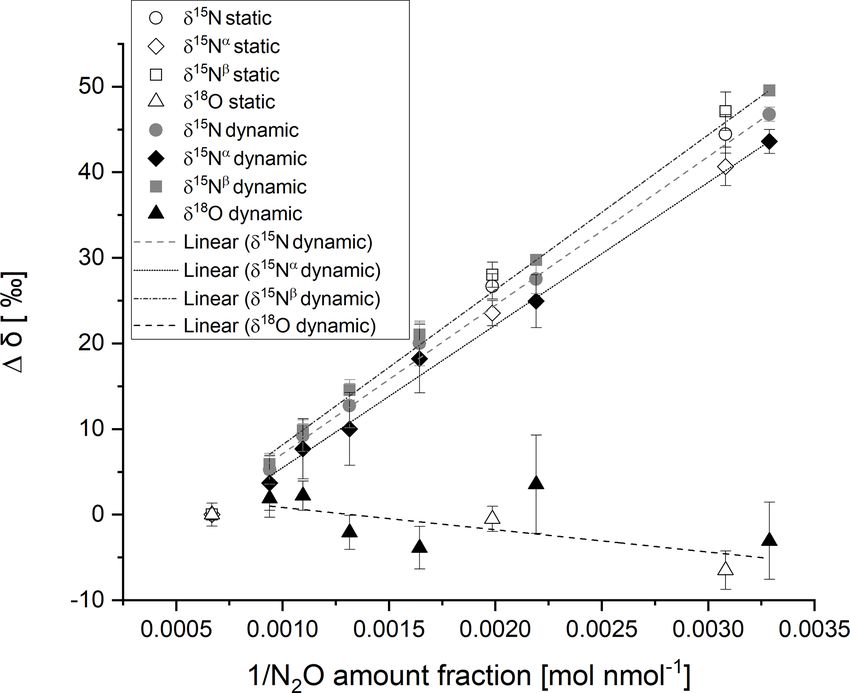
R. E. Hill-Pearce et al.: Stable isotopes of nitrous oxide gas reference materials                                              5449

Leybold Vacuum) and turbo molecular pump with magnetic            quired. The amount fraction of N2 O in the matrix was deter-
bearing (Turbovac 340M, Leybold Vacuum) to a pressure of          mined by standard addition of a 325 nmol mol−1 reference
< 3 × 10⁻⁷ mbar. Synthetic air was gravimetrically produced       material into a synthetic air prepared with the same argon-in-
by blending argon (BIP+, Air Products), oxygen (N6.0,             nitrogen premix and the same oxygen and nitrogen cylinders.
BOC) and nitrogen (BIP+, Air Products) to match atmo-             This method, as described in Hill-Pearce et al. (2018), deter-
spheric amount fractions (0.94, 20.96 and 78.10 cmol mol−1 ,      mined 0.75 ± 0.09 nmol mol−1 N2 O in the synthetic air ma-
respectively) (Tohjima et al., 2009). The purity of the ma-       trix.1 The zero offset of the analyser was determined by re-
trix gas was assessed for amount fraction of N2 O as detailed     moval of trace N2 O in the matrix gas (SAES Getter/Entegris
below.                                                            PS15 GC-50).
   The reference materials were produced gravimetrically by
the addition of N2 O (5.0, Air Liquide) via a transfer ves-       2.2   Preparation of reference materials for studying the
sel (capped 1/4 in. diameter tube, with a nominal volume                influence of pressure on composition
of 45 mL, Swagelok, electro-polished stainless steel). The
transfer vessel was weighed against a tare vessel matched for     Aluminium cylinders (0.85 L, Luxfer) were filled to 30–
size and shape before and after N2 O addition into the evac-      35 bar with a 325 nmol mol−1 N2 O in synthetic air reference
uated cylinder (Mettler-Toledo XP2004S, ±0.3 mg weigh-            material. Within 1 week of filling, the cylinders were sam-
ing uncertainty). The N2 O was introduced into the evacuated      pled at an excess flow rate of 0.5 L min−1 into the CRDS
cylinder through expansion to vacuum. Filling via a transfer      analyser (Picarro G5131-i), until the cylinders were at am-
vessel was used to achieve low uncertainty on the addition of     bient pressure. The cylinder pressure was monitored during
small masses. Nitrogen was added via direct addition to the       sampling with a pressure transducer (Omega PXM 319), and
cylinder, through purged 1/16 in. tubing (Swagelok, electro-      data were recorded via LabVIEW.
polished stainless steel) to produce reference materials with        In a second approach, 325 nmol mol−1 N2 O in syn-
nominal N2 O amount fractions of 500 µmol mol−1 . The mass        thetic air reference materials were prepared from the same
of nitrogen added was determined by weighing of the cylin-        500 µmol mol−1 N2 O reference material in 10 L cylinders
der before and after addition against a tare cylinder on an au-   with three different commercially available internal passiva-
tomatic weighing facility, developed by the Korean Research       tion processes. The cylinders were sampled into the CRDS
Institute for Standards and Science (KRISS) (Mettler-Toledo       analyser following the same procedure as for the 0.85 L
XP26003L, ±3 mg weighing uncertainty) (Lim et al., 2017).         cylinders.
   Atmospheric amount fraction reference materials in the
                                                                  2.3   Analytical methods
range 300–360 nmol mol−1 N2 O were prepared by the addi-
tion of 500 µmol mol−1 N2 O reference materials via a trans-      A cavity ring-down spectrometer (Picarro G5131-i) was used
fer vessel into an evacuated 10 L cylinder and dilution with      for the analysis of the ambient amount fraction N2 O mix-
synthetic air by the direct addition of argon, oxygen and         tures. The instrument allows simultaneous monitoring of
nitrogen at atmospheric amount fractions (Tohjima et al.,         N2 O amount fraction and isotopic composition through mea-
2009). The cylinder was weighed before and after each ma-         surement of the bulk δ 15 N, δ 18 O, and site-specific δ 15 Nα and
trix gas addition. Argon was added to the cylinder from a         δ 15 Nβ . Bulk δ 15 N is calculated as the average of the site-
30 % argon-in-nitrogen pre-mixture cylinder.                      specific δ 15 Nα and δ 15 Nβ . The instrument comprises an in-
   Gravimetric uncertainties associated with the preparation      ternal pump and a critical orifice to reduce the gas flow into
of N2 O reference materials were calculated according to          the cavity of the analyser. An excess flow was provided to
the Guide to the Expression of Uncertainty in Measurement         the instrument (0.5 L min−1 ), and the excess was vented to
(BIPM et al., 2008). The gravimetric uncertainty associated       the atmosphere to ensure stable (atmospheric) inlet pressure
with the N2 O amount fraction in the prepared mixtures is de-     and no contamination with ambient air.
termined by the software package gravcalc2 (Brown, 2009),            Analysis of the amount fraction of argon in the 30 %
which combines the uncertainty in relative molar mass, the        argon-in-nitrogen pre-mixture cylinders was performed by
uncertainty in the mass of the parent mixture addition, and       gas chromatography with a thermal conductivity detec-
the uncertainty in the amount fraction of N2 O in the parent      tor (GC–TCD; Agilent 6890) using a capillary column
mixture according to ISO 6142 (ISO, 2015).                        (Molsieve 5A, 30 m × 0.53 mm × 0.50 µm) operated isother-
   The total gravimetric uncertainty of the reference mate-       mally at 30 ± 1 ◦ C.
rial combines gravimetric uncertainty from the uncertainty in
mass added in each addition with uncertainty in the amount
of N2 O in the matrix gases. For low amount fraction refer-
ence materials, the total uncertainty can be dominated by un-
certainty in accurately quantifying trace amount fractions of         1 There is ongoing research to improve the accuracy of the quan-
the compound of interest within the matrix gases. As such,        tification of trace N2 O in the synthetic air matrix which may form
a careful analysis of the trace N2 O in the matrix gases is re-   the basis of a future publication.

https://doi.org/10.5194/amt-14-5447-2021                                             Atmos. Meas. Tech., 14, 5447–5458, 2021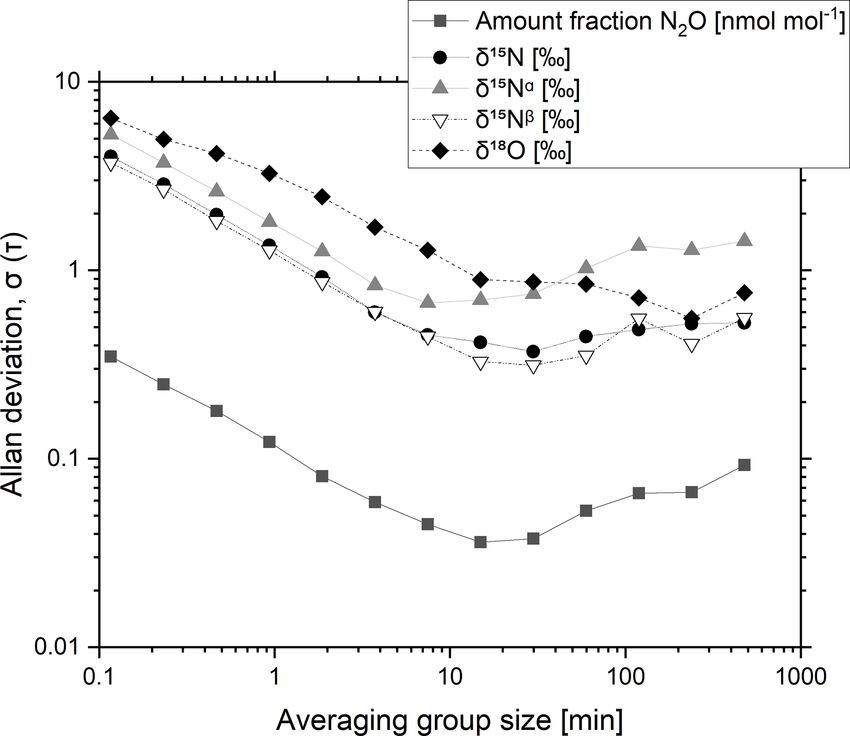
5450                                        R. E. Hill-Pearce et al.: Stable isotopes of nitrous oxide gas reference materials

                                                                  150–1100 nmol mol−1 by dilution from a 320 µmol mol−1
                                                                  N2 O-in-synthetic-air reference material with synthetic air us-
                                                                  ing a dynamic dilution device comprising one diluent and
                                                                  three standard critical flow orifices (Hill-Pearce et al., 2018).
                                                                  The static and dynamic reference materials were generated
                                                                  alternately for four iterations, with synthetic air measured
                                                                  between each set. Due to the large number of measurements
                                                                  recorded, a reduced sampling time of 5 min was adopted for
                                                                  each measurement interval, resulting in a slightly lower stan-
                                                                  dard deviation of 0.03 nmol mol−1 for amount fractions.

                                                                  3.3   Delta 15 N

                                                                  The δ 15 N values analysed by the G5131-i analyser were
                                                                  recorded for each static and dynamic reference material
                                                                  for four repetitions of 5 min. The mean value of the sta-
Figure 1. Typical Allan deviation plot for a CRDS N2 O iso-       ble response was calculated. The change in reported delta
tope analyser (G5131-i) as a function of averaging time for a     value with amount fraction was assessed and found to vary
325 nmol mol−1 N2 O reference material.                           with a linear function with respect to the reciprocal of N2 O
                                                                  amount fraction as reported by Harris et al. (2020) for the
                                                                  same CRDS model, with a different year of manufacture.
3     Characterisation of the CRDS                                Figure 2 shows the CRDS analyser response to δ 15 N for
                                                                  static and dynamic reference materials prepared from the
3.1    Analytical uncertainty                                     same pure N2 O source in the amount fraction range of 300–
                                                                  1500 nmol mol−1 . Winther et al. (2018) reported the same
Allan deviation                                                   trend for dependence of reported δ 15 N on N2 O amount frac-
                                                                  tion, attributing the amount fraction dependence to offsets in
A 325 nmol mol−1 N2 O-in-synthetic-air reference material         the measurement of 14 N15 N16 O and 15 N14 N16 O. The agree-
was analysed continuously over 25 h, collecting temporal          ment between static and dynamic reference materials is dis-
trends of N2 O amount fractions and isotope delta values. The     cussed in the results section.
Allan deviation was calculated to assess the optimum averag-
ing time and the maximum precision (Fig. 1).                      3.4   Delta 18 O
   The Allan deviation initially decreases with an in-
crease in the averaging time and reaches a minimum for            Similarly, the δ 18 O channel response was recorded for static
N2 O amount fractions (0.036 nmol mol−1 ) and delta values        and dynamic reference materials. No variation in reported
δ 15 N (0.37 ‰), δ 15 Nα (0.67 ‰), δ 15 Nβ (0.33 ‰) and δ 18 O    δ 18 O was observed between the analyser response of the
(0.89 ‰) for averaging times of around 15 min. For longer         static and dynamic reference materials beyond the measure-
averaging times, an increase in the Allan deviation is shown      ment uncertainty for N2 O amount fractions over the range of
and likely to be a result of analyser drift. An averaging time    300–1500 nmol mol−1 (Fig. 2). Harris et al. (2020) reported a
of 10 min was adopted to ensure both minimal uncertainty          linear increase in δ 18 O of ∼ 4 ‰ with the reciprocal of N2 O
for comparing the reference gas to a sample gas and efficient     amount fraction over a similar N2 O amount fraction range
use of the reference material. Achieved precisions for N2 O       for the same model analyser (2015 model) but stated that the
amount fraction and isotope ratios are in agreement with the      change in delta value with amount fraction might vary be-
typical precisions reported by Picarro in the instrument spec-    tween different analysers of the same model.
ification of < 0.05 nmol mol−1 N2 O and < 0.7 ‰ for δ 15 N,          The agreement in δ 15 N and δ 18 O between static and dy-
δ 15 Nα , δ 15 Nβ and δ 18 O for a 10 min averaging period (Pi-   namic reference materials (shown in Fig. 2) indicates mini-
carro, 2017).                                                     mal fractionation of isotopocules on dilution through a crit-
                                                                  ical flow orifice-based dynamic system or on production of
3.2    Characterisation of the CRDS for reported delta            the reference materials by filling though an intermediate ves-
       values with N2 O amount fraction                           sel and dilution. No variation in reported delta values beyond
                                                                  the measurement uncertainty for N2 O amount fractions over
The characterisation of the CRDS for reported delta values        the range of 300–1500 nmol mol−1 was observed between
with N2 O amount fraction was assessed with both statically       the analyser response of the static and dynamic reference ma-
and dynamically generated reference materials. Dynamic ref-       terials (Fig. 2). However, the large uncertainty makes com-
erence materials were produced in the amount fraction range       parisons of the delta value between similar amount fractions

Atmos. Meas. Tech., 14, 5447–5458, 2021                                              https://doi.org/10.5194/amt-14-5447-2021
R. E. Hill-Pearce et al.: Stable isotopes of nitrous oxide gas reference materials                                                  5451

                                                                           The combined contribution to the uncertainty due to
                                                                        gravimetry and purity of the components for the ambient
                                                                        amount fraction N2 O in synthetic air reference materials pro-
                                                                        duced, as detailed above, is 0.08 % (k = 2) 0.28 nmol mol−1 .
                                                                        This uncertainty is within the WMO-GAW extended compat-
                                                                        ibility goals of ±0.3 nmol mol−1 .
                                                                           The sources of uncertainty and their contribution to the
                                                                        combined gravimetric uncertainty (k = 2) are detailed in Ta-
                                                                        ble 1. The uncertainty is dominated by the 0.3 mg uncertainty
                                                                        on the mass of N2 O added in the indirect transfer vessel ad-
                                                                        ditions to prepare the 500 µmol mol−1 N2 O intermediate and
                                                                        325 nmol mol−1 reference material.

                                                                        4.1.2   Uncertainty in the amount fraction of reference
                                                                                materials for validation measurements

                                                                        The amount fraction of N2 O in a prepared mixture was val-
Figure 2. CRDS analyser response for δ 15 N (circles), δ 15 Nα (dia-    idated through comparison to National Physical Laboratory
monds), δ 15 Nβ (squares) and δ 18 O (triangles) with the reciprocal
                                                                        (NPL) in-house PRMs. The PRMs used for validation were
of N2 O amount fraction for static (open data labels) and dynamic
(filled data labels) reference materials in the amount fraction range
                                                                        derived from different parent mixtures which are, where pos-
of 300–1500 nmol mol−1 . Error bars represent the repeatability in      sible, produced by different operators in order to provide a
per mille between the four repetitions of a 5 min average. The dot-     greater degree of independence from errors in amount frac-
ted and dashed lines represent the linear regression of dynamic ref-    tion of a parent mixture. In-house PRMs and unknown mix-
erence materials for each isotopocule.                                  tures were measured alternately for 10 min periods. To deter-
                                                                        mine the certified amount fraction of the unknown mixture
                                                                        (Y ), the gravimetric amount fraction of the in-house PRM
challenging. The uncertainty would be reduced by increasing             (X1 ) is multiplied by the mean ratio in analyser response
the averaging time.                                                     (X2 ), as shown in Eq. 3. Four repetitions provide four dis-
                                                                        tinct measurements of this ratio.
4     Results and discussion                                            Y = f (X1 X2 )                                                (3)
4.1     Uncertainty in N2 O amount fraction
                                                                        Input quantities (X1 , X2 ) have associated uncertainties that
Uncertainty in the amount fraction of N2 O in a reference ma-           are combined to give a combined standard uncertainty for the
terial has several sources including uncertainty due to gravi-          measurement of N2 O amount fraction derived from each val-
metric preparation (weighing uncertainties), uncertainty in             idation. The standard uncertainty associated with the gravi-
the purity of the gases used (e.g. amount fraction of N2 O              metric amount fraction u(x1 ) is provided by the software
in the matrix), cylinder effects such as adsorption of the gas          Gravcalc2 (Brown, 2009). The standard uncertainty in the ra-
molecules onto the walls of the cylinder and valve, uncer-              tio measurement u(x2 ) is the standard deviation of the mean
tainties in amount fraction due to the stability of the gas ref-        of the four ratios. Both input quantities were modelled with
erence material, and analytical precision of the measurement            normal distributions, and sensitivity coefficients (c1 , c2 ) were
technique. Each uncertainty contribution is discussed below.            taken as the partial derivatives with respect to each input
                                                                        quantity.
4.1.1    Uncertainty and reproducibility in the amount
         fraction of reference materials due to gravimetric                  ∂f
                                                                        c1 =     = x2                                                 (4)
         production                                                          ∂x1
                                                                             ∂f
                                                                        c2 =     = x1                                                 (5)
To assess the uncertainty in the amount fraction from pro-                   ∂x2
duction of N2 O reference materials, eight reference materials
were produced by two separate operators from two separate               Standard uncertainties were multiplied by respective sensi-
500 µmol mol−1 N2 O-in-nitrogen reference materials but the             tivity coefficients and combined in quadrature to provide a
same matrix gases and pure N2 O source. Four of the refer-              combined standard uncertainty for each validation. To com-
ence materials were produced at 337 nmol mol−1 and four                 bine the standard
                                                                                         uncertainty
                                                                                                     from each validation, a sensitiv-
were produced at 326 nmol mol−1 .                                                             1
                                                                        ity coefficient c = 3 was applied to each, providing equal
                                                                        weighting to the final analytical uncertainty.

https://doi.org/10.5194/amt-14-5447-2021                                                  Atmos. Meas. Tech., 14, 5447–5458, 2021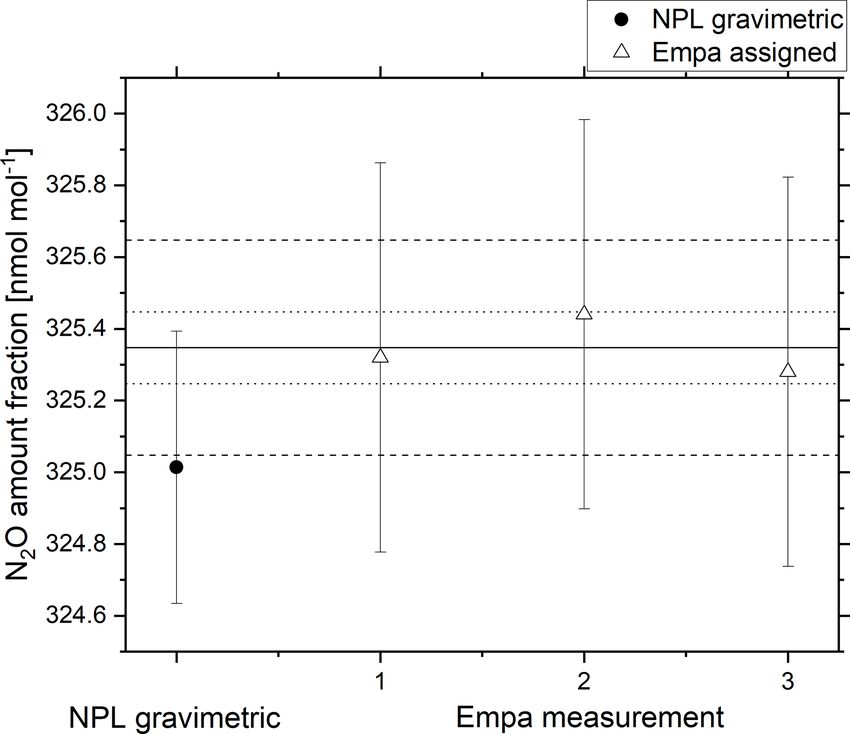
5452                                         R. E. Hill-Pearce et al.: Stable isotopes of nitrous oxide gas reference materials

Table 1. Sources of uncertainty and their relative contribution to the combined expanded uncertainty (k = 2) for the preparation of a
325 nmol mol−1 N2 O-in-synthetic-air reference material.

                             Source of uncertainty                                   Contribution to the
                                                                                     gravimetric expanded
                                                                                     uncertainty (%)
                             Mass of N2 O: indirect transfer vessel additions        72
                             Mass of matrix gas (Ar, O2 and N2 ): direct additions   1
                             Relative molar masses                                   2
                             N2 O impurity in pure Ar                                Negligible
                             N2 O impurity in pure O2                                5
                             N2 O impurity in pure N2                                17
                             Matrix gas impurity                                     2

   Expanded analytical uncertainties of 0.07 % (k = 2) were
demonstrated using this approach. The final combined ex-
panded uncertainty contains the contributions from gravimet-
ric and analytical uncertainty. The combined expanded un-
certainty of ambient amount fraction N2 O reference materi-
als is calculated to be 0.11 % (k = 2) or 0.36 nmol mol−1 .

4.1.3    Reproducibility of reference gas production

The WMO-GAW has published an amount fraction range of
325–335 nmol mol−1 representative of the unpolluted tropo-
sphere, while the range of N2 O amount fractions covered by
the WMO scale is somewhat broader (260–370 nmol mol−1 ).
The linearity of the CRDS analyser response to changes in
amount fraction and the influence of amount fraction on ap-
parent isotope delta values were investigated in the amount           Figure 3. Residuals of the linear regression of the certified
fraction range 320 to 360 nmol mol−1 using a set of gravi-            amount fraction as a function of the gravimetric amount frac-
metric prepared reference materials. The lower boundary for           tion for N2 O reference materials in the amount fraction range
amount fraction was defined by the CRDS analyser (Picarro             320–360 nmol mol−1 certified against a 325 nmol mol−1 refer-
G5131-i) N2 O amount fraction range for measurement of                ence material. The WMO-GAW Data Quality Objective (DQO)
                                                                      (±0.1 nmol mol−1 ) is indicated within the dark grey shading, and
delta values.
                                                                      the extended DQO (±0.3 nmol mol−1 ) is indicated within the
   The gravimetrically prepared reference materials
                                                                      lighter grey shading. Error bars represent the combined (k = 2) an-
were validated against a reference material prepared at               alytical (y axis) and gravimetric (x axis, not visible) uncertainty.
325 nmol mol−1 . Figure 3 shows the residual of the linear
regression of the certified amount fraction as a function of
the gravimetric amount fraction for each reference material.          surements as a result of changes in the reference material.
The deviation from the linear regression does not show any            The effect of storage of reference materials of N2 O in syn-
obvious trend with gravimetric amount fraction and falls              thetic air, with and without other greenhouse gas components
within the extended WMO-GAW compatibility goal for all                in cylinders with different surface treatments, was investi-
reference materials of ±0.3 nmol mol−1 , demonstrating the            gated.
suitability and linearity of the CRDS analytical technique
for certifying N2 O reference materials in this range and the         4.2.1    Stability of reference materials for extended
reproducibility of the reference materials produced.                           storage times

4.2     Stability of N2 O reference materials for amount              The stability of a 325 nmol mol−1 N2 O-in-synthetic-air refer-
        fraction and isotopic composition                             ence material was assessed over a 3-year period by compar-
                                                                      ison with freshly prepared binary reference materials com-
The demonstration of stability is important to achieve mea-           prising N2 O in synthetic air prepared in the amount frac-
surements of amount fraction and isotope ratio in the field           tion range 300–360 nmol mol−1 and reference materials con-
with low uncertainty and also safeguards against drift in mea-        taining N2 O in synthetic air and trace gases CO2 (290–

Atmos. Meas. Tech., 14, 5447–5458, 2021                                                 https://doi.org/10.5194/amt-14-5447-2021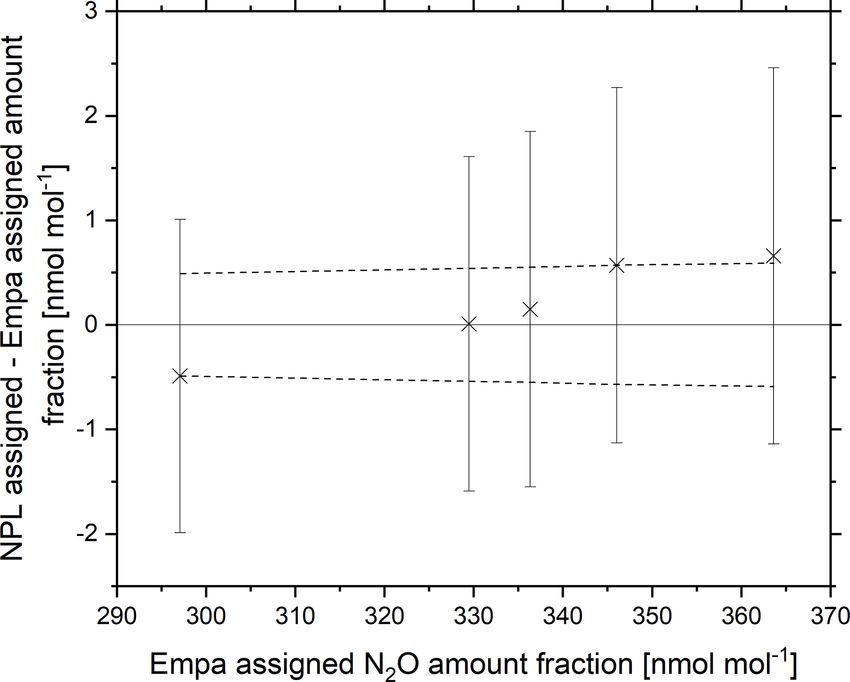
R. E. Hill-Pearce et al.: Stable isotopes of nitrous oxide gas reference materials 5453
through the analyser, a small excess flow rate of between
0.3 and 0.5 L min−1 was maintained to optimise the pressure
through the analyser, reduce back diffusion into the analyser
and ensure thermodynamic effects do not occur. A drift cor-
rection was conducted on the N2 O amount fraction and iso-
tope delta values through subtraction of analyser response
against a linear regression of the N2 O parent cylinder anal-
ysed immediately before and after each of the 0.85 L cylin-
ders. There is good agreement within the standard deviation
of the 5 min responses between the amount fraction and delta
values of the four cylinders and the parent cylinder. The data
indicate that adsorption onto cylinder walls causes negligible
changes in amount fraction and delta value with pressure.
The findings show agreement with Lushozi et al. (2019) and
Brewer et al. (2019b) where no adsorption losses were identi-
Figure 4. Percentage difference between gravimetric and certified fied in cylinder-to-cylinder transfer of a 330 nmol mol−1 ref-
N2 O amount fraction of a 325 nmol mol−1 reference material as erence material.
a function of storage time. The reference material was certified
against freshly prepared N2 O reference materials in the amount 4.2.3 Cylinder treatments for enhanced stability with
fraction range 320–360 nmol mol−1 . The freshly prepared reference
pressure
materials were either diluted in synthetic air (open triangle) or con-
tained other greenhouse gases (filled circle). The WMO-GAW com-
patibility goal is indicated on the plot in dark grey shading, and the Greenhouse gas reference materials are prepared at NPL in
extended compatibility goal is indicated by lighter grey shading. passivated cylinders to inhibit the adsorption of target com-
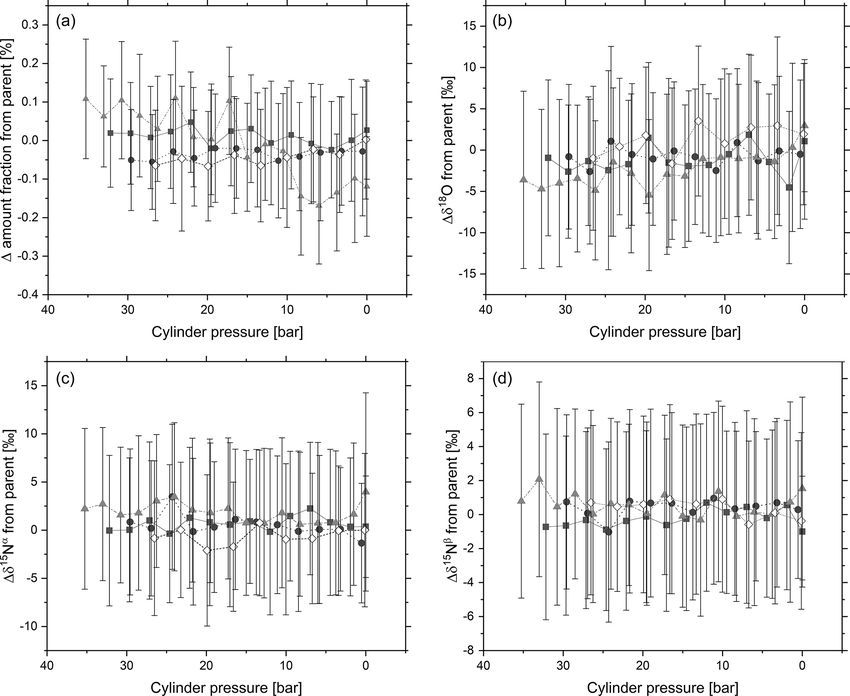
ponents. While adsorption of N2 O is not expected to be as
large as adsorption of CO2 (Brewer et al., 2019a), it is never-
800 µmol mol−1 ), CH4 (1.8–3.0 µmol mol−1 ) and CO (0.07– theless of interest to investigate the effects of cylinder passi-
1.00 µmol mol−1 ) (Fig. 4). All validations within this period vation.
demonstrated agreement of amount fraction within the ex- Figure 6 shows the 5 min average of the response of N2 O
tended WMO compatibility goal of ±0.3 nmol mol−1 and amount fraction with pressure relative to initial amount frac-
thus demonstrate the stability of the 325 nmol mol−1 N2 O tion for the three cylinders with different passivation pro-
reference material. The linearity of response of the CRDS cesses. There is no difference in the reported N2 O amount
in this amount fraction range is detailed above. No clear dis- fraction between the three passivation processes, with all sta-
tinction between agreement of validation of N2 O in synthetic ble to within 0.05 nmol mol−1 . The data demonstrate that
air and N2 O within multi-component gas mixtures was ob- the internal passivation process causes negligible changes to
served, suggesting minimal interference of these gases on the the N2 O analyser response for amount fraction with changes
CRDS analyser response to the total reported amount fraction in cylinder pressure. The water vapour content of simi-
of N2 O. The findings show agreement with those of Erler et lar mixtures in synthetic air was measured to be around
al. (2015) and Harris et al. (2020) where no significant ef- 0.5 µmol mol−1 (Hill-Pearce et al., 2018).
fect of CH4 , CO or CO2 at atmospheric amount fraction was
found on the reported N2 O amount fraction. In contrast, the 4.3 Absence of fractionation effects for static mixture
authors reported a strong effect of O2 amount fractions on ap- production
parent N2 O amount fraction, which they attribute to changes
in the pressure broadening. Similar effects on the CO2 and The effects of the production and storage of ambient amount
CH4 reported amount fractions with changing matrix com- fraction N2 O in synthetic air reference materials in cylinders
position when using CRDS have been observed earlier by on the reported amount fraction and delta value were com-
Nara et al. (2012). pared to reported values for dynamic reference materials pro-
duced from the same pure N2 O source diluted with synthetic
4.2.2 Stability of reference materials with reducing air (Fig. 7). Dynamic reference materials demonstrate re-
cylinder pressure duced adsorption effects compared to static standards, partic-
ularly for low-amount-fraction reference materials (Platonov
Figure 5 shows 5 min averages for amount fraction, δ 15 Nα , et al., 2018). Differences in reported delta value for static and
δ 15 Nβ and δ 18 O with reducing pressure. No statistically rel- dynamic standards of the same amount fraction would indi-
evant trend for N2 O amount fraction or delta value was ob- cate fractionation events in either production method.
served as the cylinder pressure decreases. The experiment The generated dynamic reference materials were validated
was conducted over 1.5 h. During venting of the cylinder against static reference materials of a similar amount frac-
https://doi.org/10.5194/amt-14-5447-2021 Atmos. Meas. Tech., 14, 5447–5458, 2021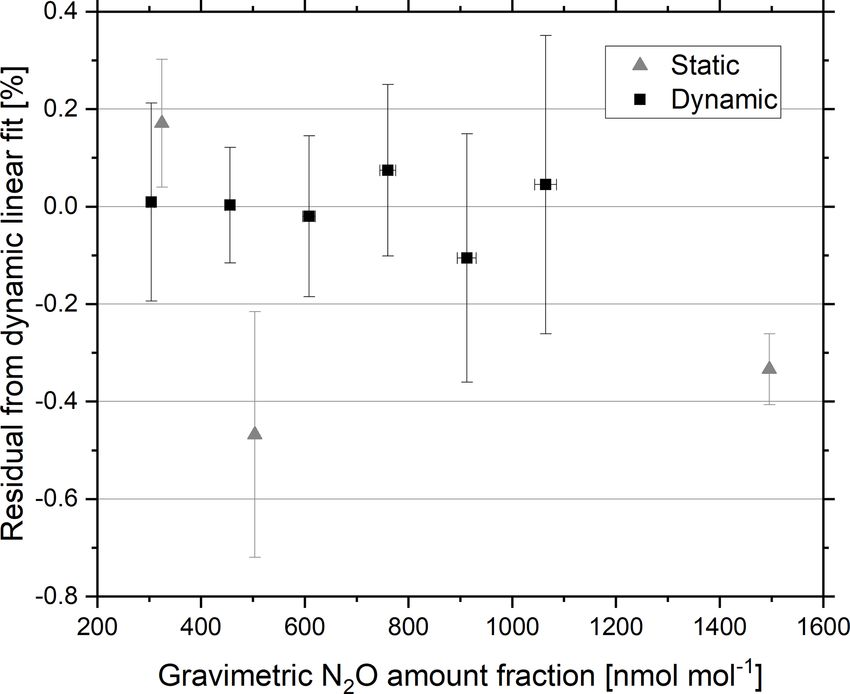
5454                                            R. E. Hill-Pearce et al.: Stable isotopes of nitrous oxide gas reference materials

Figure 5. Temporal change in (a) N2 O amount fraction and delta values: (b) δ 18 O, (c) δ 15 Nα and (d) δ 15 Nβ in response to changes
in cylinder pressure of four 0.85 L aluminium cylinders. Each data point represents a 5 min average of analyser response, and error bars
represent 1 standard deviation across the 5 min average.

                                                                        tion. The residuals of the static and dynamic linear regression
                                                                        of analyser response as a function of increasing gravimetric
                                                                        amount fraction of dynamic reference materials are shown
                                                                        in Fig. 7. Agreement within 0.05 % (0.16 nmol mol−1 ) was
                                                                        achieved between the static and dynamic reference materials
                                                                        at 325 nmol mol−1 .

                                                                        4.4   Comparison with existing scales

                                                                        Two comparisons of amount fraction were carried out be-
                                                                        tween NPL and the WMO-GAW World Calibration Centre
                                                                        (WCC-Empa) on reference materials prepared at Empa and
                                                                        NPL.
                                                                           In a first approach, five reference materials were pre-
                                                                        pared by Empa containing N2 O in the amount fraction range
                                                                        290–370 nmol mol−1 and certified against reference mate-
Figure 6. Difference from initial N2 O amount fraction with reduc-
ing cylinder pressure for three 325 nmol mol−1 N2 O-in-synthetic-       rials on the WMO-X2006A calibration scale (Hall et al.,
air reference materials produced in 10 L cylinders with three differ-   2007; NOAA/ESRL, 2011) via quantum cascade laser ab-
ent commercially available cylinder passivation processes.              sorption spectroscopy (QCLAS, model: QC-TILDAS-CS,
                                                                        2200 cm−1 , Aerodyne Inc., USA). The Empa reference mate-

Atmos. Meas. Tech., 14, 5447–5458, 2021                                                  https://doi.org/10.5194/amt-14-5447-2021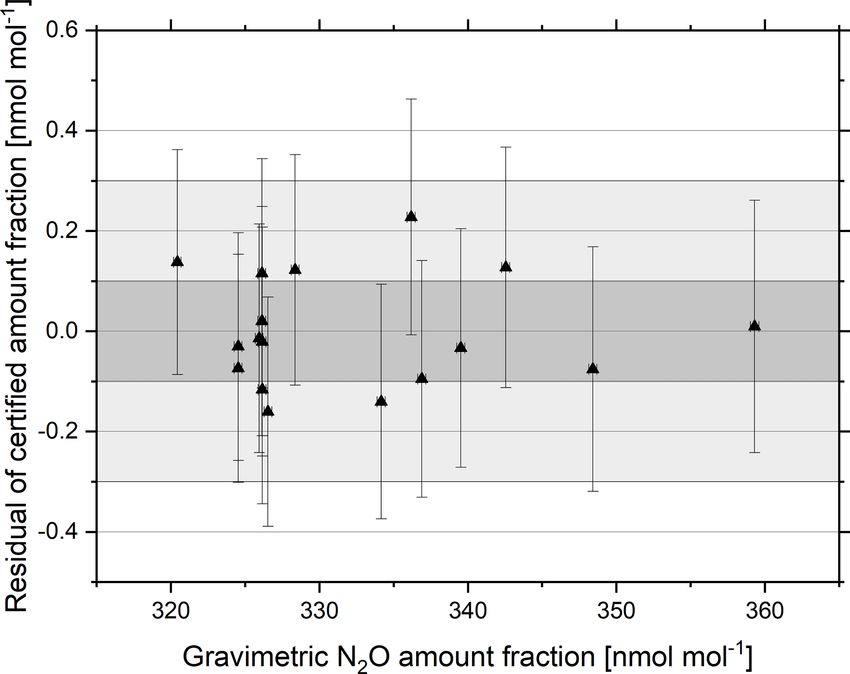
R. E. Hill-Pearce et al.: Stable isotopes of nitrous oxide gas reference materials                                                        5455

Figure 7. Residuals from the linear regression of analyser response   Figure 8. Certified NPL amount fraction minus the certified Empa
with increasing gravimetric amount fraction of the dynamic refer-     amount fraction of five N2 O reference materials in the range 290–
ence materials. Static (triangles) and dynamic (squares) reference    370 nmol mol−1 (crosses). Error bars represent the extended com-
materials in the amount fraction range 300–1500 nmol mol−1 N2 O       bined standard uncertainty (k = 2) for NPL certified amount frac-
in synthetic air. Error bars represent the gravimetric uncertainty    tion. The Empa certified amount fraction is marked by a solid line
(k = 2) (x axis) and the percent reproducibility between the four     at y = 0, and dashed lines represent the Empa measurement uncer-
repetitions of a 5 min average (y axis).                              tainty.

rials contained greenhouse and reactive gas components CO2            traceability to the NOAA scale, scale propagation and re-
(360–800 µmol mol−1 ), CH4 (1.7–3.2 µmol mol−1 ) and CO               peatability of the analytical system from analyser drift and
(120–560 nmol mol−1 ). The reference materials were vali-             pressure changes. For the Aerodyne analyser used in the
dated over a period of 6 months prior to analysis at NPL and          comparison to validate the 325 nmol mol−1 N2 O reference
were re-validated afterwards at Empa with a linear interpola-         material, the sources of uncertainty were combined to the
tion applied to account for any drift in amount fraction.             combined standard uncertainty (uN2 O ) as shown in Eq. (6).
   The reference materials were certified at NPL via                                                 2                    2 1/2
CRDS against NPL in-house PRMs static reference mate-                 uN2 O =        0.06 nmol mol−1        + 8.13 × 10⁻⁴ × c         ,    (6)
rials in the amount fraction range of 325–360 nmol mol−1 .
Each sample was averaged across four 10 min repetitions.
                                                                      where c refers to the amount fraction of N2 O in the refer-
Agreement within the WMO-GAW compatibility goal was
                                                                      ence material in nmol mol−1 . The term 8.13×10⁻⁴ combines
achieved for amount fractions at 330 nmol mol−1 (Fig. 8)
                                                                      the uncertainty contributions from uncertainty in NOAA
and within the extended WMO-GAW compatibility goal at
                                                                      scale propagation and uncertainty due to pressure changes.
337 nmol mol−1 . Reference materials with amount fractions
                                                                      The term 0.06 nmol mol−1 combines the concentration-
within the range 295–345 nmol mol−1 were verified within
                                                                      independent uncertainty contributions from scale propaga-
the experimental extended combined standard uncertainty
                                                                      tion and analyser drift.
(k = 2) for NPL certified amount fraction. A trend was ob-
                                                                         The expanded uncertainty (UN2 O ) (k = 2) was determined
served with lower NPL amount fractions certifying lower and
                                                                      from the standard uncertainty as shown in Eq. (7).
higher NPL amount fractions certifying higher.
   In a second approach, a 325 nmol mol−1 N2 O-in-                    UN2 O = 2 × uN2 O                                                    (7)
synthetic-air reference material containing 526 nmol mol−1
CO was prepared at NPL using the method described above
and analysed at the World Calibration Centre (WCC-Empa)               5   Summary
against NOAA/GMD reference materials on the WMO-
X2006A calibration scale. Validations were performed via              N2 O reference materials with low uncertainty in amount
quantum cascade laser absorption spectroscopy (QCLAS,                 fraction and isotope ratio are required for atmospheric mon-
model: QC-TILDAS-CS, 2200 cm−1 , Aerodyne Inc., USA).                 itoring. The stability of these reference materials is cru-
   Agreement within the combined gravimetric uncertainty              cial to achieve these low uncertainties. We have demon-
(k = 2) was achieved for the 325 nmol mol−1 reference mate-           strated the production of atmospheric amount fraction N2 O
rial (Fig. 9). The uncertainty in the analytical amount fraction      reference materials with a gravimetric uncertainty within
certified by Empa combines uncertainty contributions from             the WMO DQO for compatibility. Repeatability of the

https://doi.org/10.5194/amt-14-5447-2021                                                   Atmos. Meas. Tech., 14, 5447–5458, 2021
5456 R. E. Hill-Pearce et al.: Stable isotopes of nitrous oxide gas reference materials
terials with dynamic dilutions within the analytical uncer-
tainty. The next steps towards producing reference materials
for source apportionment will be to produce reference mate-
rials with a range of isotopic values and to verify the assign-
ment of their delta values.
Data availability. The data underlying the figures in this paper are
available upon request to the corresponding author.
Author contributions. The standard preparation and analysis work
was undertaken by REHP, AH, EMW and KC, with JM and
CZ comparing reference materials to existing scales. All authors
(REHP, AH, EMW, KC, SO’D, JM, CZ, DRW, PJB) contributed to
discussions and writing of the paper.
Figure 9. Gravimetric amount fraction (filled circle) and amount
fraction certified by Empa (open triangle) against the NOAA/GMD Competing interests. The authors declare that they have no conflict
reference scale for a 325 nmol mol−1 reference material. The solid of interest.
black line represents the average value certified by Empa, the dotted
lines represent the WMO-GAW DQO and the dashed lines represent
the extended WMO-GAW DQO. Error bars represent the combined Disclaimer. Publisher’s note: Copernicus Publications remains
expanded uncertainty (k = 2). neutral with regard to jurisdictional claims in published maps and
institutional affiliations.
amount fraction of these reference materials was also within
±0.3 nmol mol−1 . Gravimetry is the largest source of uncer- Financial support. This research has been supported by the Euro-
tainty for these reference materials; reducing the uncertainty pean Metrology Programme for Innovation and Research (EMPIR)
further would require the use of lower uncertainty balances programme co-financed by the participating states and the European
for the indirect transfer of N2 O. The effect of including other Union’s Horizon 2020 research and innovation programme.
greenhouse gases at atmospheric amount fractions in the ref-
erence materials did not significantly affect the amount frac-
Review statement. This paper was edited by Frank Keppler and re-
tion recorded by CRDS. Agreement between static and dy-
viewed by Stefan Persijn and one anonymous referee.
namic reference materials of 0.05 % was achieved between
reference materials at 325 nmol mol−1 .
The amount fraction of a prepared N2 O reference mate-
rial in synthetic air with atmospheric amount fraction of CO References
was compared to internationally recognised scales (WMO-
BIPM, IEC, IFCC, ILAC, ISO, IUPAC, IUPAP, and OIML:
X2006A) and found to be in agreement within the gravi-
Evaluation of measurement data – guide to the expres-
metric uncertainty. The amount fraction of reference materi- sion of uncertainty in measurement, International Bureau of
als produced at Empa was measured at NPL through com- Weights and Measures/Bureau International des Poids et Mea-
parison with NPL in-house PRMs. For a 330 nmol mol−1 , sures, Working group 1 of the Joint Committee for Guides
the NPL- and Empa-assigned amount fraction values were in Metrology (JCGM 100: 2008, GUM 1995 with minor
in agreement within the WMO DQO for compatibility corrections), available at: http://www.bipm.org/utils/common/
of ±0.1 nmol mol−1 , and the full range of PRMs (290– documents/jcgm/JCGM1002008E.pdf (last access: 20 January
370 nmol mol−1 ) were in agreement within the measurement 2021), 2008.
uncertainty of ±0.5 nmol mol−1 . Brewer, P. J., Brown, R. J., Mussell Webber, E. B., van
The change in amount fraction of the mixtures with de- Aswegen, S., Ward, M. K., Hill-Pearce, R. E., and Worton,
D. R.: Breakthrough in Negating the Impact of Adsorption
creasing cylinder pressure was shown to be smaller than
in Gas Reference Materials, Anal. Chem., 91, 5310–5315,
measurement uncertainty regardless of cylinder passivation
https://doi.org/10.1021/acs.analchem.9b00175, 2019a.
chemistry, and the stability of the mixtures over 3 years was Brewer, P. J., Kim, J. S., Lee, S., Tarasova, O. A., Viallon, J., Flo-
within the expanded WMO-GAW DQO for compatibility. res, E., Wielgosz, R. I., Shimosaka, T., Assonov, S., and Allison,
The isotopic composition of the reference mixtures was also C. E.: Advances in reference materials and measurement tech-
demonstrated to be stable with reducing pressure, and agree- niques for greenhouse gas atmospheric observations, Metrologia,
ment of delta values was achieved for static reference ma- 56, 034006, https://doi.org/10.1088/1681-7575/ab1506, 2019b.
Atmos. Meas. Tech., 14, 5447–5458, 2021 https://doi.org/10.5194/amt-14-5447-2021R. E. Hill-Pearce et al.: Stable isotopes of nitrous oxide gas reference materials 5457 Brown, A.: GravCalc2 (version 2.3.0) User Guide, National Physi- toring of atmospheric SF6 , Anal. Chem., 89, 12068–12075, cal Laboratory (NPL), Teddington, UK, 2009. https://doi.org/10.1021/acs.analchem.7b02545, 2017. Denk, T. R., Mohn, J., Decock, C., Lewicka-Szczebak, D., Lopez, M., Schmidt, M., Ramonet, M., Bonne, J.-L., Colomb, A., Harris, E., Butterbach-Bahl, K., Kiese, R., and Wolf, B.: Kazan, V., Laj, P., and Pichon, J.-M.: Three years of semi- The nitrogen cycle: A review of isotope effects and iso- continuous greenhouse gas measurements at the Puy de Dôme tope modeling approaches, Soil Biol. Biochem., 105, 121–137, station (central France), Atmos. Meas. Tech., 8, 3941–3958, https://doi.org/10.1016/j.soilbio.2016.11.015, 2017. https://doi.org/10.5194/amt-8-3941-2015, 2015. Erler, D. V., Duncan, T., Murray, R., Maher, D. T., Santos, Lushozi, S., Tshilongo, J., and Chimuka, L.: Verification of ni- I. R., Gatland, J., Mangion, P., and Eyre, B. D.: Applying trous oxide primary standard gas mixtures by gas chromatog- cavity ring-down spectroscopy for the measurement of dis- raphy and cavity ring-down spectroscopy for ambient measure- solved nitrous oxide concentrations and bulk nitrogen isotopic ments in South Africa, Accredit. Qual. Assur., 24, 203–214, composition in aquatic systems: Correcting for interferences https://doi.org/10.1007/s00769-019-01375-x, 2019. and field application, Limnol. Oceanogr.-Meth., 13, 391–401, Mohn, J., Wolf, B., Toyoda, S., Lin, C. T., Liang, M. C., Brügge- https://doi.org/10.1002/lom3.10032, 2015. mann, N., Wissel, H., Steiker, A. E., Dyckmans, J., and Szwec, Flores, E., Viallon, J., Moussay, P., Griffith, D. W., and Wiel- L.: Interlaboratory assessment of nitrous oxide isotopomer anal- gosz, R. I.: Calibration strategies for FT-IR and other isotope ysis by isotope ratio mass spectrometry and laser spectroscopy: ratio infrared spectrometer instruments for accurate δ 13 C and current status and perspectives, Rapid Commun. Mass Sp., 28, δ 18 O measurements of CO2 in air, Anal. Chem., 89, 3648–3655, 1995–2007, https://doi.org/10.1002/rcm.6982, 2014. https://doi.org/10.1021/acs.analchem.6b05063, 2017. Myhre, G., Shindell, D., Bréon, F., Collins, W., Fuglestvedt, J., Ganesan, A. L., Chatterjee, A., Prinn, R. G., Harth, C. M., Huang, J., Koch, D., Lamarque, J., Lee, D., and Mendoza, B.: Salameh, P. K., Manning, A. J., Hall, B. D., Mühle, J., Mered- Anthropogenic and Natural Radiative Forcing, Climate Change ith, L. K., Weiss, R. F., O’Doherty, S., and Young, D.: The 2013: The Physical Science Basis. Contribution of Working variability of methane, nitrous oxide and sulfur hexafluoride Group I to the Fifth Assessment Report of the Intergovernmen- in Northeast India, Atmos. Chem. Phys., 13, 10633–10644, tal Panel on Climate Change, edited by: Stocker, T. F., Qin, D., https://doi.org/10.5194/acp-13-10633-2013, 2013. Plattner, G.-K., Tignor, M., Allen, S. K., Boschung, J., Nauels, Griffith, D. W. T., Deutscher, N. M., Caldow, C., Kettlewell, G., A., Xia, Y., Bex, V., and Midgley, P. M., Cambridge Univer- Riggenbach, M., and Hammer, S.: A Fourier transform infrared sity Press, Cambridge, UK and New York, NY, USA, 659–740, trace gas and isotope analyser for atmospheric applications, At- https://doi.org/10.1017/CBO9781107415324.018, 2013. mos. Meas. Tech., 5, 2481–2498, https://doi.org/10.5194/amt-5- Nara, H., Tanimoto, H., Tohjima, Y., Mukai, H., Nojiri, Y., 2481-2012, 2012. Katsumata, K., and Rella, C. W.: Effect of air composition Hall, B., Dutton, G., and Elkins, J.: The NOAA nitrous oxide (N2 , O2 , Ar, and H2 O) on CO2 and CH4 measurement by standard scale for atmospheric observations, J. Geophys. Res.- wavelength-scanned cavity ring-down spectroscopy: calibration Atmos., 112, D09305, https://doi.org/10.1029/2006JD007954, and measurement strategy, Atmos. Meas. Tech., 5, 2689–2701, 2007. https://doi.org/10.5194/amt-5-2689-2012, 2012. Harris, S. J., Liisberg, J., Xia, L., Wei, J., Zeyer, K., Yu, L., Barthel, NOAA/ESRL: Nitrous oxide (N2 O) WMO scale: https://www. M., Wolf, B., Kelly, B. F. J., Cendón, D. I., Blunier, T., Six, esrl.noaa.gov/gmd/ccl/n2o_scale.html (last access: 21 December J., and Mohn, J.: N2 O isotopocule measurements using laser 2020), 2011. spectroscopy: analyzer characterization and intercomparison, At- Ostrom, N. E. and Ostrom, P. H.: Mining the isotopic complex- mos. Meas. Tech., 13, 2797–2831, https://doi.org/10.5194/amt- ity of nitrous oxide: a review of challenges and opportunities, 13-2797-2020, 2020. Biogeochemistry, 132, 359–372, https://doi.org/10.1007/s10533- Hill-Pearce, R. E., Resner, K. V., Worton, D. R., and Brewer, P. 017-0301-5, 2017. J.: Synthetic Zero Air Reference Material for High Accuracy Ostrom, N. E., Gandhi, H., Coplen, T. B., Toyoda, S., Böhlke, Greenhouse Gas Measurements, Anal. Chem., 91, 1974–1979, J. K., Brand, W. A., Casciotti, K. L., Dyckmans, J., Giese- https://doi.org/10.1021/acs.analchem.8b04297, 2018. mann, A., and Mohn, J.: Preliminary assessment of stable ISO: 6142-1: Gas analysis-Preparation of calibration gas mixtures nitrogen and oxygen isotopic composition of USGS51 and – Part 1: Gravimetric method for Class I mixtures, Geneva, USGS52 nitrous oxide reference gases and perspectives on Switzerland, 2015. calibration needs, Rapid Commun. Mass Sp., 32, 1207–1214, Kantnerová, K., Tuzson, B., Emmenegger, L., Bernasconi, S. M., https://doi.org/10.1002/rcm.8157, 2018. and Mohn, J.: Quantifying isotopic signatures of N2 O using Picarro: δ 15 N and δ 18 O Isotopic and Nitrous Oxide Gas Con- quantum cascade laser absorption spectroscopy, CHIMIA, 73, centration Analyzer, available at: https://www.picarro.com/ 232–238, https://doi.org/10.2533/chimia.2019.232, 2019. support/library/documents/g5131i_analyzer_datasheet (last ac- Lewicka-Szczebak, D., Well, R., Köster, J. R., Fuß, R., cess: 20 January 2021), 2017. Senbayram, M., Dittert, K., and Flessa, H.: Experimen- Platonov, I., Rodinkov, O., Gorbacheva, A., Moskvin, L., and tal determinations of isotopic fractionation factors associ- Kolesnichenko, I.: Methods and devices for the preparation ated with N2 O production and reduction during denitri- of standard gas mixtures, J. Anal. Chem., 73, 109–127, fication in soils, Geochim. Cosmochim. Ac., 134, 55–73, https://doi.org/10.1134/S1061934818020090, 2018. https://doi.org/10.1016/j.gca.2014.03.010, 2014. Snider, D. M., Venkiteswaran, J. J., Schiff, S. L., and Spoel- Lim, J. S., Lee, J., Moon, D., Kim, J. S., Lee, J., and Hall, stra, J.: From the ground up: Global nitrous oxide sources are B. D.: Gravimetric standard gas mixtures for global moni- https://doi.org/10.5194/amt-14-5447-2021 Atmos. Meas. Tech., 14, 5447–5458, 2021
5458                                           R. E. Hill-Pearce et al.: Stable isotopes of nitrous oxide gas reference materials

  constrained by stable isotope values, PloS one, 10, e0118954,       Winther, M., Balslev-Harder, D., Christensen, S., Priemé, A., El-
  https://doi.org/10.1371/journal.pone.0118954, 2015.                   berling, B., Crosson, E., and Blunier, T.: Continuous measure-
Tohjima, Y., Katsumata, K., Morino, I., Mukai, H., Machida, T.,         ments of nitrous oxide isotopomers during incubation experi-
  Akama, I., Amari, T., and Tsunogai, U.: Theoretical and exper-        ments, Biogeosciences, 15, 767–780, https://doi.org/10.5194/bg-
  imental evaluation of the isotope effect of NDIR analyzer on          15-767-2018, 2018.
  atmospheric CO2 measurement, J. Geophys. Res.-Atmos., 114,          WMO: 20th WMO/IAEA Meeting on Carbon Dioxide, Other
  D13302, https://doi.org/10.1029/2009JD011734, 2009.                   Greenhouse Gases and Related Tracers Measurement Techniques
Toyoda, S. and Yoshida, N.: Determination of nitrogen iso-              (GGMT-2019), World Meteorological Organization, Geneva,
  topomers of nitrous oxide on a modified isotope ra-                   Switzerland, 2019a.
  tio mass spectrometer, Anal. Chem., 71, 4711–4718,                  WMO: Greenhouse Gas Bulletin (GHG Bulletin) – No. 15: The
  https://doi.org/10.1021/ac9904563, 1999.                              State of Greenhouse Gases in the Atmosphere Based on Global
Toyoda, S., Yoshida, N., and Koba, K.: Isotopocule anal-                Observations through 2018, World Meteorological Organization,
  ysis of biologically produced nitrous oxide in vari-                  Geneva, Switzerland, available at: https://public.wmo.int/en/
  ous environments, Mass Spectrom. Rev., 36, 135–160,                   resources/library/wmo-greenhouse-gas-bulletin-no-15 (last ac-
  https://doi.org/10.1002/mas.21459, 2017.                              cess: 13 January 2021), 2019b.
van der Schoot, M., Langenfelds, R., Fraser, P., Krummel, P., Ward,   WMO: Carbon dioxide levels continue at record lev-
  J., and Somerville, N.: The WMO/GAW Cape Grim Baseline Air            els,     despite   COVID-19       lockdown,      available   at:
  Pollution Station Air Archive, Asia-Pacific GAW on Greenhouse         https://public.wmo.int/en/media/press-release/carbon-dioxide-
  Gases, Korea Metrological Administration (KMA), vol. 6. 13–           levels-continue-record-levels-despite-covid-19-lockdown (last
  20, 2015.                                                             access: 13 January 2021), 2020.

Atmos. Meas. Tech., 14, 5447–5458, 2021                                                 https://doi.org/10.5194/amt-14-5447-2021
You can also read