Circulatory and Nervous Diseases Mortality Patterns-Comparison of Geomagnetic Storms and Quiet Periods - MDPI
←
→
Page content transcription
If your browser does not render page correctly, please read the page content below
atmosphere

Article
Circulatory and Nervous Diseases Mortality
Patterns—Comparison of Geomagnetic Storms and
Quiet Periods
Kateřina Podolská
                                          Department of Ionosphere and Aeronomy, Institute of Atmospheric Physics of the Czech Academy of Sciences,
                                          Boční II/1401, 14130 Prague, Czech Republic; kapo@ufa.cas.cz

                                          Abstract: The aim of this paper is to statistically examine whether there are different patterns in
                                          daily numbers of deaths during the quiet periods of solar activity, in contrast to the periods of the
                                          strong solar storms. We considered three periods of solar storms (storm of 14 July 2000 Bastille Day
                                          Event, storm of 28 October 2003 Halloween Solar Storms, and storm of 17 March 2015 St. Patrick’s
                                          Day event) and three periods of continuous very low solar activity (13 September–24 October 1996,
                                          21 July–20 August 2008, and 31 July–31 August 2009) during the Solar Cycles No. 23 and No. 24. In
                                          particular, we focus on diseases of the nervous system (group VI from ICD-10) and diseases of the
                                          circulatory system (group IX from ICD-10) separately for both sexes and two age groups (under 39
                                          and 40+). We demonstrate that in the resulting graphical models there was a connection between
                                          the daily number of deaths and all indices of solar and geomagnetic activity in periods of low solar
                                          activity in contrast to periods of strong solar storms in some monitored groups according to age, sex,
                                          and group of diagnosis.

                                   Keywords: geomagnetic storms; exceptional solar events; quiet periods of solar activity; diseases of
Citation: Podolská, K. Circulatory        the circulatory system; diseases of the nervous system
and Nervous Diseases Mortality
Patterns—Comparison of
Geomagnetic Storms and Quiet
Periods. Atmosphere 2022, 13, 13.         1. Introduction
https://doi.org/10.3390/
                                                Changes in the Earth’s magnetic field, which permeates the entire biosphere, induce an
atmos13010013
                                          electric field in the conductors that every living tissue is. The direct effects of high-energy
Academic Editors: Panagiota               solar radiation, especially during solar storms, have a measurable impact on living organ-
Preka-Papadema and                        isms, including human organisms [1]. Biomedical experiments confirmed changes in the
Chris G. Tzanis                           cardiograms of higher animals under the influence of fluctuations in the electromagnetic
Received: 16 November 2021
                                          field to which they were exposed [2]. Naturally, it can be expected that even changes in the
Accepted: 19 December 2021
                                          Earth’s magnetic and electric field will affect human heart and nerve activities. Electromag-
Published: 22 December 2021
                                          netic field mainly affects the condition of the patients with brain, nerve, or heart diseases,
                                          non-specifically also the nervous system and hormonal activity. On days of magnetic
Publisher’s Note: MDPI stays neutral
                                          storms, changes in blood clotting, sedimentation rates, and pulse are detected [2–6].
with regard to jurisdictional claims in
                                                The geosphere is exposed to severe episodic changes associated with heliospheric
published maps and institutional affil-
                                          disturbances. Environmental changes are monitored in both quiescent and disturbed
iations.
                                          states, magnetohydrodynamic models are built, which describe physical processes taking
                                          place under disturbed conditions (e.g., acceleration of electrons in radiation belts during
                                          magnetic storms, which often occur spontaneously and without precursors) and on this
Copyright:     © 2021 by the author.
                                          basis predict the extent of these changes. The magnetosphere is a large three-dimensional
Licensee MDPI, Basel, Switzerland.        structure, the spatially distant parts of which can be quickly and directly connected by
This article is an open access article    plasma phenomena. As in the ionosphere–thermosphere system, there are a number of very
distributed under the terms and           complex bonds in the magnetosphere–ionosphere system, on which heliosphere disorders
conditions of the Creative Commons        have a major impact. The high-energy solar radiation, especially during solar flares, has an
Attribution (CC BY) license (https://     underlying impact on all living (including human) organisms [1]. The paper [7] assumes
creativecommons.org/licenses/by/          that neuropsychological diseases and psychiatric disorders exhibit during the periods of
4.0/).                                    increase and decrease solar activity.

Atmosphere 2022, 13, 13. https://doi.org/10.3390/atmos13010013                                         https://www.mdpi.com/journal/atmosphere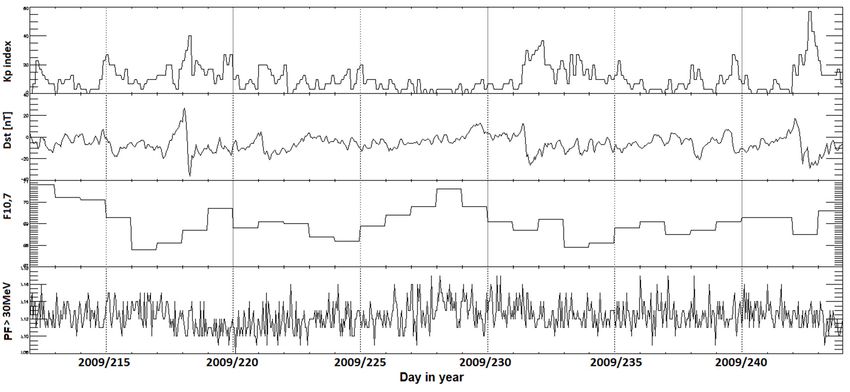
Atmosphere 2022, 13, 13                                                                                           2 of 14

                                The delay of the geomagnetic storm after the solar flare is 25–60 h. Geomagnetic storms
                          usually have four phases in medium latitudes (including the Czech Republic). Typical is
                          the rapid onset of a storm with a sharply increasing intensity of the horizontal component
                          of the geomagnetic field lasting 2.5–5 min. This occurs by the densification of the magnetic
                          field lines of the Earth’s magnetic field due to their compression by the interplanetary
                          shock wave of the solar wind. During the next initial phase (Initial phase), which lasts a
                          maximum of several hours, the intensity of the horizontal component of the magnetic field
                          further increases due to the passed interplanetary shock wave. During the main phase, the
                          geomagnetic lines are connected to the lines of the magnetic field carried by the plasmoid
                          from the Sun, which accelerates the equatorial annular current and weakens the intensity
                          of the horizontal component of the magnetic field. This decline can take several hours to
                          a day. In the final phase (Recovery phase), the equatorial annular current decays due to
                          plasma instability and diffusion. The intensity of the horizontal component of the Earth’s
                          magnetic field returns to its original values within a few hours to days [8,9].
                                Changes in the Earth’s magnetic field caused by solar storms are also reflected in the
                          change in the electric field between the ionosphere and the Earth’s surface. This field is
                          also affected by induced currents from the Earth’s liquid core in the Earth’s mantle. Its
                          intensity at the Earth’s surface is approximately 60,000 nT at the pole and 30,000 nT at the
                          equator [10] (pp. 4–7). It is possible to quantify the impact of magnetic field changes at
                          a specific location on Earth by measuring ground magnetometers. These measurements
                          are performed using the worldwide SuperMAG network using 3D vector measurements.
                          In the Czech Republic, these measurements are performed by the geomagnetic station of
                          the Geophysical Institute of the ASCR Budkov in South Bohemia (BDV, 49.08◦ N, 14.02◦ E)
                          days [8,9].
                                Correlations of changes in state of human health with solar activity were identified
                          in papers [11–15]. These effects were also noted [16–18] as the onset of nervous diseases
                          and genetic disorders. A similar study was conducted [19] and reached similar results.
                          According to these studies, geomagnetic activity plays only a minor role in the cardiovas-
                          cular mortality, a finding that has been confirmed in a study [20]. Strong solar storms affect
                          the human circulatory system indirectly through the concentration of electric charges and
                          also changes in the magnetic field in the terrestrial environment in which the monitored
                          population lives [21]. Moreover, the impact of geomagnetic disturbances may depend
                          on solar magnetic field polarity [22], the course and phase of the solar cycle, and on the
                          strength of the exceptional solar events during the given period of observation [23–28]. The
                          recent studies investigate also the simultaneous effects of space weather and meteorological
                          situations on cardiovascular diseases [29–32], which can be important in the context of
                          climate change.
                                To compare the characteristic patterns in daily numbers of death, a period with lower
                          solar activity was chosen in our analysis. These periods were then confronted with periods
                          of strong solar storms and their temporal impact.
                                The mortality level in the Czech Republic (population of about 10 million) during the
                          investigated period from years 1994 to 2015 has evenly decreased. Registration of deaths
                          by cause of death and coding praxis is longitudinally very well established and organized
                          in the Czech Republic. The data series were provided by Czech Statistical Office [33].
                          The whole observed period belongs to term of validity of ICD-10 (International Statistical
                          Classification of Diseases and Related Health Problems 10th Revision), and the unified
                          version of the electronic coding system IRIS (Language independent coding system) was
                          operated throughout this period in the Czech Republic [34].
                                The time series of daily aggregated numbers of deaths by cause, men and women
                          separately at the age groups under 39 and 40+ were used for this analysis. For detailed
                          analysis, causes of death classified in chapter VI, diseases of the nervous system, and
                          classified in chapter IX of ICD-10, diseases of the circulatory system, were chosen. Time
                          series of daily numbers of deaths per group of diagnoses of ICD-10 VI, diseases of the
                          nervous system (codes G00–G99), and IX, circulatory system diseases (codes I00–I99), per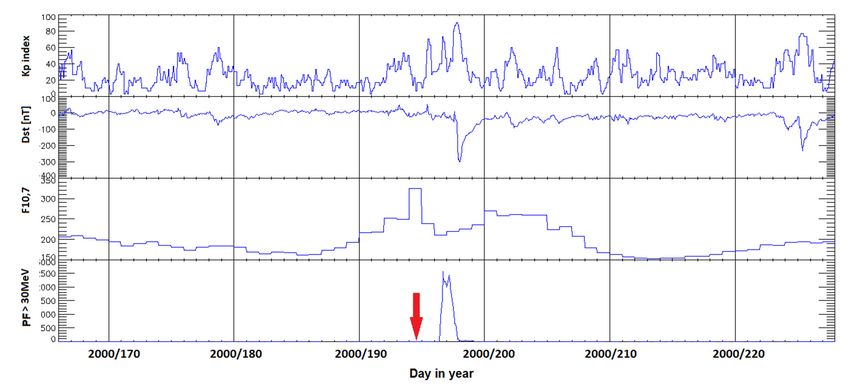
Atmosphere 2022, 13, 13                                                                                            3 of 14

                          group of diagnoses together were used for the analysis, due to the length of the observed
                          period. We chose the analysis of daily numbers of deaths for the whole group of diagnoses
                          due to low daily numbers of deaths for detailed diagnoses [35,36].
                               According to the description of detailed diagnoses and already performed
                          studies [1,11,14], there is no presumption that an acute severe reaction of the human organ-
                          ism to changes in geophysical parameters could have a delay longer than 30 days [35–38],
                          the same long period after the solar storm was analyzed. The period of 30 days was chosen
                          to monitor specific changes in the number of deaths after a solar storm because there is
                          no assumption that the acute deterioration after the solar/geomagnetic storm could be
                          causally reflected in mortality over a longer period than 30 days in the conditions of medical
                          care in the Czech Republic. We focused to the situations when solar-flare or shock waves
                          associated with coronal mass ejections produce strong solar energetic particles (SEP) events
                          with geomagnetic impact.
                               The investigated period (1994–2015) was chosen for the analysis also because the
                          mortality level in the Czech Republic did not fluctuate sharply. For example, it would not
                          be possible to perform the analysis in the current situation where the mortality level is
                          affected by COVID-19 disease and can be problematic in the future as well [39,40].
                               As a result, we focused on three exceptionally strong solar events in this period:
                          -    class X5 storm on 14 July 2000 Bastille Day Event;
                          -    class X17 storm on 28 October 2003 Halloween Solar Storms;
                          -    class G4 storm on 17 March 2015 St. Patrick’s Day Event.
                               Daily numbers of deaths in the studied groups of diagnoses were also observed in
                          approximately 30 day long quiet periods. To compare the mortality patterns, a period
                          with lower solar activity was chosen, namely just 30 days of quiet period of very low solar
                          activity during Solar Cycles No. 23 and No. 24 when the relative number of sunspots R
                          was completely zero (R = 0):
                          -    13 September–24 October 1996;
                          -    21 July–20 August 2008;
                          -    31 July–31 August 2009.
                               These storms and continuous quiet periods were selected according to the NWRA/
                          CoRA catalog, NorthWest Research Associates in Boulder, CA, USA, and the Deutsches
                          GeoForschungsZentrum so that they occurred evenly throughout the study period. The
                          radiation solar activity indices F10.7 (Intensity of the Solar Radio Flux) [36], the geomagnetic
                          solar activity indices Kp planetary index [41,42], and Dst (Disturbance Storm Time), and
                          Proton density and Proton Flux > 30 MeV (FP30) represent the solar activity in our study.

                          2. Data and Methods
                          2.1. Data Sets
                               For detailed analysis, causes of death of the chapters VI. diseases of the nervous system
                          and IX. diseases of the circulatory system of ICD-10 were chosen. Time series of daily
                          numbers of deaths per group of diagnoses of ICD-10 VI. diseases of the nervous system
                          (codes G00–G99) and IX. circulatory system diseases (codes I00–I99) per group of diagnoses
                          together were used for the analysis, due to the length of the observed period. The time
                          series of daily aggregated numbers of deaths by cause, men and women separately at the
                          age groups under 39 and 40+ were used in this study. The data were provided by Czech
                          Statistical Office (http://www.czso.cz, accessed on 2 November 2019). The time series of
                          daily numbers of deaths from studied causes of death, which met the criteria of observation
                          frequency for time series analysis using graphical models of conditional independence, and
                          the series of geophysical and solar parameters expressing the level of solar activity were
                          included in the complete graphical model of conditional independences CIG (solar radio
                          flux F10.7, geomagnetic index Kp, and solar proton flux > 30MeV PF30) which we will
                          describe in the method section. As already mentioned, Dst index was used to determine
                          the onset time of a geomagnetic storm. Moreover, the Dst time series did not pass the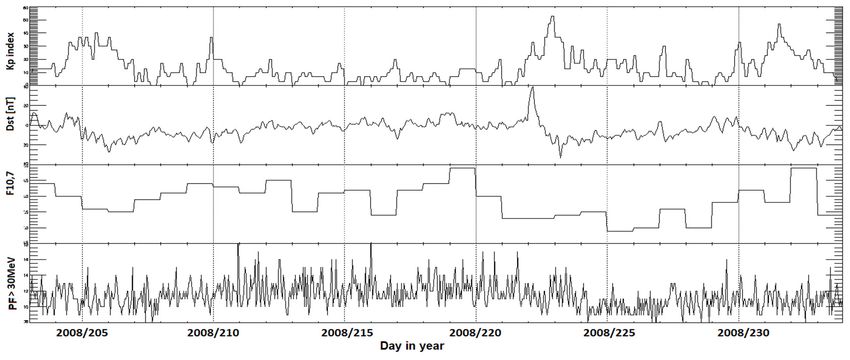
ence, and the series of geophysical and solar parameters expressing the level of solar ac-
tivity were included in the complete graphical model of conditional independences CIG
Atmosphere 2022, 13, 13 (solar radio flux F10.7, geomagnetic index Kp, and solar proton flux > 30MeV PF30) which 4 of 14
we will describe in the method section. As already mentioned, Dst index was used to de-
termine the onset time of a geomagnetic storm. Moreover, the Dst time series did not pass
the
testtest
for for normality
normality andand independence
independence of logarithmic
of logarithmic datadata (at significance
(at significance level level of 0.05)
of 0.05) and
and therefore it was not possible to compute the minimalized
therefore it was not possible to compute the minimalized graphical model of conditionalgraphical model of condi-
tional independence
independence for it. for it.
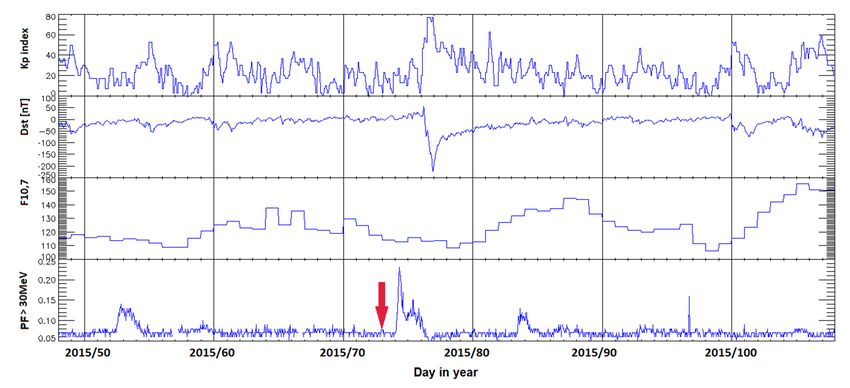
Figure
Figure 1 showsthe
1 shows thechanges
changes(from(fromtoptopto tobottom)
bottom)of ofthe
thevalues
valuesof ofthe
thethree-hour
three-hourKp Kp
index,
index, the the hourly values of
hourly values of the
theDst
Dstindex,
index,the thedaily
daily values
values of of
thethe solar
solar radio
radio fluxflux F10.7,
F10.7, and
and
the the hourly
hourly PF30 PF30 values
values of the
of the solarsolar proton
proton fluxflux
withwith energy
energy greater
greater thanthan 30 MeV
30 MeV in
in the
the observed period. The analyzed solar storms are marked by
observed period. The analyzed solar storms are marked by red arrow in the graphs of thered arrow in the graphs of
the course
course of solar
of solar andand geophysical
geophysical parameters
parameters in Figure
in Figure 1a–c.1a–c.
The KpTheindex
Kp index was chosen
was chosen in the
in the model
model to represent
to represent the geomagnetic
the geomagnetic activityactivity in geographical
in geographical latitudeslatitudes
where the where the
territory
territory
of the Czech of the Czech Republic
Republic lieswas
lies [43]. Dst [43].used
Dst to was used to the
determine determine
onset timetheofonset time of a
a geomagnetic
geomagnetic
storm. In Figure storm. In Figure
2 same time 2series
sameoftimesolarseries
and of solar and geomagnetic
geomagnetic indices during indices during
investigated
investigated
quiet periodsquiet periods
of solar of solar
activity activityFor
are shown. arethe shown. For the
terrestrial terrestrial
impact impact
scenario, scenario,
it is important
itifisthe
important
observedifgeographic
the observed geographic
location, location,
territory of the territory of the Czech
Czech Republic in thisRepublic in this
case, is affected
case,
on day is affected
or nighton day
side of orthenight side of the Earth.
Earth.
(a)
(b)
Figure 1. Cont.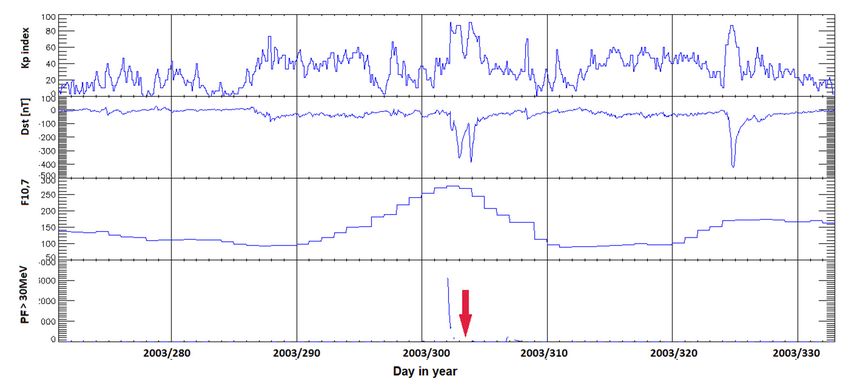
Atmosphere
Atmosphere 2021,
2022, 12,
13, x13FOR PEER REVIEW 55of
of14
14
Atmosphere 2021, 12, x FOR PEER REVIEW 5 of 14
(c)
Figure (c)
Figure 1.
1. Solar
Solaractivity
activityvariability
variabilityduring
duringthe theinvestigated
investigatedsolarsolarand
andgeomagnetic
geomagnetic storms
storms belonging
belonging
to the Solar CyclesFigure
No. 23 1. and
SolarNo. 24. Class
activity X5 storm
variability on the
during 14 July 2000 Bastille
investigated solar Day
and Event in panel
geomagnetic (a), belonging
storms
to the Solar Cycles No. 23 and No. 24. Class X5 storm on 14 July 2000 Bastille Day Event in panel (a),
class X17 storm onto28 theOctober 2003 No.
Solar Cycles Halloween
23 and No.Solar
24. Storms
Class X5instorm
panelon(b),
14 class G4 storm
July 2000 Bastilleon 17 March
Day Event in panel (a)
class X17 storm on 28 October 2003 Halloween Solar Storms in panel (b), class G4 storm on 17 March
2015 St. Patrick’s Day
classEvent in panel
X17 storm on 28(c). Time 2003
October of solar storms Solar
Halloween are marked
Stormsby red arrow
in panel in the
(b), class G4graphs.
storm on 17 March
2015 St.
Note thatPatrick’s Day St.
2015
y−axis scales Event in equal
panel
Patrick’s
are not Dayon(c).
EventTime
all of solar
in panel
events. (c). storms
Time ofare marked
solar storms by arered arrow
marked byin the
red graphs.
arrow in the graphs
Note that y−axisNote scales arey−axis
that not equal
scaleson
areall events.
not equal on all events.
(a)
(a)
(b)
Figure 2. Cont. (b)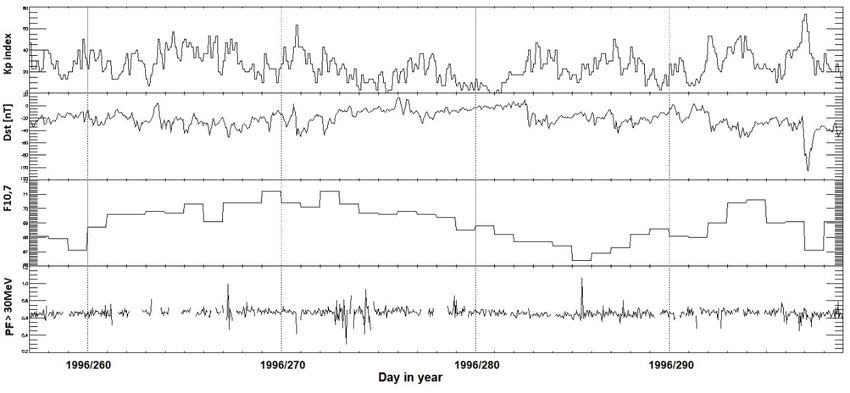
Atmosphere 2022, 13, 13Atmosphere 2021, 12, x FOR PEER REVIEW 6 of 14 6 of 1
(c)
Figure variability
Figure 2. Solar activity 2. Solar activity variability
during during thequiet
the investigated investigated
periodsquiet
fromperiods from to
years 1994 years
20151994 to 201
belonging to the Solar Cycles No. 23 and No. 24. Period 13 September 1996–24 October 1996 in pan
belonging to the Solar Cycles No. 23 and No. 24. Period 13 September 1996–24 October 1996 in
(a), 21 July 2008–20 August 2008 in panel (b), and 31 July 2009–31 August 2009 in panel (c). Not
panel (a), 21 July that
2008–20
y-axisAugust 2008
scales are notin panel
equal on(b), and 31 July 2009–31 August 2009 in panel (c).
all events.
Note that y-axis scales are not equal on all events.
2.2. Method
2.2. Method
The graphical models are important modern instruments of multivariate statistic
The graphical
Theymodels
are used areforimportant
descriptionmodern instruments
and transparent of multivariate
representation statistics.
of structure of the depend
They are used forence
description and transparent
relationships in a given setrepresentation of structure of the dependence
of random vectors.
relationships in a given set of
Today, random vectors.
probabilistic graphical models for climate data analysis have been developed
Today, probabilistic graphical
to determine which variablesmodels for climate
interact, data
and howanalysis
strongly,have
andbeen developed,
to decide if the data can b
to determine whichcondensed without loss of information [44–46]. The theoretical basis tocan
variables interact, and how strongly, and to decide if the data thisbetechnique i
condensed without loss of information [44–46]. The theoretical basis to this
the concept of conditional independence, and the prime theoretical and practical technique is tool i
the concept of conditional independence, and
the conditional independence graph [47,48].the prime theoretical and practical tool is the
conditional independenceWe used graph [47,48]. models method of conditional dependencies (CIG) [47], a sto
the graphical
chastic approach
We used the graphical models to find out dependencies
method of conditionalbetween solar, geomagnetic,
dependencies (CIG) [47], andaother tim
series. Due to the character of the solved problem, this
stochastic approach to find out dependencies between solar, geomagnetic, and other time method appears useful for studyin
series. Due to the character of the solved problem, this method appears useful for studying and dail
the conditional dependence between physical parameters in evolving solar cycle
numbers of deaths.
the conditional dependence between physical parameters in evolving solar cycle and daily
numbers of deaths. The computational procedure by this method is described in detail in [49], as a mean
to investigate
The computational the relationship
procedure by this methodbetween the Earth’sinionosphere
is described andas
detail in [49], magnetosphere.
a means Thi
method has been implemented in the field of the impact
to investigate the relationship between the Earth’s ionosphere and magnetosphere. This of space on human health, in [50
which also describes in detail the calculation procedures.
method has been implemented in the field of the impact of space on human health, in [50]
In this work, we consider a structure dependence relationship of the random vecto
which also describes in detail the calculation procedures.
component part. We take all full graphs of conditional independence relationships for se
In this work, we consider a structure dependence relationship of the random vector
lecting tests of fit graphs. In this method, the best likelihood estimation of variance matri
component part. We take all full graphs of conditional independence relationships for
in conditions given by graphical model is found [51–53].
selecting tests of fit graphs. In this method,
Model solutions the best likelihood
were performed estimation of variance
for the above-mentioned matrix
solar storms and quiet pe
in conditions given by graphical model is found [51–53].
riods. We used the procedure Backward2 [47] (pp.182–185) realized in Mathematica 8.
Model solutions
software.wereOnperformed for the above-mentioned
account of computational complexity, thesolar storms and
geomagnetic quiet
index Dst was no
periods. We used the procedure
finally used in theBackward2 [47] (pp.models
resulting graphical 182–185) realized in Mathematica
of conditional independence.8.0 The random
software. On account of computational
vector employed complexity,
in our models is marked:the geomagnetic index Dst was not
finally used in the resulting graphical models of conditional independence. The random
vector employed in our models is marked: X = (I; Kp; F10.7; PF30), (1
where I is the daily number of deaths in the group of diagnoses by age and sex, Kp i
geomagnetic index, XF10.7
= (I; Kp;
solarF10.7;
radio PF30), (1) The num
flux, and PF30 is solar radio flux > 30 MeV.
ber of realizations of this random vector is 31 (lengths of observed periods after sola
where I is the daily number of deaths in the group of diagnoses by age and sex, Kp is
geomagnetic index, F10.7 solar radio flux, and PF30 is solar radio flux > 30 MeV. The
number of realizations of this random vector is 31 (lengths of observed periods after solar
storm or during continuous quiet period in days). All graphs in the calculations haveAtmosphere 2022, 13, 13 7 of 14
4 vertices, so the maximum number of possible graphs is 63 in each calculation. These time
series were tested for independence and normality of logarithmic data series. The test of
the normality of logarithmical series (and not of the series themselves) is the mathematical
assumption for computing the maximum likelihood estimator of the constrained covariance
matrix [50]. The data are transformed by differences of logarithms to fulfill the assumption
of normality and independence of observed realizations within this step. In the absence of
the assumption of local normality, calculation is stopped and the model cannot be created.
The likelihood function requirements follow from the graphical model selection, using the
goodness of Ht test to select the graphical model with data [54]. The test statistics have the
deviance with χ2 asymptotic probability distribution. In our selection of minimized model,
all edges with computed deviance less than 3.84 (the critical value 3.84 is the standard 5%
point of χ2 (1) distribution with 1 degree of freedom), were excluded from the entire graph.
The stopping threshold for this calculation, thus, was the value 0.05 [55].
3. Results
In the results of the analyses described in this section, it can be observed for all
monitored solar storms that the daily numbers of deaths in groups of diagnoses VI. diseases
of the nervous system (codes G00-G99) and IX. circulatory system diseases (codes I00-I99)
by age and sex have different statistical characteristics in the period of 30 days after the
solar storms compared to the three periods of low solar activity. For age groups in which
the daily death rates are low due to the nature of the disease, the results of the model
calculation are not statistically significant. There are usually age groups 0–39 years for men
and women with diseases of the circulatory system and nervous system with very low
daily numbers of deaths.
The results of the calculation of graphical models of conditional independence for both
groups of diagnoses at the time of the analyzed solar storms are presented in Tables 1 and 2.
For each investigated solar storm, the table contains the parameters of the minimized graph-
ical models after the solar storm, for the analyzed groups by sex and age. In Tables 3 and 4
results of the calculation of graphical models of conditional independence during spotless
day periods are presented. For each model, the table also shows the total deviance of the
minimized model.
The time series of number of deaths of men and women in the age group over
40 completed years inclusive, for all the mentioned solar storms and quiet periods, passed
the tests for independence and normality of logarithmic data series. For the residual compo-
nents of the random vector in the model, it is indicated whether the given edge remained in
the resulting minimized model by X mark (the edge is in the model) or by a dash (the edge
was excluded from the model). Furthermore, in the tables, we present the number of edges
in the final model, the total sum of the degrees of freedom f in the model calculation, and
p-value of the test model is shown. The stopping threshold for calculation was 0.05 in all
calculation cases. Thus, if the p-value of the test of the minimized model is greater than 0.05,
the model is statistically significant. If the time series did not pass the test for independence
and normality of logarithmic data series (due to the uncertainty of the variance matrix it
was not possible to calculate the model), this information is given in the relevant row in
the tables.
The results for groups of women up to and including 39 completed years are indicated
by the title of the Females 0–39 panel, and the results for women aged 40 and over completed
years inclusive are indicated by the title of the Females 40+ panel. The results for men up
to and including 39 completed years are indicated by the title of the panel Males 0–39, and
the results for men aged 40 and more completed years inclusive are indicated by the title of
the panel Males 40+.Atmosphere 2022, 13, 13 8 of 14
Table 1. Summary of conditional independence graphs (CIG) model computation. Diseases of the
nervous system (codes G00-G99).
Solar storm X5 14 July 2000 Bastille Day Event
Model Deviance of minimized F10.7 Kp PF30 Edge number of minimized f p-value
graphical model graphical model
Males 0–39 does not pass the test for normality and independence of logarithmic data
Males 40+ 1.12680 - X - 1 46 0.26918
Females 0–39 0.37453 - X - 1 6 0.43892
Females 40+ 1.23286 - - - 0 55 0.01914
Solar storm X17 28 October 2003 Halloween Solar Storms
Model Deviance of minimized F10.7 Kp PF30 Edge number of minimized f p-value
graphical model graphical model
Males 0–39 0.71428 X - X 2 12 0.37100
Males 40+ 1.10720 X - X 2 65 0.21850
Females 0–39 does not pass the test for normality and independence of logarithmic data
Females 40+ 2.12049 X - X 2 77 0.21858
Solar storm G4 17 March 2015 St. Patrick’s Day Event
Model Deviance of minimized F10.7 Kp PF30 Edge number of minimized f p-value
graphical model graphical model
Males 0–39 does not pass the test for normality and independence of logarithmic data
Males 40+ 1.55689 X - X 2 110 0.11307
Females 0–39 does not pass the test for normality and independence of logarithmic data
Females 40+ 1.99264 X - - 1 138 0.14996
Table 2. Summary of conditional independence graphs (CIG) model computation, diseases of the
circulatory system (codes I00-I99).
Solar storm X5 14 July 2000 Bastille Day Event
Deviance of minimized Edge number of minimized
Model F10.7 Kp PF30 f p-value
graphical model graphical model
Males 0–39 does not pass the test for normality and independence of logarithmic data
Males 40+ 6.29273 X X X 3 2060 0.17833
Females 0–39 0.32790 - X - 1 5 0.73121
Females 40+ 9.00699 X - - 1 2506 0.06246
Solar storm X17 28 October 2003 Halloween Solar Storms
Deviance of minimized Edge number of minimized
Model F10.7 Kp PF30 f p-value
graphical model graphical model
Males 0–39 0.46596 X - X 2 18 0.28350
Males 40+ 8.08860 - - X 1 2022 0.06981
Females 0–39 0.10372 X - X 2 5 0.96414
Females 40+ 8.71907 X X X 3 2486 0.09763
Solar storm G4 17 March 2015 St. Patrick’s Day Event
Deviance of minimized Edge number of minimized
Model F10.7 Kp PF30 f p-value
graphical model graphical model
Males 0–39 0.81789 - - - 0 13 0.06826
Males 40+ 8.40326 X - X 2 2105 0.03101
Females 0–39 does not pass the test for normality and independence of logarithmic data
Females 40+ 10.39334 X - - 1 2626 0.09645Atmosphere 2022, 13, 13 9 of 14
In the group of nervous system diseases in the period 30 days after the Halloween
Solar Storms, an increase in the conditional dependence was found for the daily number of
deaths in men and women over 40 years for the solar radio flux F10.7 and solar proton flux
FP30. The same applies to men in this age group after the St. Patrick’s Day Event.
The results of our analysis, performed by the method of graphical models of condi-
tional independence for the group of nervous system diseases, showed the conditional
dependence of the daily number of deaths during the solar storm on 28 October 2003
(Halloween Solar Storms), for all monitored age groups on solar radio flux F10.7 and solar
proton flux PF30, with the exception of the group of women 0–39. At the time of the solar
storm on 14 July 2000 (Bastille Day Event), no connection between the daily number of
deaths and all indices of solar and geomagnetic activity was found in the group of diseases
of the nervous system, during any period of the observed solar storms.
The connection of the daily number of deaths with all indices of the solar and geo-
magnetic activity was found in the group of diseases of the circulatory system during the
solar storm on 28 October 2003 (Halloween Solar Storms) for women over the age of 40,
and during the solar storm on 14 July 2000 (Bastille Day Event), in men over the age of 40.
In contrast, in a severe solar storm on 17 March 2015 (St. Patrick’s Day Event), which
hit the Earth in the early morning hours of local time, the conditional dependence of the
number of deaths on the solar proton flux PF30 manifested itself in men over the age of 40
for both monitored diagnoses groups cardiovascular and nervous diseases, but conditional
dependence on solar radio flux F10.7 manifested itself for both sexes over the age of 40.
Table 3. Summary of conditional independence graphs (CIG) model computation, diseases of the
circulatory system (codes I00-I99) during spotless day periods.
13 September 1996–24 October 1996
Deviance of minimized Edge number of minimized
Model F10.7 Kp PF30 f p-value
graphical model graphical model
Males 0–39 does not pass the test for normality and independence of logarithmic data
Males 40+ 0.34000 X - - 1 27 0.73121
Females 0–39 does not pass the test for normality and independence of logarithmic data
Females 40+ 0.40022 X - - 1 78 0.24884
21 July 2008–20 August 2008
Deviance of minimized Edge number of minimized
Model F10.7 Kp PF30 f p-value
graphical model graphical model
Males 0–39 does not pass the test for normality and independence of logarithmic data
Males 40+ 0.33080 X - - 1 43 0.35009
Females 0–39 does not pass the test for normality and independence of logarithmic data
Females 40+ 11.03420 - - - 0 47 0.034611
31 July 2009–31 August 2009
Deviance of minimized Edge number of minimized
Model F10.7 Kp PF30 f p-value
graphical model graphical model
Males 0–39 does not pass the test for normality and independence of logarithmic data
Males 40+ 8.19562 - - - 0 11 0.19784
Females 0–39 does not pass the test for normality and independence of logarithmic data
Females 40+ 11.09207 - - - 0 32 0.24884Atmosphere 2022, 13, 13 10 of 14
Table 4. Summary of conditional independence graphs (CIG) model computation. Diseases of the
nervous system (codes G00-G99) during spotless day periods.
13 September 1996–24 October 1996
Deviance of minimized Edge number of minimized
Model F10.7 Kp PF30 f p-value
graphical model graphical model
Males 0–39 does not pass the test for normality and independence of logarithmic data
Males 40+ 8.47768 X X - 2 18 0.19869
Females 0–39 does not pass the test for normality and independence of logarithmic data
Females 40+ 0.91364 - - - 0 29 0.75376
21 July 2008–20 August 2008
Deviance of minimized Edge number of minimized
Model F10.7 Kp PF30 f p-value
graphical model graphical model
Males 0–39 does not pass the test for normality and independence of logarithmic data
Males 40+ 0.29791 - X X 2 76 0.37100
Females 0–39 does not pass the test for normality and independence of logarithmic data
Females 40+ 1.03767 - - - 0 34 0.02735
31 July 2009–31 August 2009
Deviance of minimized Edge number of minimized
Model F10.7 Kp PF30 f p-value
graphical model graphical model
Males 0–39 does not pass the test for normality and independence of logarithmic data
Males 40+ 0.90116 - - - 0 15 0.22743
Females 0–39 does not pass the test for normality and independence of logarithmic data
Females 40+ 0.91364 - - - 0 62 0.16517
In the observed spotless periods of low solar activity, there are no model connections
with geomagnetic indices in diseases of the circulatory system compared to the period
after the solar storm in women in the age group over 40 years of completed age. During
these periods of low solar activity, in the minimized graphical models, no connection of
the daily number of deaths was found in parallel with all indices of solar and geomagnetic
activity (F10.7, Kp, FP30) in any of the monitored groups according to age, sex, and group
of diagnoses.
From the minimized graphs of conditional independence, the conditional dependence
in pairs of random vectors representing time series of the circulatory system diseases and
F10.7 is evident for both sexes in the age group over 40 years, and only for men over
40 years in the quiet period in the year 1996.
The time series of daily numbers of men over the age of 40 who have died of nervous
system diseases (codes G00-G99) are conditionally dependent in this period only in men
over the age of 40, in the quiet period 13 September–24 October 1996 on solar radio flux
(F10.7) and Kp index, and in the quiet period July 21–August 20 2008 on Kp index and
solar proton flux PF30. In the quiet period of 31 July–31 August 2009, no conditional
dependences with the number of deaths for both monitored groups of diagnoses were
found in any of the time series.
In these periods, in contrast to the periods of the analyzed solar storms, in the mini-
mized graphical models in none of the monitored groups according to age, sex and group
of diagnoses was a connection found between the daily number of deaths and all indices of
solar and geomagnetic activity.Atmosphere 2022, 13, 13 11 of 14
4. Discussion
The results of our analysis are influenced by the geoefficiency of the individual ana-
lyzed solar storm and the time course of the monitored indices of solar and geophysical
activity. The results of minimization of graphical model for the periods of three major solar
storms (storm of 14 July 2000 Bastille Day Event, storm of 28 October 2003 Halloween Solar
Storms, and storm of 17 March 2015 St. Patrick’s Day event) show a clearer difference in the
connection of time series in comparison to analyzed periods after a solar storm. This result
is consistent with other studies that show that the impact of solar activity on human health
also depends on the intensity of the solar events occurring during a given observational
period [23–25].
It is therefore possible to identify specific changes in connection to time series of
daily number of deaths of men and women over 40 years of circulatory system diseases
and nervous system diseases in the time series of solar radio flux F10.7, geomagnetic
index Kp, and solar proton flux PF30 between observed periods after monitored solar
storms. However, none of these connections are present in the same form in all three
solar storms. Such connection is consistent with the results published in [20,22], where
the influence of the geomagnetic field was also identified and a connection with the
geomagnetic parameters (Kp).
The analysis took into account the specific conditions of the population in the Czech
Republic in the observed period [35,38]. The conditions correspond with local effect of
the observed solar storms, the differential characteristics of the population living in the
Czech Republic, the level of health care in the monitored period, and other determinants of
the health status of the population [36,37]. Thus, it is possible that the same geophysical
manifestation may have a different effect in different populations.
In the periods of analyzed solar storms in the minimized graphical models we did
not find any connection between the daily number of deaths and all indices of solar and
geomagnetic activity for any of the monitored groups according to age, sex, and group of
diagnoses. Exceptions here are groups of women in the age group over 40 years during
Halloween Solar Storm, and men in the age group over 40 years during Bastille Day Event.
In the observed periods of low solar activity, there is no model connection with geomagnetic
indices in diseases of the circulatory system compared to the period after the solar storm
for women in the age group over 40 years of completed age. During these periods of low
solar activity, in the minimized graphical models, no connection of the daily number of
deaths was found in parallel with all indices of solar and geomagnetic activity in any of the
monitored groups according to age, sex, and group of diagnoses.
5. Conclusions
In quiet periods of solar activity (13 September–24 October 1996, 21 July–20 August
2008, and 31 July–31 August 2009) none of the monitored groups according to age, sex, and
group of diagnoses was found to have a connection between the daily number of deaths
and all indices of solar and geomagnetic activity in the minimized graphical models, in
contrast to the periods of the analyzed solar storms (storm of 14 July 2000 Bastille Day
Event, storm of 28 October 2003 Halloween Solar Storms, and storm of 17 March 2015 St.
Patrick’s Day event) where Male 40+ and Female 40+ dependence is found for diseases of
the circulatory system.
The impact of exceptional solar events is evident in the case of neurological diseases,
and less evident for circulatory diseases. For all solar storms described in this paper, it can
be observed that daily numbers of deaths in the diagnostic groups VI, diseases of nervous
system (codes G00–G99), and IX, diseases of circulatory system (codes I00–I99), according
to age and sex, differ in statistical characteristics in the time period 30 days before solar
storm and 30 days after solar storm. For age groups with low daily numbers of deaths due
to the character of the diseases the results are not significant.
For time periods after strong solar storms, a connection between daily numbers of
deaths for diseases of circulatory system and geomagnetic index Kp, Solar proton fluxAtmosphere 2022, 13, 13 12 of 14
PF30, and solar radio flux F10.7 was identified. For men in age group over 40 years a
higher conditional dependence with solar radio flux F10.7 and geomagnetic index Kp was
observed after the event. For women over 40 years of age, a higher conditional dependence
with geomagnetic index Kp was also identified.
The connection of the daily number of deaths with all indices of the solar and geomag-
netic activity was found in the group of diseases of the circulatory system during the solar
storm on 28 October 2003 (Halloween Solar Storms), for women in the age group over 40;
and solar storm 14 July 2000 (Bastille Day Event), in men over the age of 40. During the
periods of low solar activity, in the minimized graphical models, no connection of the daily
number of deaths was found in parallel with all indices of solar and geomagnetic activity
in any of the monitored groups according to age, sex, and group of diagnoses.
Funding: This research was funded by the Czech Science Foundation, grant number SAV-21-01.
Institutional Review Board Statement: Not applicable.
Informed Consent Statement: Informed consent was obtained from all subjects involved in the study.
Data Availability Statement: Number of deaths by cause: Czech Statistical Office (CZSO). Available
online: https://www.czso.cz/csu/czso/obypz_cr (accessed on 2 November 2019). Kp index: World
Data Center for Geomagnetism, Kyoto University, Japan. The data used for time series assembling
was provided in case of Kp by World Data Center for Geomagnetism, Kyoto University, Japan,
available online: http:/wdc.kugi.kyoto-u.ac.jp/kp/index.html (accessed on 1 April 2020). In case of
F10.7 by NWRA/CoRA, NorthWest Research Associates, Boulder, USA, available online: http:/www.
nwra.com/spawx/spawx.html (accessed on 1 April 2020).Dst, F10.7: Space Physics Interactive Data
Resource, National Geophysical Data Center, Boulder, USA. Proton density, Proton Flux: OMNIWeb
Plus, NASA/Goddard Space Flight Center, USA, available online: https://omniweb.gsfc.nasa.gov.
Solar (accessed on 1 April 2020). Cycle evolving: NWRA/CoRA, NorthWest Research Associates,
Boulder, USA; Deutsches GeoForschungs Zentrum, Germany.
Acknowledgments: The support under the grant SAV-21-01 by the Czech Science Foundation is
acknowledged. World Data Center for Geomagnetism, Deutsches GeoForschungsZentrum (GFZ),
NWRA/CoRA, NorthWest Research Associates, and UK Solar System Data Centre (UKSSDC) Ruther-
ford Appleton Laboratory is acknowledged for providing geomagnetic measurement.
Conflicts of Interest: The authors declare no conflict of interest.
References
1. Katsavrias, C.; Preka-Papadema, P.; Moussas, X.; Apostolou, T.; Theodoropoulou, A.; Papadima, T. Helio-geomagnetic influence
in cardiological cases. Adv. Space Res. 2013, 51, 96–106. [CrossRef]
2. Cornelissen, G.; Halberg, F.; Breus, T.; Syutkina, E.V.; Baevsky, R.; Weydahl, A.; Watanabe, Y.; Otsuka, K.; Siegelova, J.; Fiser, B.;
et al. Non-photic solar associations of heart rate variability and myocardial infarction. J. Atmos. Sol. Terr. Phys. 2002, 64, 707–720.
[CrossRef]
3. Otsuka, K.; Cornélissen, G.; Weydahl, A.; Holmeslet, B.; Hansen, T.; Shinagawa, M.; Kubo, Y.; Nishimura, Y.; Omori, K.; Yano, S.;
et al. Geomagnetic disturbance associated with decrease in heart rate variability in a subarctic area. Biomed. Pharmacother. 2000,
55, 51–56. [CrossRef]
4. Azcárate, T.; Mendoza, B.; Levi, J. Influence of geomagnetic activity and atmospheric pressure on human arterial pressure during
the solar cycle 24. Adv. Space Res. 2016, 58, 2116–2125. [CrossRef]
5. Gurfinkel, Y.; Vasin, A.L.; Pishchalnikov, R.Y.; Sarimov, R.M.; Sasonko, M.L.; Matveeva, T.A. Geomagnetic storm under laboratory
conditions: Randomized experiment. Int. J. Biometeorol. 2017, 62, 501–512. [CrossRef]
6. Gurfinkel, Y.I.; At’kov, O.Y.; Vasin, A.L.; Breus, T.K.; Sasonko., M.L.; Pishchalnikov, R.Y. Effect of zero magnetic field on
cardiovascular system and microcirculation. Life Sci. Space Res. 2016, 8, 1–7. [CrossRef]
7. Johnsen, S.; Lohmann, K.J. The physics and neurobiology of magnetoreception. Nat. Rev. Neurosci. 2005, 6, 703–712. [CrossRef]
[PubMed]
8. Gjerloev, J.W. A Global Ground-Based Magnetometer Initiative. EOS 2009, 90, 230–231. [CrossRef]
9. Gjerloev, J.W. The SuperMAG data processing technique. J. Geophys. Res. 2012, 117, A09213. [CrossRef]
10. Jursa, A.S. Handbook of Geophysics and the Space Environment; Air force geophysics laboratory; National Technical Information
Service: Springfield, MA, USA, 1985.Atmosphere 2022, 13, 13 13 of 14
11. Stoupel, E.; Kalediene, R.; Petrauskiene, J.; Starkuviene, S.; Abramson, E.; Israelevich, P.; Sulkes, J. Clinical Cosmobiology:
Distribution of Deaths during 180 Months and Cosmo Physical Activity. The Lithuanian Study, 1990–2004. In The Role of Cosmic
Rays. Study Report; Division of Cardiology Rabin Medical Center Tel Aviv University: Tel Aviv, Israel, 2004.
12. Watanabe, Y.; Cornellissen, G.; Halberg, F.; Otsuka, K.; Ohkawa, S.I. Associations by signatures and coherences between the
human circulation and helio- and geomagnetic activity. Biomed. Pharmacother. 2001, 55 (Suppl. 1), 76–83. [CrossRef]
13. Stoupel, E.; Kalediene, R.; Petrauskiene, J.; Starkuviene, S.; Abramson, E.; Israelevich, P.; Sulkes, J. Twenty years study of solar,
geomagnetic, cosmic ray activity links with monthly deaths number (n-850304). J. Biomed. Sci. Eng. 2011, 4, 426–434. [CrossRef]
14. Stoupel, E. The effect of geomagnetic activity on cardiovascular parameters. Biomed. Pharmacother. 2002, 56, 247. [CrossRef]
15. Stoupel, E.; Birk, E.; Kogan, A.; Klinger, G.; Abramson, E.; Israelevich, P.; Sulkes, J.; Linder, N. Congenital heart disease:
Correlation with fluctuations in cosmophysical activity, 1995–2005. Int. J. Cardiol. 2009, 135, 207–210. [CrossRef] [PubMed]
16. Halberg, F.; Cornelissen, G.; Otsuka, K.; Watanabe, Y.; Katinas, G.; Burioka, N.; Delyukov, A.; Gorgo, Y.; Zhao, Z.; Weydahl, A.;
et al. 21-year biological and physical cycles, magnetic storms and myocardial infarctions. Neuro Endocrinol. Lett. 2000, 21, 233.
[PubMed]
17. Halberg, F.; Cornélissen, G.; Otsuka, K.; Fiser, B.; Mitsutake, G.; Wendt, H.; Johnson, P.; Gigolashvili, M.; Breus, T.; Sonkowsky, R.;
et al. Near 10-Year and Longer Periods Modulate Circadians: Intersecting Anti-aging and Chronoastrobiological Research. J.
Gerontol. A Biol. Sci. Med. Sci. 2001, 56, M304–M324. [CrossRef]
18. Halberg, F.; Cornélissen, G.; Otsuka, K.; Fiser, B.; Mitsutake, G.; Wendt, H.; Johnson, P.; Gigolashvili, M.; Breus, T.; Sonkowsky,
R.; et al. Incidence of sudden cardiac death, myocardial infarction and far- and near-transyears. Biomed. Pharmacother. 2005, 59,
S239–S261. [CrossRef]
19. Dorman, L.I.; Iucci, N.; Ptitsyna, N.G.; Villoresi, G. Cosmic rays as indicator of space weather influence on frequency of infract
myocardial, brain strokes, car and train accidents. In Proceedings of the 27th International Cosmic Ray Conference, Hamburg,
Germany, 7–15 August 2001; p. 3511.
20. Ebrille, E.; Konecny, T.; Konecny, D.; Spacek, R.; Jones, P.; Ambroz, P.; DeSimone, C.V.; Powell, B.D.; Hayes, D.L.; Friedman, P.A.;
et al. Correlation of Geomagnetic Activity With Implantable Cardioverter Defibrillator Shocks and Antitachycardia Pacing. Mayo
Clin. Proc. 2015, 90, 202–208. [CrossRef]
21. Podolská, K. The Impact of Ionospheric and Geomagnetic Changes on Mortality from Diseases of the Circulatory System. J. Stroke
Cerebrovasc. Dis. 2018, 27, 404–417. [CrossRef]
22. Mavromichalaki, H.; Preka-Papadema, P.; Theodoropoulou, A.; Paouris, E.; Apostolou, T. A study of the possible relation of the
cardiac arrhythmias occurrence to the polarity reversal of the solar magnetic field. Adv. Space Res. 2017, 59, 366–378. [CrossRef]
23. Vencloviene, J.; Babarskiene, R.; Milvidaite, I.; Kubilius, R.; Stasionyte, J. The effect of solar–geomagnetic activity during hospital
admission on coronary events within 1 year in patients with acute coronary syndromes. Adv. Space Res. 2013, 52, 2192–2198.
[CrossRef]
24. Vencloviene, J.; Antanaitiene, J.; Babarskiene, R. The association between space weather conditions and emergency hospital
admissions for myocardial infarction during different stages of Solar activity. J. Atmos. Sol. Terr. Phys. 2016, 149, 52–58. [CrossRef]
25. Jaruševičius, G.; Rugelis, T.; McCraty, R.; Landauskas, M.; Berškienė, K.; Vainoras, A. Correlation between Changes in Local
Earth’s Magnetic Field and Cases of Acute Myocardial Infarction. Int. J. Environ. Res. Public Health 2018, 15, 399. [CrossRef]
26. Geronikolou, S.; Leontitsis, A.; Petropoulos, V.; Davos, C.; Cokkinos, D.; Chrousos, G. Cyclic stroke mortality variations follow
sunspot patterns. F1000Research 2020, 9, 1088. [CrossRef] [PubMed]
27. Vencloviene, J.; Radisauskas, R.; Vaiciulis, V.; Kiznys, D.; Bernotiene, G.; Kranciukaite-Butylkiniene, D.; Tamosiunas, A. As-
sociations between Quasi-biennial Oscillation phase, solar wind, geomagnetic activity, and the incidence of acute myocardial
infarction. Int. J. Biometeorol. 2020, 64, 1207–1220. [CrossRef] [PubMed]
28. Kiznys, D.; Vencloviene, J.; Milvidaite, I. The associations of geomagnetic storms, fast solar wind, and stream interaction regions
with cardiovascular characteristic in patients with acute coronary syndrome. Life Sci. Space Res. 2020, 25, 1–8. [CrossRef]
29. Vencloviene, J.; Babarskiene, R.; Slapikas, R.; Sakalyte, G. The association between phenomena on the sun, geomagnetic activity,
meteorological variables, and cardiovascular characteristic of patients with myocardial infarction. Int. J. Biometeorol. 2013, 57,
797–804. [CrossRef] [PubMed]
30. Pishchalnikov, R.Y.; Gurfinkel, Y.I.; Sarimov, R.M.; Vasin, A.L.; Sasonko, M.L.; Matveeva, T.A.; Binhi, V.N.; Baranov, M.V.
Cardiovascular response as a marker of environmental stress caused by variations in geomagnetic field and local weather. Biomed.
Signal Process. Control. 2019, 51, 401–410. [CrossRef]
31. Vencloviene, J.; Radisauskas, R.; Tamosiunas, A.; Luksiene, D.; Sileikiene, L.; Milinaviciene, E.; Rastenyte, D. Possible Associations
between Space Weather and the Incidence of Stroke. Atmosphere 2021, 12, 334. [CrossRef]
32. Vaičiulis, V.; Venclovienė, J.; Tamošiūnas, A.; Kiznys, D.; Lukšienė, D.; Krančiukaitė-Butylkinienė, D.; Radišauskas, R. Associations
between Space Weather Events and the Incidence of Acute Myocardial Infarction and Deaths from Ischemic Heart Disease.
Atmosphere 2021, 12, 306. [CrossRef]
33. ÚZIS ČR: Czech Health Statistics Yearbook 2015; ÚZIS ČR: Prague, Czech Republic, 2016.
34. Poppová, M. IRIS: Language-Independent Software for Coding Causes of Death—Implementation in Czech Republic. IRIS:
Jazykově nezávislý software pro kódování příčin smrti—implementace v ČR. Demografie 2011, 53, 392–396.Atmosphere 2022, 13, 13 14 of 14
35. Cífková, R.; Škodová, Z.; Bruthans, J.; Holub, J.; Adámková, V.; Jozífová, M.; Galovcová, M.; Wohlfahrt, P.; Krajčoviechová, A.;
Petržílková, Z.; et al. Longitudinal trends in cardiovascular mortality and blood pressure levels, prevalence, awareness, treatment,
and control of hypertension in the Czech population from 1985 to 2007/2008. J. Hypertens. 2010, 28, 2196–2203. [CrossRef]
36. Cífková, R.; Bruthans, J.; Wohlfahrt, P.; Krajčoviechová, A.; Šulc, P.; Jozífová, M.; Eremiášová, L.; Pudil, J.; Linhart, A.; Widimský,
J.; et al. 30-year trends in major cardiovascular risk factors in the Czech population, Czech MONICA and Czech post-MONICA,
1985-2016/17. PLoS ONE 2020, 15, e0232845. [CrossRef]
37. Cífková, R.; Bruthans, J.; Wohlfahrt, P.; Krajčoviechová, A.; Šulc, P.; Eremiášová, L.; Pudil, J.; Linhart, A.; Widimský, J.; Filipovský,
J.; et al. The prevalence of major cardiovascular risk factors in the Czech population in 2015–2018. The Czech post-MONICA
study. COR ET VASA 2020, 62, 6–15. [CrossRef]
38. Bruthans, J.; Cífková, R.; Lánská, V.; O’Flaherty, M.; Critchley, J.A.; Holub, J.; Janský, P.; Zvárová, J.; Capewell, S. Explaining the
decline in coronary heart disease mortality in the Czech Republic between 1985 and 2007. Eur. J. Prev. Cardiol. 2014, 21, 829–839.
[CrossRef] [PubMed]
39. Riffe, T.; Acosta, E. Data Resource Profile: COVerAGE-DB: A global demographic database of COVID-19 cases and deaths. Int. J.
Epidemiol. 2021, 50, 390–390f. [CrossRef]
40. Hulíková Tesárková, K. Demographic aspects of the COVID-19 pandemic in Italy, Spain, Germany, and South Korea. Geografie
2020, 125, 139–170. [CrossRef]
41. Jürgen, M.; Oliver, B.; Katrin, T.; Kirsten, E.; Claudia, S. Geomagnetic Kp index. V. 1.0. GFZ Data Serv. 2021. [CrossRef]
42. Matzka, J.; Stolle, C.; Yamazaki, Y.; Bronkalla, O.; Morschhauser, A. The geomagnetic Kp index and derived indices of geomagnetic
activity. Space Weather 2021, 19, e2020SW002641. [CrossRef]
43. Tapping, K.F. The 10.7 cm solar radio flux (F10.7). Space Weather 2013, 11, 394–406. [CrossRef]
44. Ebert-Uphoff, I.; Deng, Y. Causal discovery for climate networks. Res. Rep. 2010. Available online: http://smartech.gatech.edu/
handle/1853/36564 (accessed on 11 July 2019).
45. Ebert-Uphoff, I.; Deng, Y. Causal discovery for climate research using graphical models. J. Clim. 2012, 25, 5648–5665. [CrossRef]
46. Bannerjee, A. Probabilistic graphical models for climate data analysis, paper presented at Supercomputing Workshop on Climate
Knowledge Discovery (CKD-SC11). IEEE Comput. Soc. Seattle Wash 2011, 13. [CrossRef]
47. Whittaker, J. Graphical Models in Applied Multivariate Statistics; Wiley: New York, NY, USA, 1990; pp. 182–185.
48. Lauritzen, S.L. Graphical Models; Oxford Science Publications: New York, NY, USA, 1996; ISBN 0-19-852219-3.
49. Podolská, K.; Koucká Knížová, P.; Chum, J.; Kozubek, M.; Burešová, D. Analysis of relationship between ionospheric and solar
parameters using graphical models. J. Geophys. Res. Space Phys. 2021, 126, e2020JA029063. [CrossRef]
50. Podolská, K. Changes of Circulatory and Nervous Diseases Mortality Patterns during Periods of Exceptional Solar Events.
Atmosphere 2021, 12, 203. [CrossRef]
51. Buhl, S. On the existence of maximum likelihood estimators for graphical Gaussian models. Scand. J. Statist. 1993, 20, 263–270.
52. Cramer, E. Conditional iterative proportional fitting for Gaussian distributions. J. Multivar. Anal. 1998, 65, 261–276. [CrossRef]
53. Jordan, M.I. Graphical models. Stat. Sci. 2004, 19, 140–155. [CrossRef]
54. Koller, D.; Friedman, N. Probabilistic Graphical Models–Principles and Techniques, 1st ed.; MIT Press: Cambridge, MA, USA, 2009;
1280p, ISBN 978-0-262-01319-2.
55. Edwards, D. Introductions to Graphical Modeling, 2nd ed.; Includes MIM software; Springer: New York, NY, USA, 2000;
ISBN 978-1-4612-0493-0.You can also read


