Classification Aware Neural Topic Model for COVID-19 Disinformation Categorisation
←
→
Page content transcription
If your browser does not render page correctly, please read the page content below
Classification Aware Neural Topic Model for COVID-19
                                                      Disinformation Categorisation
                                                      Xingyi Song 1,* , Johann Petrak1, 2 , Ye Jiang1 , Iknoor Singh1, 3 , Diana Maynard1 ,
                                                      Kalina Bontcheva1 ,

                                                      1 Department of Computer Science, University of Sheffield, Sheffield, United Kingdom
                                                      2 Austrian Research Institute for Artificial Intelligence, Vienna, Austria
arXiv:2006.03354v2 [cs.LG] 11 Mar 2021

                                                      3 Panjab University, Chandigarh, India

                                                      *Corresponding author E-mail: x.song@sheffield.ac.uk

                                                      Abstract
                                                      The explosion of disinformation accompanying the COVID-19 pandemic has overloaded
                                                      fact-checkers and media worldwide, and brought a new major challenge to government
                                                      responses worldwide. Not only is disinformation creating confusion about medical
                                                      science amongst citizens, but it is also amplifying distrust in policy makers and
                                                      governments. To help tackle this, we developed computational methods to categorise
                                                      COVID-19 disinformation. The COVID-19 disinformation categories could be used for
                                                      a) focusing fact-checking efforts on the most damaging kinds of COVID-19
                                                      disinformation; b) guiding policy makers who are trying to deliver effective public
                                                      health messages and counter effectively COVID-19 disinformation. This paper presents:
                                                      1) a corpus containing what is currently the largest available set of manually annotated
                                                      COVID-19 disinformation categories; 2) a classification-aware neural topic model
                                                      (CANTM) designed for COVID-19 disinformation category classification and topic
                                                      discovery; 3) an extensive analysis of COVID-19 disinformation categories with respect
                                                      to time, volume, false type, media type and origin source.

                                                      1    Introduction
                                                      COVID-19 is not just a global pandemic, but has also led to an ‘infodemic’ (“an
                                                      over-abundance of information”) [1] and a ‘disinfodemic’ (“the disinformation swirling
                                                      amidst the COVID-19 pandemic”) [2]. The increased volume [3] of COVID-19 related
                                                      disinformation has already caused significant damage to society; examples include: 1)
                                                      false treatments endangering health, including disinformation [4] claiming that
                                                      drinking alcohol can cure or prevent the new coronavirus, resulting in the deaths of
                                                      more than 700 people from drinking denatured alcohol [5]; 2) public mistrust,
                                                      including doctors being attacked because disinformation in WhatsApp claimed “health
                                                      workers were forcibly taking away Muslims and injecting them with the coronavirus” [6];
                                                      3) public property damage, including the burning of 5G masts caused by
                                                      disinformation claiming they cause COVID-19 [7].
                                                          The ability to monitor and track at scale the categories of COVID-19 disinformation
                                                      and the trends in their spread over time is an essential part of effective disinformation
                                                      responses by media and governments. For instance, First Draft needed our COVID-19
                                                      disinformation classifier to identify “data deficits” and track changing demand and
                                                      supply of credible information on COVID-19 [8].

                                     March 12, 2021                                                                                           1/22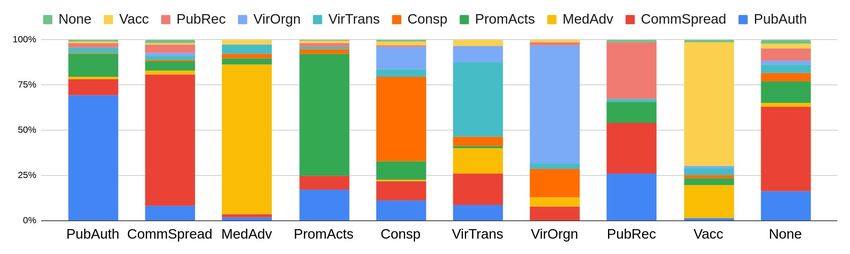
To enable such large-scale continuous monitoring and analysis, this paper presents a
                 novel automatic COVID-19 disinformation classifier. It also provides an initial
                 statistical analysis of COVID-19 disinformation in Section 5. The classifier is available
                 both for research replicability and use by professionals (including those at the Agence
                 France Presse (AFP) news agency and First Draft) The challenges of COVID-19
                 disinformation categorisation are that:
                   1. there is no sufficiently large existing dataset annotated with COVID-19
                      disinformation categories, which can be used to train and test machine learning
                      models;
                   2. due to the time-consuming nature of manual fact-checking and disinformation
                      categorisation, manual corpus annotation is expensive and slow to create.
                      Therefore the classifier should train robustly from a small number of examples.
                   3. COVID-19 disinformation evolves quickly alongside the pandemic and our
                      scientific understanding. Thus the model should provide suggestions about newly
                      emerging relevant categories or sub-categories.
                   4. the classifier decisions should be self-explanatory, enabling journalists to
                      understand the rationale for the auto-assigned category.
                     To address the first challenge, we created a new COVID-19 disinformation
                 classification dataset. It contains COVID-19 disinformation debunked by the IFCN-led
                 CoronaVirusFacts Alliance, and has been manually annotated with the categories
                 identified in the most recent social science research on COVID-19 disinformation [3].
                 COVID-19 disinformation refers to false or misleading information related to COVID-19
                 that has potentially negative impacts. In this study, false claims debunked by the
                 independent fact-checking members of the International Fact-Checking Network (IFCN)
                 are deemed to be COVID-19 disinformation; no further selection criteria were applied.
                     To address the remaining three challenges, we propose a Classification-Aware Neural
                 Topic Model (CANTM) which combines the benefits of BERT [9] with a Variational
                 Autoencoder (VAE) [10, 11] based document model [12]. The CANTM model offers:
                   1. Robust classification performance especially on a small training set – instead of
                       training the classifier directly on the original feature representation, the classifier
                       is trained based on generated latent variables from the VAE [13]. In this case the
                       classifier has never seen the ‘real’ training data during the training, thus reducing
                       the chance of over-fitting. Our experiments show that combining BERT with the
                      VAE framework improves classification results on small datasets, and is also
                       scalable to larger datasets.
                   2. Ability to discover the hidden topics related to the pre-defined classes – the success
                       of the VAE as a topic model (Some researchers distinguish ‘document model’ from
                      ‘topic model’ [14, 15]. For simplicity, we consider both as a topic model.) has
                       already been established in previous research [12, 14, 16]. We further adapt the
                      VAE-based topic modelling to be classification-aware, by proposing a stacked VAE
                       and introducing classification information directly in the latent topic generation.
                   3. The classifier is self-explaining – in CANTM the same latent variable (topic) is
                       used both in the classifier and for topic modelling. Thus the topic can be regarded
                       as an explanation of the classification model. We further introduce
                      ‘class-associated topics’ that directly map the topic words to classifier classes.
                      This enables the inspection of topics related to a class, thus providing a ‘global’
                       explanation of the classifier. In addition, BERT attention weights could also be
                       used to explain classifier decision, but this is outside the scope of this paper.

                    Our experiments in Section 4 compare CANTM classification and topic modelling
                 performance against several state-of-the-art baseline models, including BERT and the

March 12, 2021                                                                                           2/22
Scholar supervised topic model [16]. The experiments demonstrate that the newly
                 proposed CANTM model has better classification and topic modelling performance (in
                 accuracy, average F1 measure, and perplexity) and is also more robust (measured in
                 standard deviation) than the baseline models.
                    The main contributions of this paper are:
                     1. A new COVID-19 disinformation corpus with manually annotated categories.
                     2. A BERT language model with an asymmetric VAE topic modelling framework,
                        which shows performance improvement (over using BERT alone) in a low-resource
                        classifier training setting.
                     3. The CANTM model, which takes classification information into account for topic
                        generation.
                     4. The use of topic modelling to introduce ‘class-associated’ topics as a global
                        explanation of the classifier.
                     5. An extensive COVID-19 disinformation category analysis.
                     6. The corpus and source code of this work are open-source, and the web service and
                        API are publicly available (please refer to Section 9 for details).

                 2     Dataset and Annotation
                 The dataset categorises according to topic false claims about COVID-19, which were
                 debunked and published on the IFCN Poynter website
                 (https://www.poynter.org/ifcn-covid-19-misinformation/). The dataset covers
                 debunks of COVID-19-related disinformation from over 70 countries and 43 languages,
                 published in various sources (including social media platforms, TV, newspapers, radio,
                 message applications, etc.).

                     Label Fields               Extraction Method                             Example
                     a. Debunk Date               IFCN HTML                                 2020/04/09
                     b. Claim                     IFCN HTML                 A photograph ... lockdown.
                     c. Explanation               IFCN HTML                    The photo was ... officer.
                     d. Source link               IFCN HTML              factcheck.afp.com/photo-was...
                     e. Veracity                  String Match                                     False
                     f. Originating platform      String Match            Facebook, Twitter, Instagram
                     g. Source page language        langdetect                                  English
                     h. Media Types                JAPE Rule                                      Image
                     i. Categories              Manually annotated                     Prominent actors

                 Table 1. COVID-19 disinformation category data structure

                     The structure of the data is illustrated in Table 1 (for a full description of all label
                 fields in the table, please refer to S1 Appendix A). Each dataset entry includes 9
                 different fields. Fields a to d are extracted directly from HTML tags in the IFCN web
                 page. Besides the manually-assigned category label (field i), we also apply various
                 Natural Language Processing (NLP) tools to automatically extract and refine the
                 information contained in fields e (Veracity), f (Claim Origin), g (Source page language),
                 h (Media Types).
                     The manual labelling of the dataset entries into disinformation categories was
                 conducted as part of the EUvsVirus hackathon (https://www.euvsvirus.org/). We

March 12, 2021                                                                                          3/22
defined 10 different COVID-19 disinformation categories based on [3]: (i) Public
authority; (ii) Community spread and impact; (iii) Medical advice, self-treatments, and
virus effects; (iv) Prominent actors; (v) Conspiracies; (vi) Virus transmission; (vii)
Virus origins and properties; (viii) Public Reaction; (ix) Vaccines, medical treatments,
and tests; and (x) Other. Please refer to S4 Appendix D for the full description of these
categories.
During the hackathon 27 volunteer annotators were recruited amongst the hackathon
participants. The annotation process undertaken as part of the WeVerify project has
received ethical clearance from the University of Sheffield Ethics Board. The volunteer
annotators who manually categorised the COVID-19 false claims were provided with the
project’s information sheet alongside the instructions for data annotation. As all
annotations were carried out via an online data annotation tool, consent was obtained
verbally during the virtual annotator information sharing and training session. The
dataset contains false claims and IFCN debunks in English published until 13th April,
2020 (the hackathon end date). The claim, the fact-checkers’ explanation and the source
link to the fact-checkers’ own web page were all provided to the annotators. The
volunteers were trained to assign to each false claim the most relevant of the 10
COVID-19 disinformation categories and to indicate their confidence (on a scale of 0 to
9). The English claims were randomly split into batches of 20 entries. In the first round,
all annotators worked on unique batches. In the second round, they received
randomised claims from the first round, so inter-annotator agreement (IAA) could then
be measured.
The volunteers annotated 2,192 false claims and their debunks (see Table 2).
Amongst these, 424 samples were double- or multiple-annotated, from which we
calculated the IAA. At this stage, vanilla Cohen’s Kappa [17] was only 0.46.
To increase the data quality and provide a good training sample for our ML model,
we applied a cleaning step to filter low quality annotations. We first measured annotator
quality by observing agreement change when removing an (anonymous) annotator. This
annotator quality was scored based on the magnitude of score variance. Based on this,
the annotations from the two annotators with the lowest scores were removed.
We also measured the impact of annotator confidence score on annotation agreement
and the amount of filtered data, and set a confidence threshold for each annotator,
based on the quality check from the first round (for most annotators, this threshold was
6). Any annotation with confidence below this threshold was filtered out.
Ultimately, 1,293 debunks remained with at least one reliable classification, and IAA
rose to 73.36% and Cohen’s Kappa to 0.7040.
All Cleaned
Single Annotated 1056 1038
Double Annotated 213 186
Multiple Annotated 211 69
Annotation Agreement 0.5145 0.7336
Kappa 0.4660 0.7040
Table 2. Label counts and annotation agreements of unfiltered annotation (All) and
filtered annotation (Cleaned)
The final dataset was produced by merging the multiple-annotated false claims on
the basis of: 1) majority agreement between the annotators where possible; 2)
confidence score – if there was no majority agreement, the label with the highest
confidence score was adopted. Table 3 shows the statistics of the merged dataset for
each of the ten categories. Category distribution is consistent with that found in [3].
March 12, 2021 4/22PubAuthAction CommSpread PubRec PromActs
251 225 60 221
GenMedAdv VirTrans Vacc Consp
177 80 76 97
VirOrgn None
63 43
Table 3. Number of examples per category in the final dataset
3 Classification Aware Neural Topic Model
This section begins with a brief overview of related work on topic models, which is a
necessary background motivation for our CANTM model, which is described in
Section 3.1. Other related work is reviewed in Section 7.2.
Miao et. al. [12] introduce a generative neural variational document model (NVDM)
that models the document (x) likelihood p(x) using a variational autoencoder (VAE),
which can be described as:
log p(x) = ELBO + DKL (q(z|x)||p(z|x))
(1)
ELBO = Eq(z|x) [log p(x|z)] − DKL (q(z|x)||p(z))
Where p(z) is the prior distribution of latent variable z, q(z|x) is the inference network
(encoder) used to approximate the posterior distributions p(z|x) and p(x|z) is the
generation network (decoder) to reconstruct the document based on latent variable
(topics) z ∼ q(z|x) sampled from the inference network.
According to Equation 1, maximising the ELBO (evidence lower bound) is equivalent
to maximising the p(x) and minimising the Kullback–Leibler divergence (DKL ) between
q(z|x) and p(z|x). Therefore, maximising ELBO will be the objective function in the
NVDM or VAE framework, or negative ELBO for gradient descent optimisation. The
latent variable z then can be treated as the latent topics of the document.
NVDM is an unsupervised model, hence we have no control on the topic generation.
In order to uncover the topics related to the target y (e.g. category, sentiment or
coherence) in which we are interested, we can consider several previous approaches. The
Topic Coherence Regularization (NTR) [18] applies topic coherence as additional loss
(i.e. loss L = −ELBO + C) to regularise the model and generate more coherent topics.
SCHOLAR [16] directly inserts the target information into the encoder (i.e. q(z|x, y)),
making the latent variable also dependent on the target. However, when target
information is missing at application time, SCHOLAR treats the target input as a
missing feature (i.e. all zero vector) or all possible combinations. Hence the latent
variable becomes less dependent on the target.
Inspired by the stacked VAE of [13], we combined ideas from NTR and SCHOLAR.
In particular, we stacked a classifier-regularised VAE (M1) and a classifier-aware VAE
(M2) enabling the provision of robust latent topic information even at testing time
without label information.
3.1 Model Detail
The training sample D = (x, xbow , y) is a triple of the BERT word-pieces sequence
representation of the document (x), a bag-of-words representation of the document
(xbow ) and its associate target label y.
The general architecture of our model is illustrated in Fig 1. CANTM is a stacked
VAE containing 6 sub-modules:
March 12, 2021 5/22Softmax
~
~
linear Softmax
t Softmax
linear
x BERT h
linear
linear
CANTM
nonLin
classifier nonLin m
Softmax
Fig 1. Overview of model architecture, linear block is the linear transformation (i.e.
linear(x)=Wx+b), nonLin is linear transformation with non-linear activation function
f(linear(.)), Softmax is Softmax activated linear function
1. M1 encoder (or M1 inference network) q(z|x)
2. M1 decoder (or M1 generation network) p(xbow |z)
3. M1 Classifier ŷ = f (z)
4. M1 Classifier decoder p(x|ŷ)
5. M2 encoder (or M2 inference network) q(zs |x, ŷ)
6. M2 decoder (or M2 generation network) p(xbow |ŷ, zs ) and p(ŷ|zs )
Sub-modules 1 and 2 implement a VAE similar to NVDM. The modification over the
original NVDM is that instead of bag-of-words (xbow ) input and output to the model,
our input is a BERT word-pieces sequence representation of the original document (x).
The reason for this modification is that x can be seen as a grammar-enriched xbow , and
we could capture better semantic representation in the hidden layers (e.g. though
pre-trained BERT) and thus benefit the classification and topic generation. Also, q(z|x)
is an approximation of p(z|xbow ), and they do not have to follow the same
condition [10], as our model is still under the VAE framework. Sub-modules 5 and 6
implement another VAE that models the joint probability of document xbow and label ŷ.
Note that the label in M2 is a classifier prediction, hence this label information will
always be available for M2 VAE. To apply CANTM to unlabelled test data, we fix the
M1 weights that are pre-trained on the labelled data, and only train the M2 model. In
Sections 3.1.1 to 3.1.5, we will describe each sub-module in detail.
3.1.1 M1 Encoder
The M1 encoder is illustrated in the yellow part of Fig 1. During the encoding process,
the input x is first transformed into a BERT-enriched representation h using a
pre-trained BERT model. We use the CLS token output from BERT as h. Then linear
transformations linear1 (h) and linear2 (h) transform the h into parameters of
variational distribution that are used to sample the latent variable z.
lineark (h) = Wk h + bk (2)
Where Wk and bk are weight and bias vectors respectively for linear transformations k .
The variational distribution is a Gaussian distribution (N (µ, σ)) The M1 Encoder is
March 12, 2021 6/22represented in Equation 3.
q(z|x) = N (µ, σ)
µ = linear1 (h), σ = linear2 (h) (3)
h = BERT (x)
Following previous approaches [10–12], a re-parameterisation trick is applied to allow
back-propagation to go though the random node.
z =µ+σ , ∼ N (0, 1) (4)
where is random noise sampled from a 0 mean and variance 1 Gaussian distribution.
In the decoding process (described next), the document is reconstructed from the latent
variable z, hence z can be considered as the document topic.
3.1.2 M1 Decoder
The decoding process (the red part in Fig 1) reconstructs xbow from the latent variable
z. This is modelled by a fully connected feed-forward (FC) layer with softmax
activation (sigmoid activation normalised by softmax function. For the rest of the paper
we will describe this as softmax activation for simplicity). The likelihood of the
reconstruction p(xbow |z) can be calculated by
p(xbow |z) = sof tmax(zR + b) xbow
Where R ∈ R|z|×|V | , and |V | is the vocabulary size. R is a learnable weight for mapping
between topics and words. The topic words for each topic can be extracted according to
this weight. is the dot product.
3.1.3 M1 Classifier and Classifier Decoder
The classifier ŷ = sof tmax(F C(z)) is a softmax activated FC layer. It is based on the
same latent variable z as the M1 encoder. Since the M1 VAE and classifier are jointly
trained based on z, it can be seen as a ‘class regularized topic’ and also serve as a
‘global explanation’ of the classifier. Furthermore, ŷ itself can be seen as a compressed
topic of z, or ‘class-associated topic’. The document can be reconstructed by ŷ in the
same way as the M1 decoder, and the likelihood of p(xbow |ŷ) is given by:
p(xbow |ŷ) = sof tmax(ŷRct + b) xbow
where Rct ∈ R|y|×|V | is a learnable weight for ‘class-associated topic’ word mapping.
3.1.4 M2 Encoder
The encoding process of M2 (the blue part in Fig 1) is similar to M1, but instead of
only encoding x, M2 encodes both the document and the predicted label from the M1
classifier q(zs |x, ŷ). In the M2 encoder process, we first concatenate (⊕) the BERT
representation h and predicted label ŷ, then merge them through a leaky rectifier
(LRelu) [19] activated FC layer. We refer to this as nonLinn in the remainder of the
paper.
m = nonLin1 (h ⊕ ŷ)
= LRelu(F C(h ⊕ ŷ))
March 12, 2021 7/22As for the M1 encoder, a linear transformation then maps the merged feature m to the
parameters of the variational distribution represented by the latent variable of M2
model zs . The variational distribution is a Gaussian N (µs , σs ):
q(zs |x, ŷ) = N (µs , σs )
µs = linear3 (m), σs = linear4 (m)
3.1.5 M2 Decoder
The decoding process of M2 p(xbow , ŷ|zs ) is divided into two decoding steps
(p(xbow |ŷ, zs ) and p(ŷ|zs )) by Bayes Chain Rule.
The step p(ŷ|zs ) can be considered as M2 classifier, calculated by softmax FC layer,
the likelihood function is modelled as p(ŷ|zs ) = sof tmax(F C(zs )) ŷ. The M2
classifier will not be used for classification in this work, only for the loss calculation (see
Section 3.1.6).
In step p(xbow |ŷ, zs ), we first merge ŷ and zs using nonLin layer
t = nonLin2 (ŷ ⊕ zs )
Where t is a ‘classification aware topic’. Then xbow is reconstructed using a softmax
layer. The likelihood function is:
p(x|ŷ, zs ) = sof tmax(tRs + b) xbow
where Rs ∈ R|zs |×|V | is a learnable weight for the ‘classification aware topic’ word
mapping.
3.1.6 Loss Function
The objective of CANTM is to: 1) maximise ELBOxbow for M1 VAE; 2) maximise
ELBOxbow,ŷ for M2 VAE; 3) minimise cross-entropy loss Lcls for M1 classifier and 4)
maximise the log likelihood of M1 class decoder log[p(xbow |ŷ)]. Hence the loss function
for CANTM is
L = λLcls − ELBOxbow − ELBOxbow,ŷ
− Eŷ [log p(xbow |ŷ)]
= λLcls − Ez [log p(xbow |z)] + DKL (q(z|x)||p(z))
− Ezs [log p(xbow |ŷ, zs )] − Ezs [log p(ŷ|zs )]
+ DKL (q(zs |x, ŷ)||p(zs )) − Eŷ [log p(xbow |ŷ)]
where p(z) and p(zs ) are zero mean diagonal multivariate Gaussian priors (N (0, I)),
λ = vocabSize/numclass is a hyperparameter controlling the importance classifier loss.
For full details of the ELBO term deriving process please see S5 Appendix E)
4 CANTM Experiments
In this section, we compare the classification and topic modelling performance of
CANTM against state-of-the-art baselines (BERT [9] , SCHOLAR [16], NVDM [12],
and LDA [20] ), as well as human annotators.
The details of experiment settings for each model are described below:
March 12, 2021 8/22• BERT [9]: We use Huggingface [21] ‘BERT-based-uncased’ pre-trained model and
the Pytorch implementation in this experiment. As with CANTM, we use BERT
[CLS] output as BERT representation, and an additional 50 dimensional
feed-forward hidden layer (with leaky ReLU activation) after that.CANTM
contains a sampling layer after the BERT representation, this additional layer is
added for fair comparison. Please check Appendix E on impact of the additional
hidden layer. Only the last transformer encoding layer (layer 11) is unlocked for
fine-tuning, the rest of the BERT weights were frozen for this experiment. The
Pytorch (https://pytorch.org/) implementation of the Adam optimiser [22] is
used in the training with default settings. The batch size for training is 32. All
BERT-related (CANTM, NVDMb) implementations in this paper follow the same
settings.
• CANTM (our proposed method): We use the same BERT implementation and
settings as described above. The sampling size (number of samples z and zs
drawn from the encoder) in training and testing are 10 and 1 respectively, and we
only use expected value (µ) of q(z|x) for the classification at testing time. Unless
mentioned otherwise, the topics reported from CANTM are ‘classification-aware’.
• NVDM [12]: We re-implement NVDM Based on code at
https://github.com/YongfeiYan/Neural-Document-Modeling, with two
versions: 1) original NVDM as described in [12] (“NVDMo” in the results ); 2)
NVDM with BERT representation (“NVDMb” in the results).
• SCHOLAR [16]: We use the original author implementation from
https://github.com/dallascard/scholar with all default settings (except the
vocabulary size and number of topics).
• Latent Dirichlet Allocation (LDA) [20]: the Gensim [23] implementation is used.
The input for each disinformation instance is the combination of the text of the false
Claim and the fact-checkers’ Explanation (average text length 23 words), while the
vocabulary size for topic modelling is 2,000 words (S6 Appendix F – Experimental
Details provides additional detail on the parameters setting).
Table 4 shows average accuracy (Acc), macro F-1 measure (F-1). The F-1 is
calculated as the average F-1 measure of all classes. and perplexity (Perp.), based on
5-fold cross-validation. Standard deviation is reported in parentheses. The majority
class is ‘Public authority action (‘PubAuth’) at 19.4%).
To ensure fair comparison between CANTM and the BERT classifier, we first
compared: 1) BERT with an additional hidden layer that matches the dimension of
latent variables (denoted BERT in the result); 2) BERT without the additional hidden
layer, i.e. applying BERT [CLS] token output directly for classification (denoted
BERTraw in the Table 4 ). According to our results, BERT with the additional hidden
layer has better performance in both accuracy and F-measure. Therefore, unless
mentioned otherwise thereon ‘BERT’ refers to BERT with the additional hidden layer.
BERT as a strong baseline outperforms SCHOLAR in accuracy by more than 10%,
and almost 18% F-1 measure. This is expected, because BERT is a discriminative
model pre-trained on large corpora and has a much more complex model structure than
SCHOLAR.
Our CANTM model shows an almost 5% increase in accuracy and more than 1% F-1
improvement over BERT. Note that CANTM not only improves the accuracy and F1
measure over the best performing BERT baseline, but it also improves standard
deviation. Training on latent variables with multi-task loss is thus an efficient way to
train on a small dataset even with a pre-trained embedding/language model. In the
topic modelling task, CANTM has the best (lowest) perplexity performance compared
with the traditional unsupervised topic model LDA, VAE based unsupervised topic
March 12, 2021 9/22Acc. F-1 Perp.
Bert 58.78(3.36) 54.19(6.85) n/a
BERTraw 58.77(3.56) 49.74 (7.62) n/a
Scholar 48.17(6.78) 36.40(10.85) 2947(353)
NVDMb n/a n/a 1084(88)
NVDMo n/a n/a 781(35)
LDA n/a n/a 8518(1132)
CANTM 63.34(1.43) 55.48(6.32) 749(63)
Table 4. Five-fold cross-valuation classification and topic modelling results, n/a stands
for not applicable for the model. The standard deviation is shown in parentheses. The
majority class is ‘PubAuth’ at 19.4%
PubAuth CommSpread MedAdv PromActs Consp
BERT 61.17(4.50) 62.27(5.83) 75.03(6.54) 60.12(3.25) 49.92(12.04)
BERTraw 65.64(2.91) 59.35(4.77) 75.82(5.53) 65.51(4.34) 41.90 (10.46)
SCHOLAR 47.92(9.77) 48.84(11.56) 71.11(6.99) 46.93(8.66) 31.30(13.78)
CANTM 64.35(1.44) 66.50(3.87) 79.68(2.12) 67.21(3.72) 60.06(6.80)
VirTrans VirOrgn PubRec Vacc None
BERT 42.67(8.70) 57.62(6.72) 23.68(10.01) 64.62(9.66) 12.59(11.35)
BERTraw 41.42(5.36) 53.20(15.92) 27.19(13.55) 65.48(9.62) 1.90 (3.8)
SCHOLAR 11.71(10.06) 45.15(20.49) 5.71(11.42) 55.37(15.78) 0.0(0.0)
CANTM 40.21(8.56) 55.19(3.43) 25.04(9.87) 72.28(8.40) 15.52 (15.0)
Table 5. COVID-19 disinformation class level F1 score, standard deviation in
parentheses
model NVDM variants (NVDMo and NVDMb) and the supervised neural topic model
Scholar.
Table 5 shows the class-level F1 score on the COVID-19 disinformation corpus.
CANTM has the best F1 score over most of the classes (CommSpread, MedAdv,
PromActs, Consp, Vacc,None), also with better standard deviations. Except for the
None class, standard deviations for CANTM are below 10. From the results, the most
difficult class to assign is ‘None’. It represents disinformation that the annotators
struggled to classify into one of the other 9 categories and is therefore topically very
broad.
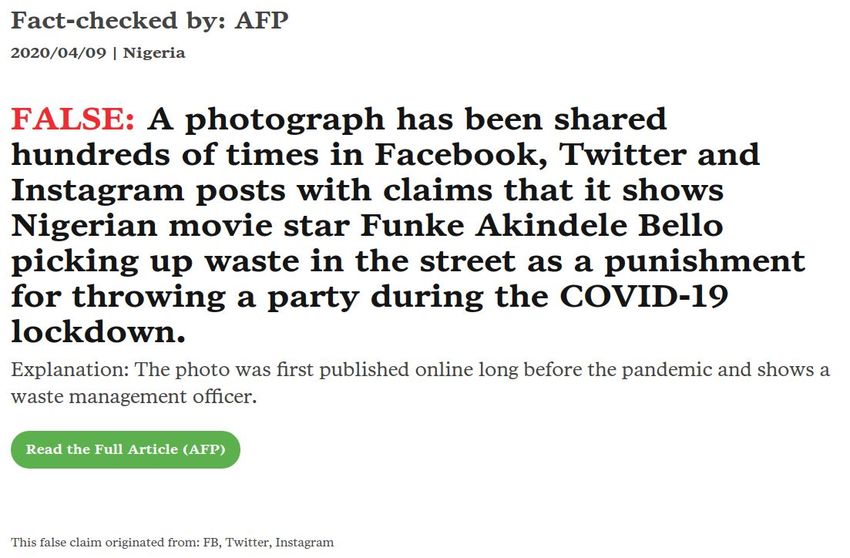
The human vs CANTM classification comparison is shown in Fig 2. Fig 2a is a
percentage stacked column chart of CANTM category prediction based on 5-fold
cross-validation (please refer to S7 Appendix G for the confusion matrix). Each column
represents the percentage of the predicted category (in a different colour) by CANTM.
For example, amongst all disinformation manually labelled as ‘Public authority action’
(the ‘PubAuth Column’), 69.3 % is correctly labelled by CANTM (shown in blue) and
12.4% is incorrectly labelled as ‘Prominent actors’ (shown in dark green).
Fig 2b is a percentage stacked column chart of human agreements according to
pairwise agreement. The colour in each column represents the percentage of annotator
agreement/disagreement in a given category. Our annotation agreement was measured
pairwise, therefore each column represents all disinformation that was annotated in a
certain category by at least one annotator, and the colours in each column represent the
percentage of the category annotated by another annotator. For example, for all
disinformation annotated as Public authority action by at least one annotator (the
‘PubAuth Column’) 60.2% of the time another annotator also annotated it as Public
authority action (shown in blue). This also means that the agreement percentage for
March 12, 2021 10/22a
b
Fig 2. a. Percentage stacked column chart of CANTM category prediction b.
Percentage stacked column chart of human agreements in the pairwise agreement
measurement.
the Public authority action class is 60.2%. The annotators disagreed on the remaining
39.8%, with 12.4% of them the second annotator annotated the instance as ‘Prominent
actors’ (shown in dark green), and 6.2% of the time as ‘Community spread’(red colour).
By comparing Fig 2a and Fig 2b, we can see that the percentages of CANTM errors
and human disagreement generally follow a similar distribution. The three categories
where CANTM has the lowest accuracy/ recall (Other:2.3%, Public preparedness:
31.3% and Virus Transmission: 41.3%) are also the three categories with the lowest
agreement between the human anotators (None: 8.3%, Public preparedness: 41.3% and
Virus Transmission: 47.1%).
CANTM prediction performance also depends on the number of instances available
for training (Table 3 shows the number of manual labels in each category available for
training). The categories ‘Public authority action’, ‘Community spread’, ‘Prominent
actors’ and ‘General medical advice’ have a relatively high number of instances (>= 177
instances) and also have better classification performance than other classes. In
addition, according to Fig 2, ‘General medical advice’ and ‘Vaccine development’ have
high disagreement between annotators. Classification error, however, is higher for the
‘Vaccine development’ category. This may be because the number of training instances
for the ‘General medical advice’ category is almost triple that of ‘Vaccine development’;
thus the model is more biased towards the former.
In general, the overall CANTM performance (accuracy: 63.34%, or agreement
between CANTM and the human annotators) is better than human inter-annotator
agreement prior to the filtering/cleaning process (51.45%).
March 12, 2021 11/22PubAuth CommSpread PubRec PromActs MedAdv
1672 1527 301 1160 1115
Category
VirTrans Vacc Consp VirOrgn Other
330 396 809 151 148
Video Text Audio Image Not Clear
Media Type
1774 3317 144 1647 897
False Part. False Misleading No Evid. Other
Veracity
6392 330 733 94 63
Twitter Facebook WhatsApp News Blog
1198 4333 1023 464 91
LINE Instagram Oth. Social Oth. msg TV
Platform
83 94 542 44 21
TikTok YouTube Other
17 279 949 - -
Spain India Brazil US Other
Country
484 1503 471 872 4282
EN ES PT FR Other
Language
2880 1385 540 421 2386
Table 6. Statistics of Debunked COVID-19 Disinformation by IFCN Members. (1
January - 30 June 2020)
5 COVID-19 Disinformation Analysis and
Discussion
As discussed above, the creation of the CANTM classifier was motivated by the
journalists’ and fact-checkers’ needs for in-depth, topical analysis and monitoring of
COVID-19 disinformation. Therefore, we also conducted a statistical analysis of
debunked COVID-19 disinformation during the first six months of 2020, with respect to
its category, the type of media employed, the social media platform where it originated,
and the claim veracity (e.g. false, misleading).
7609 debunks of COVID-19 disinformation were published by IFCN members
between 1st January and 30th June 2020 and were the focus of our study here. Each
false claim was categorised by our trained CANTM model into one of the ten topical
categories. Table 6 shows that the two most prevailing categories were disinformation
about government and public authority actions (PubAuth) and the spread of the disease
(CommSpread), which is consistent with the findings of the earlier small-scale social
science study by [3]
With respect to platform of origin, as shown in Table 6, Facebook was was leading
source with more than 45% of disinformation published there. Moreover, 3.6 times more
false claims originated on Facebook as compared to the second highest source, Twitter.
Unfortunately, the majority research into disinformation has focused on Twitter [24–34]
rather than Facebook, due to the highly restricted data access and terms and conditions
of the latter.
To capture the longitudinal changes, we calculated weekly trends of the number of
debunked disinformation (see Fig 3). The solid light green line represents the the weekly
number of debunked disinformation while the dashed orange line is the number of
worldwide Google searches for ‘Coronavirus’ (
https://trends.google.com/trends/explore?q=%2Fm%2F01cpyy). Debunked
disinformation was normalised to make it comparable to the Google search trends. We
used the same normalisation method as Google search, i.e. the percentage of debunked
disinformation compared to the week with the highest number of debunked
disinformation (week 29/03/2020 with 810 debunks). The highest normalised value is
March 12, 2021 12/22100
Google IFCN Vacc PubRec VirOrgn VirTrans Consp PromActs MedAdv CommSpread
PubAuth
75
50
25
0
2
1
1
2
2
2
2
3
3
3
3
3
4
4
4
4
5
5
5
5
5
6
6
6
/1
/0
/0
/0
/0
/0
/0
/0
/0
/0
/0
/0
/0
/0
/0
/0
/0
/0
/0
/0
/0
/0
/0
/0
01
19
26
02
09
16
23
01
08
15
22
29
05
12
19
26
03
10
17
24
31
07
14
21
Fig 3. Weekly trends of normalised IFCN debunks, COVID related Google Searches
and Categories
thus 100 in both cases.
The number of Google searches reflects global public interest in COVID-19. As
shown in Fig 3, the trends in debunked disinformation over time are similar to those for
Google searches, with a slight temporal delay which is likely due to the time required
for fact-checking.
The two trends also demonstrate that disinformation volume is proportional to the
information need of the general population. Both numbers start to grow from the
middle of January, and reach 2 peaks in the January to June period: the smaller peak is
at the end of January, and the second peak in the middle of March. It is likely that the
two peaks are related to the WHO announcement of Public Health Emergency of
International Concern on 30 January, 2020 and the COVID-19 pandemic on 11 March,
2020. Searches and disinformation both started to decay after the second peak.
The column chart on Fig 3) shows the proportion of each disinformation category (in
a different colour) on a weekly basis. At the beginning, the most widespread
disinformation category is ‘Conspiracy theory’. Between the end of January and mid
February the prevailing categories become ‘Community spread’ and ‘Virus origin’. On
February 9, WHO reported [35] that the number of COVID-19 deaths rose to 813 and
exceeded the number of deaths during the SARS-CoV (severe acute respiratory
syndrome coronavirus) outbreak. ‘General medical advice’ soon became the most highly
spread disinformation category until early March. Soon after the pandemic
announcement from WHO on March 11th, ‘Public authority action’ became the top
disinformation category and remained thereafter. Other widespread categories after
mid-March include ‘Community Spread’ and ‘Prominent actors’. In contrast,
disinformation about ‘Virus Origin’ became much less widespread after March.
image audio text video
100%
75%
50%
25%
0%
h
ea
v
sp
ts
ns
n
ec
cc
l
Al
Ad
ut
rg
Ac
Va
on
ra
bR
r
bA
Sp
rO
ed
om
rT
C
Pu
Vi
Pu
m
M
Vi
Pr
om
C
Fig 4. Percentage stacked column chart of media type vs. category
March 12, 2021 13/22We also investigated the question of the modalities employed by disinformation from
the different topical categories. Figure 4 shows a percentage stacked column chart per
category of the modality of the disinformation claims in this category, i.e. image, video,
text, or audio. The modality information is extracted automatically using rule-based
patterns applied to the ‘Claim’, ‘Explanation’, ‘Claim Origin’ and ‘Source page’ (though
‘Source Link’) of the published debunks. For details on the rule-based extractor see S3
Appendix C. The last column (All) in the figure is the overall distribution of media
types.
In general, Fig 4 shows that about half of the disinformation was spread through
primarily textual narratives (e.g. text messages, blog articles). Video and image-based
disinformation account for around a quarter of all media forms respectively, while only
2.1 % of COVID-19 disinformation was spread by audio.
At the category level, although textual narratives are the predominant media for
most categories (‘Public authority action’, ‘General medical advise’, ‘Prominent actors’,
‘Conspiracy theories’, ‘Virus transmission’ and ‘Vaccine development’), around 50% of
false claims about ‘Virus origin’ and ‘Public Preparedness’ are spread through video.
Image-based disinformation is not dominant in any category, although along with video
it has a relatively high percentage in disinformation about ‘Community Spread’.
Vacc PubRec VirOrgn VirTrans Consp PromActs MedAdv CommSpread PubAuth
100%
75%
50%
25%
0%
twitter facebook other_soci_m instagram news blog youtube line whatsapp other
Fig 5. Percentage stacked column chart of claim origin vs. category
The third key research question was concerned with the role of social media
platforms and messaging apps in the COVID-19 disinfodemic. Fig 5 is a percentage
stacked column chart, which shows on a per social platform/app basis a breakdown of
the categories of disinformation that circulated on that given platform/app. The
originating platforms/apps considered in this study are shown in Table 6. The
information about originating platform is extracted automatically from HTML tags in
the IFCN web page of each debunk and is post-processed through string matching
described in S2 Appendix B.
As shown in Fig 5, the category distribution across different social media platforms
(Facebook, Twitter, Instagram etc.) are similar, while the most widespread categories
are ‘Public Authority action’ and ‘Community Spread’. However, Instagram has a
considerably larger percentage of disinformation in the ‘virus origin’ category – 10.9%
for Instagram compared against less than 2% on other social media platforms. This may
be because Instagram has a higher proportion of video media than the other platforms,
and according to our previous finding (Fig 4) ‘Virus origin’ is frequently spread through
videos. The percentage of ‘Virus origin’ is also relatively high on the video platform
YouTube (7.2%). ‘Conspiracy theory’ disinformation is spread primarily through news,
YouTube, and blog posts, than through other social media platforms and messaging
apps (LINE and WhatsApp). This may be related to the lengthier nature of conspiracy
theory narratives and videos, which are thus better suited to news, YouTube, and blog
posts. In contrast, messaging apps (LINE and WhatsApp) have a much higher
proportion of ‘General medical advice’ disinformation than other platforms. What these
March 12, 2021 14/22findings demonstrate is that different kinds of authoritative information, public health
messages, and platform disinformation responses are needed for the different categories
of COVID-19 disinformation.
Vacc PubRec VirOrgn VirTrans Consp PromActs MedAdv CommSpread PubAuth
100%
75%
50%
25%
0%
false partial_false misleading no_evidence
Fig 6. Percentage stacked column chart of veracity type vs. category
The fourth research question is whether there are differences in the categories for
debunked COVID-19 claims of given veracity. We considered the following possible
values of claim veracity: False – The given COVID-19 claim has been rated as false by
the IFCN fact-checker who published the debunk; Partially False – the claim mixes
true and false information, according to the fact-checkers; Misleading – the claim is
rated as conveying misleading information; and No evidence – the fact-checkers found
no evidence to prove the claim is true or not. The claim veracity information is
extracted from the HTML tags on the IFCN debunk pages and is post-processed
through string matching, as described in S2 Appendix B. As shown in Table 6, 85% of
the debunked disinformation in our dataset has been rated ‘False’ by the fact-checkers.
Fig 6 is a percentage stacked column chart of disinformation categories per claim
veracity value. Overall, the distribution of topical categories per claim veracity value is
no different from the overall category distribution in the entire dataset. The topical
distribution of ‘misleading’ disinformation is slightly different from that of ‘false’
disinformation, as ‘Community spread’ has the largest proportion here. The ‘No
evidence’ type distribution is clearly different as compared to the others, with 52.1%
related to ‘General medical advice’, and ‘Conspiracy Theories’ as the second most
mentioned category. This may be because for these two categories of disinformation it
can be quite difficult to find solid scientific evidence that debunks them explicitly,
especially in the earlier stages of the pandemic.
6 COVID-19 Disinformation Topics
In order to offer further insights into COVID-19 disinformation that spread between
January and June 2020, we extracted the topics using CANTM by reusing the
pre-trained M1 model (with labelled data), and only trained the M1 Classifier decoder
and M2 model. Tables 7 shows the examples of Class- Associated topics. Class-
Associated topics are derived from Rct in M1 Classifier Decoder (Section 3.1.3) and the
topics are directly associate with pre-defined classes, hence called Class- Associated
topics.
Table 7 shows the top 10 topic words of the class-associated topics. As the topics are
directly associated with the classifier prediction, the topic words are strongly linked
with the pre-defined classes, and can be used as a global explanation of the classifier
and for discovering concepts related to the classes. For example, the top topic words for
Public Authority Action are ‘president’ and ‘ministry’.
March 12, 2021 15/22PubAuth covid-19 president india china patients people ministry social police
u.s.
CommSpread people covid-19 died coronavirus false infected new outbreak photo
shows
MedAdv coronavirus water evidence prevent covid-19 experts health novel
symptoms claims
PromActs coronavirus claim says novel please article people outbreak trump
donald
Consp virus new evidence chinese created says novel video also predicted
VirTrans spread claim health claims masks novel found china spreading
facebook
VirOrgn china outbreak covid-19 new market also novel indonesia shows
claim
PubRec video claim people shows novel outbreak lockdown times show old
Vacc covid-19 vaccine novel claim testing disease said trump march new
Table 7. COVID-19 classification-associated topics from unlabelled data
7 Related Work
7.1 COVID-19 Disinformation Datasets and Studies
Even though the COVID-19 infodemic is a very recent phenomenon, it has attracted
very significant attention among researchers. Prior relevant COVID-19 ‘infodemic’
research can be classified into one of two categories. The first one includes studies that
are based entirely on information related to COVID-19 (without specifically
distinguishing disinformation). The most relevant research in this category includes: the
creation of a COVID-19 relevant Twitter dataset based on a time period covering the
pandemic [24] or based on certain manually selected COVID-related hashtags [25–29];
sentiment analysis of information spread on Twitter [28, 30, 30, 36–41]; analysis of the
spreading pattern of news with different credibility on Twitter [28, 31] and other social
media platforms [32]; tweet misconception and stance dataset labelling and
classification [42]; analysis of tweet topics using unsupervised topic
modelling [30, 36–41, 43–49]; classification of informativeness of a tweet related to
COVID-19 [50, 51]. Among these, the study most similar to ours is Gencoglu (2020) [52],
which classifies tweets into 11 pre-defined classes using BERT and LaBSE [53]. However,
the categories defined in [52] are generally different from ours, since ours are categories
of disinformation specifically, whereas those of [52] aim to categorise all information
relevant to COVID-19.
Our paper thus falls into the second category, which focuses specifically on research
on COVID-19 disinformation. Related studies include: manually labelled likelihood of
tweets containing false information and what types of damage could arise from this false
information [34]; applying COVID-Twitter-BERT [54] to flag tweets for fact
checking [55]; applying pre-trained NLP models including BERT to automatically detect
false information [56–58]. As demonstrated in our experiments, the newly proposed
CANTM model outperforms BERT-based models on this task.
Attention to the study of categories specific to COVID-19 disinformation is also
found in previous research. Kouzy et. al. 2020 [33] study 673 tweets prior to February
27, 2020, and report the proportion of the disinformation in different categories
according to their manual labelling. Serrano et. al. 2020 [59] annotate 180 YouTube
videos with two set of labels – a) disinformation or not; b) conspiracy theory or not –
and propose several automatic classifiers using video comments based on pre-trained
March 12, 2021 16/22Transformer [60] models [61, 62] including BERT. Amongst these, the research closest to
ours is Brennen et. al. (2020) [3], who carried out a qualitative study of the types,
sources, and claims in 225 instances of disinformation across different platforms. In this
paper, we adopted their disinformation categories; developed an automated machine
learning method and a significantly larger annotated dataset; and extended the analysis
on a much larger scale and over a longer time period.
7.2 Variational AutoEncoder (VAE) and Supervised Topic
Modelling
With respect to the computational methods, the following research is also relevant:
VAE based topic/document modelling e.g. Mnih et. al. (2014) [63] trained a
VAE based document model using the REINFORCE algorithm [64]; Miao et. al. [14]
introduce Gaussian Softmax distribution, Gaussian Stick Breaking distribution and
Recurrent Stick Breaking process for topic distribution construction. Srivastava et. al.
in 2017 [65] proposed a ProdLDA that applies a Laplace approximation to
re-parameterise Dirichlet distribution in VAE. Zhu et. al. [66] apply a Biterm Topic
Model [67, 68] into the VAE framework for short text topic modelling. Topic models
with additional information (e.g. author, label etc.): example work includes
Supervised LDA [69], Labeled LDA [70], Sparse Additive Generative Model [71],
Structural Topic Models [72], Author Topic Model [73], Time topic model [74] and topic
model conditional on any arbitrary Features [15, 75]. NVDM in text classification:
NVDM is also is apply NVDM as additional topic features [76, 77] in text classification.
Compared with these approaches, CANTM is an asymmetric (different encoder input
and decoder output) VAE that directly uses VAE latent variable as classification feature
without external features, which enables the use of latent topics as classifier
explanations. This explainability feature is highly beneficial for our specific use case.
8 Conclusion
This paper introduced the COVID-19 disinformation categories corpus, which provides
manual annotation of debunked COVID-19 disinformation into 10 semantic categories.
After quality control and a filtering process, the inter-annotator agreement average
measured by Cohen’s Kappa is 0.70. The paper also presented a new
classification-aware topic model, that combines the BERT language model with the
VAE document model framework, and demonstrates improved classification accuracy
over a vanilla BERT model. In addition, the classification-aware topics provide
class-related topics, which are: a) an efficient way to discover the class of (pre-defined)
related topics; and b) a proxy explanation of classifier decisions.
The third contribution of this paper is a statistical analysis of COVID-19
disinformation which circulated between Jan and Jun 2020. It was conducted based on
the automatically assigned category labels, and our main findings are:
1. The announcements from public authorities (e.g. WHO) highly correlate to public
interest in COVID-19 and the volume of circulating disinformation. Moreover,
disinformation about public authority actions is the dominating type of
COVID-19 disinformation.
2. The relative frequency of the different disinformation categories varies throughout
the different stages of the pandemic. Initially, the most popular category was
‘Conspiracy theory’, but then focus shifted to disinformation about ‘Community
spread’ and ‘Virus origin’, only to shift again later towards disinformation about
March 12, 2021 17/22‘General medical advice’. As countries began to take actions to combat the
pandemic, disinformation about ‘Public authority actions’ began to dominate.
3. Different categories of disinformation are spread through different modalities. For
instance, about half of the ‘Virus origin’ and ‘Public reaction’ disinformation
posts are spread via video messages.
4. Facebook is the main originating platform of the disinformation debunked by
IFCN fact-checkers, even though it has received much less attention than Twitter
in related independent research.
9 Software and Data
• COVID-19 disinformation category dataset: https://www.kaggle.com/dataset/
fd97cd3b8f9b10c1600fd7bbb843a5c70d4c934ed83e74085c50b78d3db18443
• CANTM source code: https://github.com/GateNLP/CANTM
• Webservice:
https://cloud.gate.ac.uk/shopfront/displayItem/covid19-misinfo
• REST API:
https://cloud-api.gate.ac.uk/process-document/covid19-misinfo
References
1. WHO. Novel Coronavirus(2019-nCoV) Situation Report - 13. World Health
Organization; 2020.
2. Posetti J, Bontcheva K. Policy brief 1, DISINFODEMIC: Deciphering COVID-19
disinformation. United Nation Educational, Scientific and Cultural Organization;
2020.
3. Brennen S, Simon F, Howard P, Nielsen RK. Types, sources, and claims of
COVID-19 misinformation. Reuters Institute; 2020.
4. IFCN. IFCN COVID-19 Misinformation - Poynter, alcohol search; 2021.
Available from: https://www.poynter.org/ifcn-covid-19-misinformation/
page/4/?search_terms=alcohol.
5. Mehrpour O, Sadeghi M. Toll of acute methanol poisoning for preventing
COVID-19. Archives of toxicology. 2020; p. 1.
6. Khan A. Indore Stone Pelting: The inside story of WhatsApp messages and
fearmongering that led to shocking attack on doctors; 2020. Available from:
https://www.freepressjournal.in/india/indore-stone-pelting-the-
inside-story-of-whatsapp-messages-and-fearmongering-that-led-to-
shocking-attack-on-doctors.
7. BBC. Mast fire probe amid 5G coronavirus claims; 2020. Available from:
https://www.bbc.co.uk/news/uk-england-52164358.
8. Shane T, Noel P. Data deficits: why we need to monitor the demand and supply
of information in real time; 2020. Available from:
https://firstdraftnews.org/long-form-article/data-deficits/.
March 12, 2021 18/229. Devlin J, Chang MW, Lee K, Toutanova K. BERT: Pre-training of Deep
Bidirectional Transformers for Language Understanding. In: Proceedings of the
2019 Conference of the North American Chapter of the Association for
Computational Linguistics: Human Language Technologies, Volume 1 (Long and
Short Papers); 2019. p. 4171–4186.
10. Kingma DP, Welling M. Auto-encoding variational bayes. In: Proceedings of the
2nd International Conference on Learning Representations; 2013.
11. Rezende DJ, Mohamed S, Wierstra D. Stochastic Backpropagation and
Approximate Inference in Deep Generative Models. In: International Conference
on Machine Learning; 2014. p. 1278–1286.
12. Miao Y, Yu L, Blunsom P. Neural variational inference for text processing. In:
International conference on machine learning; 2016. p. 1727–1736.
13. Kingma DP, Mohamed S, Rezende DJ, Welling M. Semi-supervised learning with
deep generative models. In: Advances in neural information processing systems;
2014. p. 3581–3589.
14. Miao Y, Grefenstette E, Blunsom P. Discovering discrete latent topics with
neural variational inference. In: Proceedings of the 34th International Conference
on Machine Learning-Volume 70. JMLR. org; 2017. p. 2410–2419.
15. Korshunova I, Xiong H, Fedoryszak M, Theis L. Discriminative Topic Modeling
with Logistic LDA. In: Advances in Neural Information Processing Systems;
2019. p. 6767–6777.
16. Card D, Tan C, Smith NA. Neural Models for Documents with Metadata. In:
Proceedings of the 56th Annual Meeting of the Association for Computational
Linguistics (Volume 1: Long Papers); 2018. p. 2031–2040.
17. Cohen J. A coefficient of agreement for nominal scales. Educational and
psychological measurement. 1960;20(1):37–46.
18. Ding R, Nallapati R, Xiang B. Coherence-Aware Neural Topic Modeling. In:
Proceedings of the 2018 Conference on Empirical Methods in Natural Language
Processing. Brussels, Belgium: Association for Computational Linguistics; 2018.
p. 830–836. Available from: https://www.aclweb.org/anthology/D18-1096.
19. Maas AL, Hannun AY, Ng AY. Rectifier nonlinearities improve neural network
acoustic models. In: Proceeding of International Conference on Machine Learning.
vol. 30; 2013. p. 3.
20. Blei DM, Ng AY, Jordan MI. Latent dirichlet allocation. Journal of machine
Learning research. 2003;3(Jan):993–1022.
21. Wolf T, Debut L, Sanh V, Chaumond J, Delangue C, Moi A, et al.
HuggingFace’s Transformers: State-of-the-art Natural Language Processing.
ArXiv. 2019;abs/1910.03771.
22. Kingma DP, Ba J. Adam: A method for stochastic optimization. In: Proceedings
of the conference paper at the 3rd International Conference for Learning
Representations; 2014.
23. Řehůřek R, Sojka P. Software Framework for Topic Modelling with Large
Corpora. In: Proceedings of the LREC 2010 Workshop on New Challenges for
NLP Frameworks. Valletta, Malta: ELRA; 2010. p. 45–50.
March 12, 2021 19/2224. Abdul-Mageed M, Elmadany A, Pabbi D, Verma K, Lin R. Mega-COV: A
Billion-Scale Dataset of 65 Languages For COVID-19. arXiv preprint
arXiv:200506012. 2020;.
25. Chen E, Lerman K, Ferrara E. Tracking Social Media Discourse About the
COVID-19 Pandemic: Development of a Public Coronavirus Twitter Data Set.
JMIR Public Health and Surveillance. 2020;6(2):e19273.
26. Banda JM, Tekumalla R, Wang G, Yu J, Liu T, Ding Y, et al. A large-scale
COVID-19 Twitter chatter dataset for open scientific research–an international
collaboration. arXiv preprint arXiv:200403688. 2020;.
27. Qazi U, Imran M, Ofli F. GeoCoV19: a dataset of hundreds of millions of
multilingual COVID-19 tweets with location information. SIGSPATIAL Special.
2020;12(1):6–15.
28. Sharma K, Seo S, Meng C, Rambhatla S, Liu Y. COVID-19 on Social Media:
Analyzing Misinformation in Twitter Conversations. arXiv preprint
arXiv:200312309. 2020;.
29. Singh L, Bansal S, Bode L, Budak C, Chi G, Kawintiranon K, et al. A first look
at COVID-19 information and misinformation sharing on Twitter. arXiv preprint
arXiv:200313907. 2020;.
30. Medford RJ, Saleh SN, Sumarsono A, Perl TM, Lehmann CU. An “Infodemic”:
Leveraging High-Volume Twitter Data to Understand Early Public Sentiment for
the COVID-19 Outbreak. In: Open Forum Infectious Diseases; 2020.
31. Zhou X, Mulay A, Ferrara E, Zafarani R. ReCOVery: A Multimodal Repository
for COVID-19 News Credibility Research. arXiv preprint arXiv:200605557. 2020;.
32. Cinelli M, Quattrociocchi W, Galeazzi A, Valensise CM, Brugnoli E, Schmidt AL,
et al. The covid-19 social media infodemic. arXiv preprint arXiv:200305004.
2020;.
33. Kouzy R, Abi Jaoude J, Kraitem A, El Alam MB, Karam B, Adib E, et al.
Coronavirus goes viral: quantifying the COVID-19 misinformation epidemic on
Twitter. Cureus. 2020;12(3).
34. Alam F, Shaar S, Nikolov A, Mubarak H, Martino GDS, Abdelali A, et al.
Fighting the COVID-19 Infodemic: Modeling the Perspective of Journalists,
Fact-Checkers, Social Media Platforms, Policy Makers, and the Society. arXiv
preprint arXiv:200500033. 2020;.
35. WHO. Novel Coronavirus(2019-nCoV) Situation Report - 20. World Health
Organization; 2020.
36. Chen L, Lyu H, Yang T, Wang Y, Luo J. In the eyes of the beholder: Sentiment
and topic analyses on social media use of neutral and controversial terms for
covid-19. arXiv preprint arXiv:200410225. 2020;.
37. Xue J, Chen J, Hu R, Chen C, Zheng C, Zhu T. Twitter discussions and
concerns about COVID-19 pandemic: Twitter data analysis using a machine
learning approach. Journal of Medical Internet Researc. 2020;.
38. Gupta RK, Vishwanath A, Yang Y. Covid-19 twitter dataset with latent topics,
sentiments and emotions attributes. arXiv preprint arXiv:200706954. 2020;.
March 12, 2021 20/22You can also read