CLIMATE RESILIENCE ASSESSMENT - WASTEWATER TREATMENT PLANT, CONVEYANCE UPGRADES, OUTFALL UPGRADES & RESIDUALS HANDLING FACILITY MAY 24, 2019 - pievc
←
→
Page content transcription
If your browser does not render page correctly, please read the page content below

DISTRICT OF TOFINO

CLIMATE RESILIENCE ASSESSMENT
WASTEWATER TREATMENT PLANT, CONVEYANCE
UPGRADES, OUTFALL UPGRADES & RESIDUALS
HANDLING FACILITY

MAY 24, 2019


CLIMATE RESILIENCE
ASSESSMENT
WASTEWATER TREATMENT
PLANT, CONVEYANCE
UPGRADES, OUTFALL
UPGRADES & RESIDUALS
HANDLING FACILITY
DISTRICT OF TOFINO

FINAL

PROJECT NO.: 191-01577-00
DATE: MAY 24, 2019

WSP
5-2114 COLUMBIA AVENUE
ROSSLAND, BC
CANADA V0G 1Y0

T: +1 250 362-5137
F: +1 250 362-5284
WSP.COM
REVISION HISTORY
FIRST ISSUE

May 10, 2019         Issued for Client Review

Prepared by          Prepared by           Prepared by          Reviewed by       Approved By

Carol Campbell       Jean-Philippe Martin, Elise Paré, P.Eng.   Dr. Paul Munday   Elise Paré, P.Eng.
P.Eng.               PhD

REVISION 1

May 24, 2019         Final Submission

Prepared by          Reviewed by           Approved By

Elise Pare P.Eng.    Jean-Philippe Martin, Elise Paré, P.Eng.
                     PhD

CLIMATE RESILIENCE ASSESSMENT                                                                              WSP
Project No. 191-01577-00                                                                               May 2019
DISTRICT OF TOFINO                                                                                       Page i
SIGNATURES

PREPARED BY

 Carol Campbell, MASc, P.Eng.
 Report Author

 Jean-Philippe Martin, PhD
 Climate Change Risk Specialist

APPROVED BY

 Elise Paré, P.Eng.                                                       May, 24, 2019
 Climate Resilience Assessment Qualified
 Professional

WSP Canada Inc prepared this report solely for the use of the intended recipient, DISTRICT OF TOFINO, in accordance with the professional
services agreement. The intended recipient is solely responsible for the disclosure of any information contained in this report. The content and
opinions contained in the present report are based on the observations and/or information available WSP Canada Inc at the time of preparation. If
a third party makes use of, relies on, or makes decisions in accordance with this report, said third party is solely responsible for such use, reliance
or decisions. WSP Canada Inc does not accept responsibility for damages, if any, suffered by any third party as a result of decisions made or actions
taken by said third party based on this report. This limitations statement is considered an integral part of this report.

The original of this digital file will be conserved by WSP Canada Inc. for a period of not less than 10 years. As the digital file transmitted to the
intended recipient is no longer under the control of WSP Canada Inc, its integrity cannot be assured. As such, WSP Canada Inc does not guarantee
any modifications made to this digital file subsequent to its transmission to the intended recipient.

CLIMATE RESILIENCE ASSESSMENT                                                                                                                     WSP
Project No. 191-01577-00                                                                                                                      May 2019
DISTRICT OF TOFINO                                                                                                                              Page ii
CONTRIBUTORS
CLIENT

Manager of Engineering and Public Works   Ricardo Araya

Chief Administrative Officer              Bob MacPherson

WSP

Senior Project Manager/ QP                Elise Paré

Climate Change Risk Specialist            Jean-Phillipe Martin

Quality Assurance                         Dr. Paul Munday

Report Author                             Carol Campbell

Project Design Coordinator                Aline Bennett

Senior Design Engineer/Project Manager    Roger Warren

Project Director                          Al Gibb

CLIMATE RESILIENCE ASSESSMENT                                        WSP
Project No. 191-01577-00                                         May 2019
DISTRICT OF TOFINO                                                Page iii

TABLE OF                        ATTESTATION OF COMPLETENESS ...................... 1

CONTENTS                        EXECUTIVE SUMMARY ........................................... 2
                                Project Overview ........................................................................2
                                Assessment Methodology .........................................................2
                                Risk Assessment ........................................................................2
                                Summary of Findings .................................................................3

                                1          INTRODUCTION ............................................. 4
                                1.1        Background....................................................................4
                                1.2        Approach ........................................................................5
                                1.3        Project Team ..................................................................9

                                2          PROJECT DEFINITION ................................ 10
                                2.1        Infrastructure ...............................................................10
                                2.2        Climate Parameters .....................................................10
                                2.3        Time Horizon ................................................................12
                                2.4        Geography....................................................................12
                                2.5        Jurisdictional Considerations ....................................14
                                2.6        Site Observations ........................................................14

                                3          DATA GATHERING AND SUFFICIENCY ..... 15
                                3.1        Infrastructure Elements ..............................................15
                                3.2        Design Criteria .............................................................19
                                3.3        Summary of Alternatives ............................................23
                                3.4        Time Horizon for the Assessment .............................23
                                3.5        Climate..........................................................................24
                                3.6        Climate Threshold Values ..........................................29
                                3.7        Geography....................................................................30
                                3.8        Jurisdictional Considerations ....................................31

CLIMATE RESILIENCE ASSESSMENT                                                                                                 WSP
Project No. 191-01577-00                                                                                                  May 2019
DISTRICT OF TOFINO                                                                                                         Page iv
4       STEP 3 – RISK ASSESSMENT .................... 34
                                4.1     Risk Tolerance Thresholds ........................................34
                                4.2     Vulnerability Scoring ..................................................35
                                4.3     Risk Profile ...................................................................36
                                4.4     Next Steps and Data Sufficiency ...............................41

                                5       RECOMMENDATIONS & CONCLUSIONS .. 45
                                5.1     Recommendations ......................................................45
                                5.2     Conclusions .................................................................45

                                REFERENCES ........................................................ 47

CLIMATE RESILIENCE ASSESSMENT                                                                                             WSP
Project No. 191-01577-00                                                                                              May 2019
DISTRICT OF TOFINO                                                                                                      Page v
TABLES

                                TABLE 1: CLIMATE VARIABLES AND CLIMATE
                                              RELATED HAZARDS ........................11
                                TABLE 2: SUMMARY OF DESIGN POPULATIONS ....19
                                TABLE 3: FLOW DESIGN CRITERIA ..........................19
                                TABLE 4: EFFLUENT DISCHARGE CRITERIA ..........20
                                TABLE 5: RISK TOLERANCE THRESHOLDS ............34
                                TABLE 6: PROBABILITY AND SEVERITY SCORING
                                              METHOD ...........................................35
                                TABLE 7: CLIMATE/INFRASTRUCTURE
                                              INTERACTION RISK PROFILES ......36
                                TABLE 8: MEDIUM-HIGH RISK INTERACTION
                                              SUMMARY ........................................41
                                TABLE 9: MEDIUM-LOW RISK INTERACTION
                                              SUMMARY ........................................42

                                FIGURES
                                FIGURE 1: PIEVC PROTOCOL PROCESS ..................6
                                FIGURE 2: PROJECT DEFINITION ..............................7
                                FIGURE 3: 3D RENDERING OF PROPOSED
                                              TREATMENT PLANT SITE ...............10
                                FIGURE 4: TOFINO TOWN CENTRE AND
                                              CLAYOQUOT SOUND ......................14
                                FIGURE 5: DATA GATHERING PROCESS ................15
                                FIGURE 6: PROJECT LOCATION .............................18
                                FIGURE 7: CONVEYANCE SYSTEM UPGRADES ....21
                                FIGURE 8: VIEW OF DUFFIN PASSAGE FROM
                                              EXISTING OUTFALL LOCATION ON
                                              LAND .................................................22
                                FIGURE 9: HIGHWAY 4 WASHOUT – DECEMBER
                                              2016*..................................................25
                                FIGURE 10: ESOWISTA PENINSULA TOPOGRAPHY
                                              ...........................................................31

                                APPENDIX A: RISK PROFILES

CLIMATE RESILIENCE ASSESSMENT                                                                                     WSP
Project No. 191-01577-00                                                                                      May 2019
DISTRICT OF TOFINO                                                                                             Page vi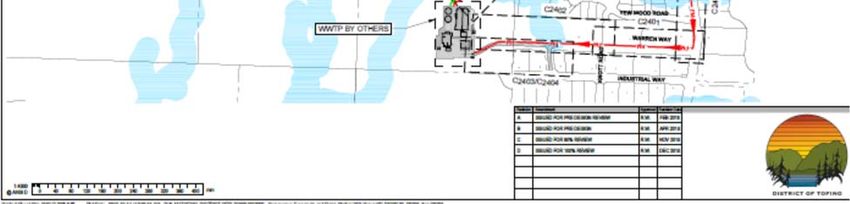
ATTESTATION OF COMPLETENESS
We the undersigned attest that this Resilience Assessment was undertaken using recognized assessment tools and
approaches (Engineers Canada PIEVC Protocol) and complies with the General Guidance and any relevant sector-
specific technical guidance issued by Infrastructure Canada for use under the Climate Lens.

Prepared by:

                                                      Date: May 24, 2019______________
 Elise Paré, P.Eng.

                                                      Date: May 24, 2019______________
 Jean-Philippe Martin, PhD

Validated by:

                                                      Date: May 24, 2019______________
 Elise Paré, P.Eng.
 Engineers and Geoscientists British Columbia
 Member #137337

CLIMATE RESILIENCE ASSESSMENT                                                                                WSP
Project No. 191-01577-00                                                                                 May 2019
DISTRICT OF TOFINO                                                                                         Page 1
EXECUTIVE SUMMARY PROJECT OVERVIEW The District of Tofino is undertaking significant upgrades to their wastewater infrastructure and commissioned WSP to conduct a Climate Lens Assessment for the Project which includes the construction of wastewater treatment plant, conveyance upgrades, outfall upgrades and a residuals handling facility. The Climate Lens Assessment consists of two parts, a Greenhouse Gas (GHG) Mitigation Assessment and a Climate Resilience Assessment. This report provides the Climate Resilience Assessment for the Project. The District of Tofino commissioned the detailed design of the Project following completion of an approved Liquid Waste Management Plan (“LWMP”). Construction and commissioning of the project will meet the federal government’s requirement under the Wastewater Systems Effluent Regulation (“WSER”) for all communities in Canada to implement secondary level treatment by 2020. The Project risk assessment is based on details in the pre- design reports and subsequent detailed design drawings prepared by WSP (formerly Opus International). The plant will be initially designed for the peak wet weather flow, 20-year design horizon to 2040, with available space and pipe capacity for the 40-year design horizon. The new Wastewater Treatment Plant (“WWTP”) includes mechanical screens, grit removal, odour control, oxidation ditches, secondary clarifiers with RAS/WAS pumping, UV disinfection, effluent pump station, enclosed solids handling facilities, emergency backup power, effluent heat recovery for heating and cooling of WWTP buildings, reclaimed water for in plant use, and an administration building. The new ocean outfall structure, residual solids handling facility were included in the assessment. Upgrades to the existing conveyance system include three upgraded pump stations, one new pump station, additional forcemains, and a small length of gravity sewer to convey wastewater to the new WWTP. Only the short new gravity sewer is within the project limits, although a much larger system contributes to the flows. Interaction with sections of the existing conveyance system that could affect the operation of the pumping stations within the Project will be considered under the pumping stations. Other specific existing wastewater infrastructure was limited from the scope of this assessment. Additional infrastructure that is not included in the construction Project, but is directly related to the operation and maintenance of the wastewater treatment plant and associated infrastructure was added to the assessment including the BC Hydro power supply and main access road, Highway 4 into Tofino. ASSESSMENT METHODOLOGY Infrastructure Canada produced the Climate Lens Guidance (2018) document to assist project proponents with the completion of the Climate Lens Assessments with the goal of incorporating climate change resilience into Canadian infrastructure projects and incentivizing behavioural change with respect to climate change. The Public Infrastructure Engineering Vulnerability Committee (PIEVC) Protocol (“Protocol”) developed by Engineers Canada, has been designed to allow consistent and accurate assessments of infrastructure vulnerability to be performed and is an approved methodology for completing Climate Resilience Assessments. Using the five steps laid out in the Protocol, this report will define the potential vulnerabilities of the new wastewater infrastructure and assess how climate change may impact it, provide data to support these definitions and assess the risk associated with the Project. RISK ASSESSMENT The specific infrastructure and climate parameter interactions were identified using the PIEVC protocol Steps One and Two. Historical climate data was reviewed, past extreme climate events researched, and climate change projections developed for the 2050s and 2080s time frames corresponding with the useful life of the infrastructure. CLIMATE RESILIENCE ASSESSMENT WSP Project No. 191-01577-00 May 2019 DISTRICT OF TOFINO Page 2
Infrastructure threshold above which, or below which it was deemed the infrastructure performance could be
affected were developed through professional judgement based on historic events and current design codes and
standards.
Through an initial screening process of potential for climate/infrastructure interactions, the following climate
parameters were carried on to Step three of the Protocol, completion of the risk assessment:
      —    Maximum Daily Precipitation
      —    Drought
      —    Maximum Temperature
      —    Minimum Temperature
      —    Sea Level Rise
      —    Wind - One Hour Max
      —    Wind - Gusts
      —    Heavy Winter Precipitation and High Winds
      —    Flood Construction Reference Plane (relative sea level rise, high tide, estimated wind set up, total storm
           surge and estimated wave effect)
Probability scores were assigned to each parameter representing the likelihood that a specific climate parameter will
change over the time horizon of the assessment such that the infrastructure threshold is triggered. The severity of
each interaction was assigned a value and the resulting risk profiles were calculated.

SUMMARY OF FINDINGS
The assessment applied the best available climate data and projections and historical weather data to assess the
vulnerabilities of the Project to changes in climate and extreme weather for the life of the assets. Control measures
already incorporated into the design or planned operations of the Project were identified and their effectiveness at
mitigating each risk was evaluated in one step based on probability and severity of interactions. The resulting risk
profiles included no high risk interactions (>36), five medium-high risk interactions (30-36), fifteen medium-low
risk interactions (12-29), and twenty-six low risk interactions (
1 INTRODUCTION
1.1 BACKGROUND
1.1.1 CLIMATE LENS ASSESSMENT
The District of Tofino is undertaking significant upgrades to their wastewater infrastructure and have applied to the
Federal Government for financial assistance through the Investing in Canada Program (ICIP). WSP was
commissioned by the District to conduct a Climate Lens Assessment for the project which includes the construction
of wastewater treatment plant, conveyance upgrades, outfall upgrades and a residuals handling facility. The Climate
Lens Assessment was created by Infrastructure Canada to help address climate change impacts and GHG emissions
of infrastructure projects in Canada. By incorporating climate considerations during the planning and design of
infrastructure projects, the Climate Lens is intended to help assess the impact of projects, influence the design
process, and inform funding decisions. The effort is an essential part of the federal and provincial governments’
strategy to achieving Canada’s mid-century goals of a clean growth low-carbon economy and building resilient
communities.
British Columbia and Vancouver Island face unique threats caused by climate change due to the influence of the
Pacific Ocean. These threats include changes in sea level, an increased frequency of extreme weather events and
chronic effects caused by incremental changes in temperature and weather conditions. Given the longevity of
infrastructure projects and the role they play in supporting communities with critical core services, it is important
that these projects are built with the future in mind.
The Climate Lens Assessment consists of two parts:
1 A Greenhouse Gas (GHG) Mitigation Assessment; and
2 A Climate Resilience Assessment
This report provides the Climate Resilience Assessment using Engineers Canada Public Infrastructure Engineering
Vulnerability Committee (“PIEVC”) Protocol (“the Protocol”). This Protocol provides the framework to identify
highly vulnerable infrastructure and facilitate better decision making in both current and future infrastructure
projects.
The objectives of this assessment are to:
1 Review the infrastructure design choices with respect to climate change resilience;
2 Assess risk associated with possible climate change/infrastructure interactions;
3 Recommend resilience measures to be incorporated.
1.1.2 PROJECT OVERVIEW
The Project consists of a new wastewater treatment plant (“WWTP”) and associated infrastructure upgrades for the
District of Tofino in British Columbia, planned for construction in 2019. The project includes the following
components:
1 Secondary wastewater treatment plant;
2 Conveyance system upgrades, including four pump stations;
CLIMATE RESILIENCE ASSESSMENT WSP
Project No. 191-01577-00 May 2019
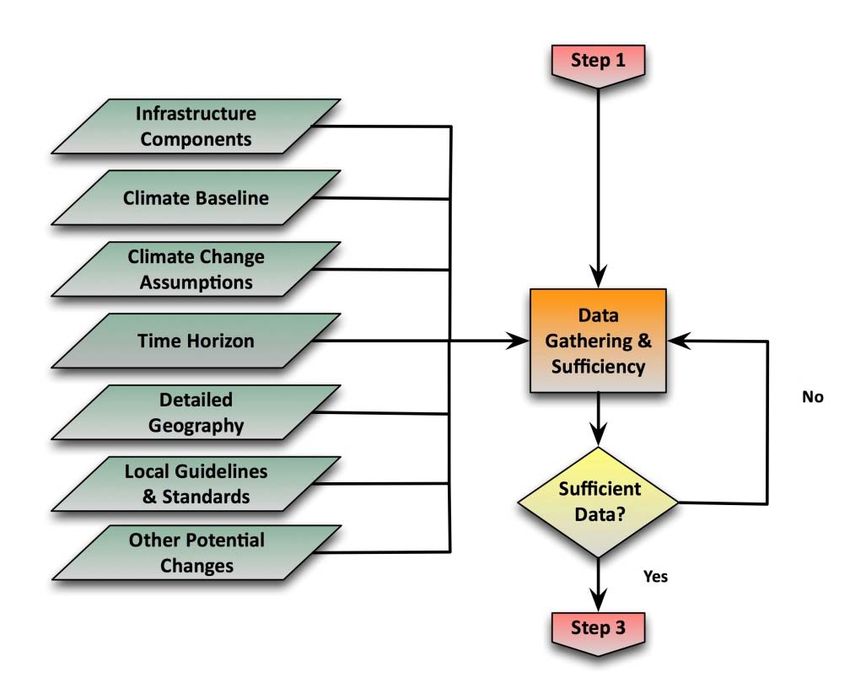
DISTRICT OF TOFINO Page 43 Upgraded ocean sewage outfall; and 4 Residuals handling facility for solid residuals. The District of Tofino commissioned the detailed design of the project following completion of an approved Liquid Waste Management Plan (“LWMP”). Construction and commissioning of the project will meet the federal government’s requirement under the Wastewater Systems Effluent Regulation (“WSER”) for all communities in Canada to implement secondary level treatment by 2020. The Provincial Municipal Wastewater Regulation (MWR) states that plants discharging to shellfish-bearing waters, where decrease in effluent quality could have a significant impact on the receiving environment, should have reliability for key process components to minimize impacts to the receiving environment. The wastewater treatment plant shall be designed to the standards of a Category I plant, with redundant capacity for 75% of the design flow for the secondary treatment process units. The design flow will be considered the maximum month flow and/or maximum month organic load, depending on the process unit. 1.2 APPROACH There are several approaches that meet the Federal Climate Lens requirements for assessing infrastructure risk associated with climate change, which in itself aligns to the ISO 31000 Risk Management Standard, including the PIEVC Protocol. The PIEVC protocol, developed by Engineers Canada, has been designed to allow consistent and accurate assessments of infrastructure vulnerability to be performed and meets the requirements of the Climate Lens Assessment. Using the five steps laid out in the Protocol this report will define the potential vulnerabilities of the new wastewater infrastructure and assess how climate change may impact it, provide data to support these definitions and assess the risk associated with these critical areas. During the LWMP and pre-design stages of the wastewater upgrades, several other options were investigated, and the proposed process was chosen as it was the most robust to changing design parameters including climate change. The process flowchart for the PIEVC Protocol is presented with a brief description of each step in Figure 1. CLIMATE RESILIENCE ASSESSMENT WSP Project No. 191-01577-00 May 2019 DISTRICT OF TOFINO Page 5
Figure 1: PIEVC Protocol Process

      1.2.1 STEP ONE: PROJECT DEFINITION
This first step allows the team to define the boundary conditions for the assessment. A general description of the
infrastructure, location, historic climate, load, age and other relevant factors is provided. Major documents and
information sources are identified.

CLIMATE RESILIENCE ASSESSMENT                                                                                     WSP
Project No. 191-01577-00                                                                                      May 2019
DISTRICT OF TOFINO                                                                                              Page 6
Figure 2: Project Definition
1.2.2 STEP TWO: DATA GATHERING AND SUFFICIENCY
In second step of the process, the team provides an in-depth definition on:
The infrastructure to be assessed, including:
— Breakdown of components
— Locations
— Materials
— Design parameters
— Age
— Physical condition
— Operation and maintenance practices
— Management policies and procedures
— Design guidelines, regulations, insurance considerations and other legal considerations.
— Identification of applicable climate information:
— Historical climate baseline
— Regionally specific climate change projections
— Geography
— Other sources
The data gathering process includes reviewing existing reports, site visits and interviews and discussions with
operators and maintenance staff regarding historical events that may not be documented. Professional judgement of
the team is applied to consider information that is relevant to the scope of the study. It is noted where data is
unavailable, of poor quality or has high levels of uncertainty.
CLIMATE RESILIENCE ASSESSMENT WSP
Project No. 191-01577-00 May 2019
DISTRICT OF TOFINO Page 71.2.3 STEP THREE: RISK ASSESSMENT
The vulnerability assessment component of the Protocol identifies where an interaction, relationship or direct
dependency between an infrastructure component and a climate event exists. By ranking the probability of the
interaction occurring (P) and the severity resulting from the interaction (S), a risk value (R) is calculated.
An initial risk profile was prepared by the assessment team then reviewed with the design team to refine the risk
matrix. The risk tolerance of the Owner and stakeholders was developed through an interview process.
The following procedure was followed to define the severity scores that establish the risk profile:
1 Confirm climate parameters
2 Confirm infrastructure threshold values
3 Confirm climate probability scores
4 Confirm potential cumulative or synergistic events
5 Identify relevant infrastructure responses
6 Complete yes/no analysis for climate/infrastructure interaction
7 Establish interaction severity
8 Calculate risk scores
The team then identifies areas where more information is needed to characterize the risk profile of the interaction. If
professional judgement identifies a potential vulnerability that requires data that is not available to the assessment
team, the protocol requires that the team return to Steps One and Two to gather the required data or perform an
engineering analysis to clarify the risk profile. Further study is typically not required where there is negligible or no
risk. Several of the interactions may be eliminated from further consideration in this step.
1.2.4 STEP FOUR: ENGINEERING ANALYSIS
Where there is potentially high risk and high uncertainty the Engineering Analysis allows the practitioner to assess
the impact of projected climate change loads on the infrastructure and capacity when existing information does not
provide a sufficient basis to evaluate vulnerability. Step Four of the Protocol takes a different perspective on the
interaction and may include a load versus capacity assessment and detailed calculations for direct comparison.
1.2.5 STEP FIVE: RECOMMENDATIONS AND CONCLUSIONS
Based on the results of the previous four steps of the Protocol, the practitioner provides recommendations typically
falling into the following categories:
— Remedial engineering actions to upgrade the infrastructure;
— Monitoring activities and re-evaluation at a later date; and
— Management actions.
The limitations of the vulnerability study will be identified and recommendations for further study will be presented
if required.
CLIMATE RESILIENCE ASSESSMENT WSP
Project No. 191-01577-00 May 2019
DISTRICT OF TOFINO Page 81.3 PROJECT TEAM
Consulting Team - WSP
— Elise Paré, P.Eng – Senior Project Manager
— Jean Phillipe Martin, PhD, Climate Change Risk Specialist
— Dr. Paul Munday, C.Sci, C.WEM, CGeog GIS, Quality Assurance
— Carol Campbell, M.A.Sc., P.Eng., Report Author
— Aline Bennett, M.A.Sc., P.Eng, Design Team Project Coordinator
District of Tofino
— Ricardo Araya, P.Eng., Manager of Engineering and Public Works
— Bob MacPherson, Chief Administrative Officer
— Nyla Attiana, Director of Financial Services
— Keith Orchisto, Emergency Program Coordinator
Project Advisory Team
— Al Gibb, Ph.D., P.Eng., Project Director, Design Team, WSP
— Roger Warren, P.Eng, Project Manager, Design Team, WSP
— Tyler Barber, M.A.Sc., P.Eng, Wastewater Engineer, Design Team, WSP
— Brian Walker, P.Eng.– Conveyance Upgrade Lead Designer, WSP
CLIMATE RESILIENCE ASSESSMENT WSP
Project No. 191-01577-00 May 2019
DISTRICT OF TOFINO Page 92 PROJECT DEFINITION 2.1 INFRASTRUCTURE This climate change risk assessment includes only the new infrastructure proposed in this construction project incorporating the following components: 1 New secondary wastewater treatment plant; 2 Conveyance system upgrades, including 4 pumps stations; 3 Upgraded ocean sewage outfall; and 4 Residuals handling facility for solid residuals. Figure 3: 3D Rendering of Proposed Treatment Plant Site 2.2 CLIMATE PARAMETERS Using relevant guidance, Table 1 summarizes the climate variables and climate related hazards for WWTPs and supporting infrastructure. The identification of hazards has been adapted from the IISD Report on Climate Change Adaptation and Canadian Infrastructure (2013) and Standards Australia (2013). The latter represents a useful guide CLIMATE RESILIENCE ASSESSMENT WSP Project No. 191-01577-00 May 2019 DISTRICT OF TOFINO Page 10
for assessing climate risks within the water and wastewater sector and so it has been adopted here. The resulting
table indicates where the climate carriable or climate related hazard(s) are not relevant to the project. These climate
variables and climate related hazards have been omitted from the analysis.
Table 1: Climate Variables and Climate Related Hazards

                                                                        WWTP AND
CLIMATE                                                                 SUPPORTING
VARIABLE            SENSITIVITY THEME                                   INFRASTRUCTURE

Sea                 Sea Level Rise                                      Relevant

                    Storm Surge and Storm Tide / Tsunami                Relevant

                    Currents and Waves                                  Relevant

Precipitation       Change in annual average rainfall                   Relevant

                    Extreme Rainfall Events                             Relevant

                    Snow and Ice                                        Relevant

Temperature         Changes in annual average temperature               Relevant

                    Extreme temperature events                          Relevant

                    Solar radiation                                     Not Relevant

Wind                Extreme Gusts                                       Relevant

                    Sustained Winds                                     Relevant

                    Cyclones                                            Relevant

Evaporation         Evaporation (effect on Drought)                     Relevant

pH                  Freshwater                                          Not Relevant

                    Marine and estuarine                                Relevant

Soil                Moisture                                            Not Relevant

                    Salinity / pH                                       Not Relevant

                    Stability                                           Not Relevant

CLIMATE RESILIENCE ASSESSMENT                                                                                       WSP
Project No. 191-01577-00                                                                                        May 2019
DISTRICT OF TOFINO                                                                                               Page 11
Based on professional judgement from previous historic events, the following climatic trends which create
infrastructure vulnerability when combined include the following:
— High winds and intense precipitation
— Sea level rise, storm surge, high tides and wave action
2.3 TIME HORIZON
The plant will be initially designed for the 20-year design horizon to 2040, with available space and pipe capacity
for the 40-year design horizon. The following time horizons were developed for the design of each component
(Opus 2018):
— Secondary wastewater treatment plant: 20 years
— Composting facility for solid residuals: 20 years
— Upgraded outfall: 40 years
— Conveyance system upgrades: 40 years
However, the time horizon for the assessment is assumed to be 2080, as the infrastructure is likely to be expanded or
upgraded (equipment replaced) and continue to be used well beyond its initial design capacity.
The treatment process has been selected to comply with the most recent Federal Wastewater Systems Effluent
Regulations (“WSER”) which are potentially subject to changes before 20 years.
The residual composting facility is designed to meet the BC Organic Matter Recycling Regulation (“OMMR”)
requirements which are also potentially subject to changes.
High season catchment population is expected to increase from 6,352 in 2016 to 14,258 in 2060 or 40 years (Opus
WWTP Pre-Design Report 2018, p10).
The time slices for projected climate change model results correspond to typical infrastructure life:
— Near future 2050s (2040-2069) and,
— Distant future 2080s (2070-2100).
2.4 GEOGRAPHY
Tofino is located at the northern end of the Esowista Peninsula of Clayoquot Sound on the west coast of Vancouver
Island as shown in Figure 4. It is located within the traditional lands of the Tla-o-qui-aht First Nation. As well as
being situated next to a national park reserve, Tofino is also part of the Clayoquot Sound UNESCO Biosphere
Reserve, an internationally recognized area that includes terrestrial and marine environments that extends from the
southern boundary of the Long Beach Unit of Pacific Rim National Park Reserve to just north of Estevan Point. The
land based infrastructure components are located at elevations between 7-25 m a.s.l.
The treatment plant location is approximately 1.2 km from the Pacific Ocean to the west and 750 m from Browning
Passage to the east. The climate is classified as Cfb (Oceanic) according to the Köppen classification:
— Monthly mean temperature below 22 °C during the warmest month
— Monthly mean temperature above 0°C during the coldest month
— Precipitation is predominant in the winter months
— Very wet hyper-maritime variant of the coastal western hemlock biogeographic zone
The surficial geology is composed mostly of coastal plain deposits, with the following site specific characteristics:
CLIMATE RESILIENCE ASSESSMENT WSP
Project No. 191-01577-00 May 2019
DISTRICT OF TOFINO Page 12— Secondary wastewater treatment plant: 0.2 m of forested matt, over 1.4 m of organic soil over 2.7-3.6 m
of dense silty sand and gravel till, over bedrock.
— Pump Station 2: 0.5 m soil over bedrock
— Pump Station 1: Layers of gravel and sand to 2.7 m depth, over silty sand and gravel layers to bedrock at
4.5 m
— Pump Station 19: 2.1 m thick fill layer over 0.3 m of very dense sandy silt, bedrock at 2.4 m
— Pump station 4: 0.6 m thick fill layer, 2 m of silt to gravelly sand, 3 m of very dense layers of silty sand,
gravelly sand and sand. No bedrock to 6.1 m.
A treed swamp or wetland located approximately 50 m near the southern boundary of the new WWTP is likely
connected to Tin-Wis Creek and its connecting tributaries during high seasonal groundwater and creek levels. A
constructed berm is present at the east end of the wetland separating it from Industrial Way.
The residuals handling facility for solid residuals is located in a forested area off Alaska Pine Road approximately 2
km inland from the Pacific Ocean at an elevation of approximately 40-45 masl.
The upgraded outfall will extend from Duffin Cove into Duffin Passage. The width of Duffin Passage is between
300-600 m. The diffuser will be located on a rock outcrop extending from Felice Island. The Passage is
characterized as follows:
— Some residual swell propagates from western channels (waves of approximately 2m)
— The shallow water, rocks and islands act to reduce the geomorphological effects
— Discharge is deeper than wave action
— Mixed semi-diurnal tides with a higher high-water value of 4.1 m during high tide
— Wind is predominantly from the south east in Tofino
CLIMATE RESILIENCE ASSESSMENT WSP
Project No. 191-01577-00 May 2019
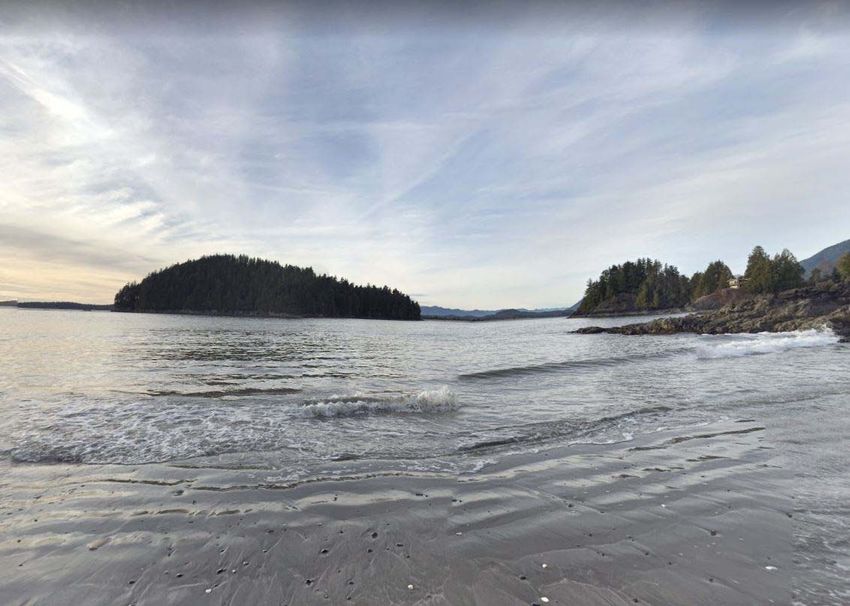
DISTRICT OF TOFINO Page 13Source: gotofino.com
Figure 4: Tofino Town Centre and Clayoquot Sound
2.5 JURISDICTIONAL CONSIDERATIONS
Jurisdictions, laws, regulations, guidelines, and administration processes can affect an organization’s risk tolerance.
The following organizations and levels of government have jurisdiction over the planning, permitting, construction
and operation of the proposed infrastructure.
— District of Tofino
— Alberni-Clayoquot Regional District (ACRD)
— Provincial Ministry of Environment and Climate Change Strategy
— Federal Ministry of Environment and Climate Change (MSER)
— Federal Department of Fisheries and Oceans
— BC Hydro - electricity
— Provincial Ministry of Transportation and Infrastructure
Other project stakeholders include:
— Tla-o-qui-aht First Nation
— Parks Canada
2.6 SITE OBSERVATIONS
No site visit was conducted as part of this study as the new WWTP has not yet been constructed. The various project
locations, proposed treatment plant site and related infrastructure has been inspected numerous times since 2016 by
WSP designers as part of the Liquid Waste Management Planning and design processes. The Climate Resilience
team referred to aerial imagery (5/2/2013-9/11/2016), site photographs (September 2017) and ongoing discussions
with the design team for reference.
CLIMATE RESILIENCE ASSESSMENT WSP
Project No. 191-01577-00 May 2019
DISTRICT OF TOFINO Page 143 DATA GATHERING AND SUFFICIENCY
Step 2 of the Protocol expands on the process started by setting the boundary conditions in Step 1 by further refining
the definitions of the infrastructure components and climate parameters considered in the risk assessment.
Professional judgement is used to determine sufficiency of data as defined by the quality of data, levels of
uncertainty and availability of data. The process is defined below in Figure 5.
The project team identified information and data that would be relevant for the assessment.
Figure 5: Data Gathering Process
3.1 INFRASTRUCTURE ELEMENTS
The infrastructure to be assessed includes a new secondary wastewater treatment plant to serve ~12,000 people for
the 20-year design horizon which includes:
1 New Wastewater Treatment Plant
— Headworks
— Flow measurement
— Clarifiers
— Oxidation ditches
— UV Disinfections
— Solids Dewatering
— Building HVAC system
CLIMATE RESILIENCE ASSESSMENT WSP
Project No. 191-01577-00 May 2019
DISTRICT OF TOFINO Page 15— Power Supply
— Emergency Backup Power
— Communication Systems
2 Conveyance system upgrades, including:
— Three (3) upgraded pump stations
— PS-1 (Main Street), 50 L/s
— PS-2 (Centennial), 15 L/s
— PS-4 (Gas ’N Go), 70 L/s
— One (1) new pump station
— PS-19 (Wharf), 10 L/s
— A 4.6 km forcemain and 0.7 km gravity sewer to convey wastewater to the new WWTP (only the short new
gravity sewer is within the project limits, although a much larger system contributes to the flows).
— Interaction with sections of the existing conveyance system that could affect the operation of the pumping
stations will be considered under the pumping stations. Other existing infrastructure is excluded from this
assessment.
3 An upgraded outfall, designed considering tsunami events and sea level rise.
4 A new Residual Solids Handling Facility to treat solid residuals from the WWTP, to be located at the regional
landfill.
5 Gensets for emergency backup power at treatment plant and pump station.
6 Other Offsite Infrastructure Services
— BC Hydro power supply
— Pacific Rim Highway 4
— Access Road to the plant from Industrial Way
WASTEWATER TREATMENT PLANT
The new Wastewater Treatment Plant includes mechanical screens, grit removal, odour control, oxidation ditches,
secondary clarifiers with RAS/WAS pumping, UV disinfection, effluent pump station, enclosed solids handling
facilities (thickening, centrifuge dewatering, odour control), backup power, effluent heat recovery for heating and
cooling of WWTP buildings, reclaimed water for in plant use, and an administration building (workshop, electrical
room, control room, lab, washing facilities).
The new communication systems will be via a fibre optic network and the existing pump stations will communicate
with the plant SCADA via radio towers.
The final treatment plant site has been proposed at an elevation of 25masl, higher than the predicted tsunami flood
elevation.
CONVEYANCE SYSTEM UPGRADES
The conveyance system modifications include the addition of 5.3 km of new gravity sewer and forcemain to convey
the wastewater to the new WWTP, and to convey the treated effluent to the upgraded outfall. The forcemain will be
250 mm diameter and buried, 1-2 m below grade, crossing of at least three drainage courses, via two bridges and one
culvert. The new gravity sewer runs from PS-1 to the WWTP along Tonquin Trail gravel pathway, and is 1-2 m
below grade.
CLIMATE RESILIENCE ASSESSMENT WSP
Project No. 191-01577-00 May 2019
DISTRICT OF TOFINO Page 16The conveyance system upgrades also include upgrades to Pump Stations #1, #2, #4 and #19. Pump Station #1 is the
Main Street pump station which consists of a pump station building, wet well, duplex pumps, odour control system,
backup generator and public washrooms. Pump Station #2 is located on 1st Street and includes a wet well, duplex
pumps, valve chamber, electrical kiosk, and backup generator. Pump Station #4 is the Gas’n Go pump station and
includes a wet well, duplex pumps, valve chamber, electrical kiosk and backup generator. Pump Station 19 is the new
Wharf Pump Station and includes a wet well, duplex pumps, valve chamber, electrical kiosk and backup generator.
OUTFALL INFRASTRUCTURE
The existing outfall on Cedar street will be replaced with 530 m of 350 mm diameter HDPE pipe with a new diffuser
and emergency overflow port.
RESIDUAL SOLIDS HANDLING FACILITY
The Residual Solids Handling Facility is proposed to include a covered aerated bunker composting facility which will
include a solids receiving area, mechanical screens, an aeration system and a storage area. It will be located at ACRD
West Coast landfill approximately 25 km from the plant.
OTHER OFFSITE INFRASTRUCTURE SERVICES
Additional infrastructure that is not included in the construction project, but is directly related to the operation and
maintenance of the wastewater treatment plant and associated infrastructure was added to the assessment.
— BC Hydro power supply: BC Hydro supplies power to Tofino. A single 69 kV transmission main runs
from Port Alberni to Tofino ending in the Long Beach Substation. A single overhead distribution main line
supplies power to the District of Tofino generally paralleling Highway 4 from the Ucluelet junction to
Tofino.
— Pacific Rim Highway 4 is a 162km windy, paved, two lane highway connecting Tofino to Port Alberni
through Pacific Rim National Park across Vancouver Island’s central mountain range. The section of
Highway 4 adjacent to the Pacific Rim National Park Reserve and Tofino-Long Beach Airport runs very
close to the coast line. The highway is owned and operated by the BC Ministry of Transportation and
Infrastructure.
— Access Road to the plant from Industrial Way: Industrial Way is paved industrial municipal road with curb
and gutter. The proposed access road to the treatment plant site will be paved with asphalt.
These facilities are shown in Figure 6 overleaf.
CLIMATE RESILIENCE ASSESSMENT WSP
Project No. 191-01577-00 May 2019
DISTRICT OF TOFINO Page 17Figure 6: Project Location CLIMATE RESILIENCE ASSESSMENT WSP Project No. 191-01577-00 May 2019 DISTRICT OF TOFINO Page 18
3.2 DESIGN CRITERIA

       3.2.1 WASTEWATER TREATMENT PLANT
Following several years of studies and site investigations, the design criteria for the plant was confirmed in the 2017
Stage 3 LWMP. The population projections have been conservatively forecasted including seasonal tourist
populations based the 2013 Official Community Plan estimates, the 2014 Econics report for seasonal tourist
population and on information provided by the District’s Sustainability Manager on transient populations. (WSP
Stage 3 LWMP April 2019, p28) Given the slower than expected growth in the District population between 2011
and 2016, the projected 2036 population may not be reached until beyond that date. However, it is prudent to plan
for capacity in wastewater facilities that allows a reasonable amount of growth in the community.
Table 2: Summary of Design Populations

                                                  2020          2030            2040             2060
 DESIGN POPULATION

High season (summer) design population:          8,000          9,400           10,800        14,300

Low season (winter) design population            4,000          5,000           6,000         8,500

Table 3: Flow Design Criteria

                                    ADF             ADWF                MMF                MDF             PWWF
SEASON                           (M3/DAY)          (M3/DAY)          (M3/DAY)            (M3/DAY)           (L/S)

High Season

2020                               1,900             1,700              2,300             4,400              87

2030                               2,200             2,000              2,600             5,100              98

2040                               2,500             2,300              3,000             5,700             108

2060                               3,300             2,900              3,900             7,400             134

Low Season

2020                               1,700             1,300              2,100             4,000              92

2030                               2,000             1,500              2,600             4,900             105

2040                               2,400             1,800              3,000             5,800             118

CLIMATE RESILIENCE ASSESSMENT                                                                                         WSP
Project No. 191-01577-00                                                                                          May 2019
DISTRICT OF TOFINO                                                                                                 Page 19
2060 3,300 2,500 4,200 8,200 151
ADF: Average Daily Flow, ADWF: Average Dry Weather Flow, MMF: Maximum Monthly Flow, MDF: Maximum Daily Flow, PWWF: Peak
Wet Weather Flow
In Tofino, the high biological demand season corresponds with the dry season in summer. The future plant capacity
and current underground infrastructure is designed to handle the 2060s low season hydraulic flows, indicating that
the effect of Inflow and Infiltration (I&I) is the governing parameter with respect to peak wet weather flow.
During the pre-design phase, wastewater composite samples were collected and indicate the District has very strong
sewage, with BOD5 concentrations in the order of 400 – 600 mg/L and as high as 700 – 1,000 mg/L. The organic
loading at a wastewater treatment facility is typically based on population and types of commercial and industrial
activity, and the combination of industrial fish processing plant effluent (pre-treated) and a high concentration of
tourist accommodation and restaurants contribute to the high strength effluent.
The wastewater treatment plant will be required to meet the Federal Wastewater Systems Effluent Regulation as part
of the Fisheries Act and the British Columbia Municipal Wastewater Regulation (“MWR”) administered by the BC
Ministry of Environment. The discharge must meet the requirements as listed below in Table 4 below.
Table 4: Effluent Discharge Criteria
PARAMETER DISCHARGE CRITERIA
Annual average not to exceed 25 mg/L, based on quarterly grab
Carbonaceous 5-day Biochemical samples. (WSER)
Oxygen Demand (BOD5) Max day not to exceed 45 mg/L based on monthly grab samples
(MWR)
Annual average not to exceed 25 mg/L, based on quarterly grab
samples. (WSER)
Total Suspended Solids (TSS)
Max day not to exceed 45 mg/L based on monthly grab samples
(MWR)
pH 6-9
14 MPN/100 mL at the edge of the Initial Dilution Zone (IDZ) based
Fecal Coliforms
on 6 samples/year (MWR).may also be affected by winds causing communication outages, and sea level rise and storm surges at PS-19,
potentially resulting in salt water intrusion.
Figure 7: Conveyance System Upgrades
3.2.1 BACKUP POWER GENERATORS
Backup power generators will be provided for all pump stations (12 hour run time) and the wastewater treatment
plant (24 hour run time at 100% capacity) . Wind and precipitation could potentially impact the ability to re-fuel
generators if the single road access to the community is damaged.
CLIMATE RESILIENCE ASSESSMENT WSP
Project No. 191-01577-00 May 2019
DISTRICT OF TOFINO Page 213.2.1 OUTFALL REPLACEMENT
Effluent from the wastewater treatment plant will be discharged via a marine outfall extending from Cedar Street
into Duffin Passage and terminating 70 m offshore of the low water mark at Felice Island, at a depth of 27 mbsl (at
low tide). The proposed discharge will replace two existing discharges located in the same vicinity, but deeper
location. There were very limited options for locating the effluent outfall structure and design modifications have
been implemented to facilitate clearing of sediment build up and overflow events.
Climate parameters that may affect the outfall operation include increased precipitation, and sea level rise or storm
surges.
Source: Peter Howland, March 2018 – Google Earth Streetview
Figure 8: View of Duffin Passage from existing outfall location on land
3.2.2 RESIDUALS HANDLING FACILITY
The Residuals Handling Facility structure will house receiving area, mixing, composting, curing, wood waste and
final product storage areas, and include the following components:
— Vertical auger mixer and output conveyor to blend the biosolids with the bulking agent
— Screener to remove the > 1/2” wood particles during or following the composting process
CLIMATE RESILIENCE ASSESSMENT WSP
Project No. 191-01577-00 May 2019
DISTRICT OF TOFINO Page 22— Aeration systems for the composting process, including aeration blowers, electrical controls, timer and
temperature control over the aeration process.
— Compost turner for the secondary composting process
— Biofilter for odour control from the aerated bunker process
This facility could be impacted by higher temperatures or drought which will impact the composting process or by
storms which could impact access to the community. The facility is covered and protected from precipitation and
flooding.
3.3 SUMMARY OF ALTERNATIVES
During the Phase 1 of the 2016 Liquid Waste Management Planning process, eight possible sites were considered
with respect to social and environmental impacts, and engineering feasibility. The proposed site was confirmed
during Phase 3 of the LWMP process.
Three secondary treatment options were assessed, and preliminary work during the LWMP process identified two
potential sites to be assessed and three treatment options:
— Moving bed biofilm reactor (MBBR);
— Dissolved air flotation (MBBR-DAF);
— Sequencing batch reactor (SBR).
The District selected a racetrack extended aeration process for the secondary treatment at the new wastewater
treatment plant. The racetrack extended aeration process will provide operational simplicity and flexibility, has more
options for sourcing the equipment and the design of the process, are simple to operate with a greater degree of
redundancy, and have the ability to handle varying degrees of loading and settling characteristics to meet the
treatment objectives. The chosen design options and built in redundancy increase the robustness of the treatment
process to changing climate change parameters.
3.4 TIME HORIZON FOR THE ASSESSMENT
The horizon that the infrastructure is designed for is 20 years for the treatment plant, pump station and residuals
handling facility, and 40 years for the outfall, gravity sewers and forcemains, as below.
— WWTP: 20 years (2040s) but:
— Mechanical equipment may need replacement before
— Space is planned for future expansion (50 to 100 year time horizon)
— New pump stations: 20 years (2040s)
— Composting facility for solid residuals: 20 years (2040s)
— Upgraded outfall: 40 years (2060s)
— New forcemains and gravity sewer: 40 years (2060s)
However, the time horizon for the assessment is assumed to be 2080, as the infrastructure is likely to be expanded or
upgraded (equipment replaced) and continue to be used well beyond its initial design capacity/life.
CLIMATE RESILIENCE ASSESSMENT WSP
Project No. 191-01577-00 May 2019
DISTRICT OF TOFINO Page 233.5 CLIMATE
3.5.1 CLIMATE BASELINE
The climate parameters of interest identified in Step one were further assessed and only the parameters associated
with the design, construction and operation of the proposed infrastructure were brought forward for further
consideration.
The following climate baseline parameters were sourced from Government of Canada - Canadian Climate Normals
(1981-2010):
TEMPERATURE
— Extreme Maximum Temperature 32.8°C (August 8, 1981; July 12, 1961);
— Maximum Temperature – defined as number of days over 24°C with respect to the design of the HVAC
components and number of days >30°C for WWTP operations – five to six consecutive days per year
(1981 to 2006)
— No. of days above 30oC: 20 days between 1959 and 2018; four consecutive days in 1981; three
sequences of two consecutive days
— No. of days over five above 24oC: Six days between Aug 6-11, 1981(four days above 30); five days
July 22-26, 1996; five days: July 20-24, 2006 (two days above 30);
— Extreme Minimum Temperature -15 oC (Jan 30, 1969)
— Average Annual Minimum Temperature: -6.4 oC (1960-2018)
PRECIPITATION
— Extreme Daily Rainfall 231mm (PCIC 2018)
— Rainfall rate (60 mm 1-hr event) two-year return period (RP): 46.1 mm/h; five-yr RP: 61.0 mm/h; ten-yr
RP: 70.8 mm/h; 25-yr RP: 83.2 mm/h; 50-yr RP: 92.4 mm/h; 100-yr RP: 101.5 mm/h
— 25% of 30-day average precipitation on average, 53 days / yr will record less than 25% of 30 day average
precipitation
— Extreme Snow Depth 51 cm (February 1, 1969)
— Drought defined as 25% of 30 day average precipitation is currently 53 days per year.
WIND
— Maximum Hourly Wind 132 km/h, December 8, 1976
— Maximum Gust Speed 180 km/h, December 8, 1976
— One Hour Max Wind Speed over 88 km/h: 23 days where it occurred between 1995 and 2018; >100
km/h hourly windspeed occurred five days between 1995 and 2018
— Wind Gusts over 135km/hr Occurred 20 times in a decade during the 1970-1978 period, three times in
1996, and four times in a decade between 2008-2018
SEA LEVEL RISE
— Sea Level Rise: Historical relative sea level rise is a decrease of twelve cm per century (1900-2014) as
the land along the southwest coast of Vancouver Island is rising at about 25 centimetres per century.
CLIMATE RESILIENCE ASSESSMENT WSP
Project No. 191-01577-00 May 2019
DISTRICT OF TOFINO Page 24COMBINED EFFECTS
The climatic trends which are judged to create infrastructure vulnerability when combined are the following:
— High winds and intense (heavy winter) precipitation: 400mm of precipitation over five days combined
with 88km/hr winds
— Sea level rise / extreme storm surge/ wave action:
— the historical storm surge is the January 2018 storm where the La Perouse Bank offshore buoy
recorded waves of 9.5 m. Waves greater than nine m were recorded on five different occasions
between 1991 and 2019. The largest beach incident significant wave heights are approximately five
metres. (Ebbwater 2019)
— Higher High Water Large Tide (HHWLT) and Higher High Water Mean Tide (HHWMT) are 2.0m
and 1.3m respectively (Ebbwater 2019)
— Storm Surge (1979-2018) = 1.05m (Ebbwater 2019)
Past extreme events can be used as analogs to future projected extremes and are invaluable for assessing how
climate change may affect infrastructure vulnerability.
* source https://www.timescolonist.com/news/local/ucluelet-tofino-highway-opens-to-single-lane-traffic-1.3681855 April 18, 2019
Figure 9: Highway 4 Washout – December 2016*
Sources of climate data used in this assessment are the following (all accessed April 9, 2019):
— Government of Canada -Canadian Climate Normals (1981-2010)
— Environment Canada – Historical Weather Data: Tofino A Station
(http://climate.weather.gc.ca/climate_normals/results_1981_2010_e.html?stnID=277&autofwd=1)
— Climate Atlas of Canada – Ucluelet gridpoint (https://climateatlas.ca/)
— Historical Intensity Duration Frequency (IDF) curves - Tofino A Station
CLIMATE RESILIENCE ASSESSMENT WSP
Project No. 191-01577-00 May 2019
DISTRICT OF TOFINO Page 25— Computerized IDF_CC Tool (https://www.idf-cc-uwo.ca/)
— IPCC Report; DFO tide station data for Tofino http://www.isdm-gdsi.gc.ca/isdm-gdsi/twl-
mne/inventory-inventaire/sd-ds-eng.asp?no=8615&user=isdm-gdsi®ion=PAC&ref=maps-cartes
— http://www.dfo-mpo.gc.ca/Library/51639.pdf
— http://www.env.gov.bc.ca/soe/indicators/climate-change/sea-level.html
— Fisheries and Ocean Canada – Wave Data – La Perouse Bank buoy: http://www.meds-sdmm.dfo-
mpo.gc.ca/isdm-gdsi/waves-vagues/data-donnees/data-donnees-eng.asp?medsid=C46206
Data was determined to be sufficient given that quantitative data of good quality was available for historical climate
to set the baseline (e.g. Environment and Climate Change Canada historical weather data).
3.5.2 CLIMATE CHANGE ASSUMPTIONS
Understanding of changes in climate exposure requires analysis of a range of climate projections over the course of
the life span of the proposed infrastructure. The analysis presented here draws strongly from the Pacific Climate
Impacts Consortium (PCIC) downscaled models, provided through the Climate Atlas of Canada and the Ucluelet
dataset. CMIP5 data was used to underpin the findings of the Fifth Assessment Report (AR5) of the
Intergovernmental Panel of Climate change (IPCC). This analysis is also supplemented on literature review.
Climate change models allow to appreciate the extent of change that is projected in given climate variables.
Additionally, the use of ensemble modeling provides uncertainty brackets which can be useful in decision-making
regarding infrastructure management. The reliability of each climate variable was assessed through a critical
analysis of the applicability of statistical downscaling to provide accurate information. The PCIC downscaled data
was derived from 12 CMIP5 global climate models: GCMs: ACCESS1.0, CanESM2, CCSM4, CNRM-CM5,
CSIRO-Mk3-6.0, GFDL-ESM2G, HadGEM2-CC, HadGEM2-LR, INM-CM4, MPI-ESM-LR, MRI-CGCM3, and
MIROC5. It uses baseline data from 1976 to 2005 and provides climate projections for two future time periods:
2021 to 2050 and 2050 to 2100. The resolution of this data is 100km x 100km grids across Canada.
Climate change projections are founded on four scenarios of future GHG concentrations known as Representative
Concentration Pathways (RCPs). These RCPs provide a range of possible trajectories of how global land use and
emissions of GHGs and air pollutants may change throughout the 21st Century. They are named according to their
radiative forcing values (the change in net irradiance in the troposphere due to external drivers) in the year 2100:
2.6, 4.5, 6.0, and 8.5 Wm-2 (IPCC, 2014). Therefore, RCP2.6 represents the least carbon intensive pathway while
RCP8.5 represents the most. While RCP2.6 represents the lowest carbon scenario, it corresponds to a level of
decarbonization which exceeds most ambitious decarbonization scenarios. As a result, RCP8.5 was selected for this
study to best represent exposure in the worst case, business as usual scenario as there is scientific consensus that it
represents the ongoing trend in greenhouse gas emission worldwide. Wherever possible, climate conditions were
projected to both mid-century and end of century timescales to best coincide with the life of the assets.
Climate models also use baseline data as a reference period from which to derive and compare future changes in
climate. Typically, a 30-year period of historic data of the climate variable that is being projected, such as
temperature or precipitation, is used as a means of comparison. The choice of baseline years varies from study to
study, and is largely dependent on the availability of data, data quality and the intended purpose of comparison. This
variability can be seen throughout the section that follows as each unique data source sometimes uses a different
baseline period.
Ideally, climate projection data would be available for years which exactly match the lifespan of the project assets.
However, by using readily available data, the projection data does not always align with the Project assets’ lifetimes
Whenever possible, this assessment adopts mid-century (2050) and end-of-century projections (2100) to match the
intended lifespan of the project’s assets.
Moreover, assumptions about climate change for different climate variables where local information was not
available were extracted from peer-reviewed scientific journal article. In that regard, every climate parameter that
was identified as susceptible to trigger a climate-component interaction was assessed.
CLIMATE RESILIENCE ASSESSMENT WSP
Project No. 191-01577-00 May 2019
DISTRICT OF TOFINO Page 26— IPCC Report; https://www.ipcc.ch/report/2019-refinement-to-the-2006-ipcc-guidelines-for-national-
greenhouse-gas-inventories/
— DFO tide station data for Tofino http://www.isdm-gdsi.gc.ca/isdm-gdsi/twl-mne/inventory-inventaire/sd-
ds-eng.asp?no=8615&user=isdm-gdsi®ion=PAC&ref=maps-cartes
— http://www.dfo-mpo.gc.ca/Library/51639.pdf
Other references used:
— Ebbwater Consulting Inc, Cascadia Coast Research Ltd. (2019). District of Tofino Coastal Flood
Mapping Final Report.
3.5.3 CLIMATE CHANGE PROJECTIONS
MAXIMUM DAILY PRECIPITATION:
Estimates for future maximum daily precipitation were calculated using the IDF_CC tool. This method predicts
future sub-daily rainfall intensities directly from historical sub-daily data and GCM daily maximum data from PCIC,
effectively using a daily to sub-daily ratio of 1.0. The scaling factor was identified by GHD1 in their 2018
assessment for Metro Vancouver as being the most sensitive variable with respect to uncertainty in future
projections, resulting in the underestimation of sub-hourly projections. It is understood that high intensity rain
events will occur more frequently into the 2050s. The return period of 24 hour rainfall greater than 230 mm will
decrease from 100 year (1% Annual Exceedance Probability “AEP”) to 20 years (5% AEP), whereas the maximum
projected 24hour, 1% AEP rainfall amount is estimated at 299mm.
DROUGHT
A slight increase in summer drought condition is projected under RCP8.5 for the period 2050-2069 in western
Canada as inferred by the Standardized Precipitation Index which is the closest index to the Provincial definition of
drought (30 day average precipitation). The increase in interannual variability and skewness trend towards more
frequent drought conditions. A significant increase in drought condition is projected when taking into account
supply (precipitation) vs demand (evaporation). Western North America changes in drought conditions will not be a
product of a change in precipitation as much as a product of a change in evaporation.2
MAXIMUM TEMPERATURE:
Maximum average summer temperature is projected to increase from 17.8 °C to 21.1 °C under RCP8.5 over the
2051-2080 time period. Given the associated increase in average summer temperatures, the number of five-day
periods where temperatures exceed >24 °C will increase accordingly.
Number of days over 30°C will increase from 0.1 day per year to 0.5 day per year under RCP 8.5 over the 2051-
2080 time period. Maximum model outputs project 4 days per year of temperature over 30°C for the same time
horizon. Daily maximum temperatures will also exceed 30°C in that there will be even greater increases at the tail
end of the distribution.
Climate change models allow to appreciate the extent of change that is projected in given climate variables.
Additionally, the use of model ensembles (outputs from multiple models) provides a greater range of uncertainty
1
GHD, (2018) Study of the Impacts of Climate Change on Precipitation and Stormwater Management, Greater Vancouver Sewerage and
Drainage District.
2
Swain, S., & Hayhoe, K. (2015). CMIP5 projected changes in spring and summer drought and wet conditions over North America. Climate
Dynamics, 44(9‐10), 2737‐2750.
CLIMATE RESILIENCE ASSESSMENT WSP
Project No. 191-01577-00 May 2019
DISTRICT OF TOFINO Page 27You can also read