COMMUNITY HOUSING NEEDS REPORT - VILLAGE OF MASSET
←
→
Page content transcription
If your browser does not render page correctly, please read the page content below
VILLAGE OF MASSET
COMMUNITY HOUSING NEEDS REPORT
JULY 2020
© 2020, Village of Masset. All Rights Reserved.
The preparation of this report was carried out by
WCS Engagement + Planning, with assistance from
M’akola Development Services.

Cover photo credit: Guy Kimola

Executive Summary ............................................................................................1
  Population .................................................................................................................................................................1
  Economy ....................................................................................................................................................................1
  Current Housing Stock ...............................................................................................................................................2
  Current Housing Suitability .......................................................................................................................................2
  Current Housing Affordability ...................................................................................................................................3
  Core Need..................................................................................................................................................................3
  Anticipated Housing Demand ...................................................................................................................................4

Introduction........................................................................................................5

Purpose ..............................................................................................................5
  Policy Context............................................................................................................................................................5
  Housing 101...............................................................................................................................................................7
  Methodology .............................................................................................................................................................8

Community Profile ............................................................................................ 10
  About .......................................................................................................................................................................10
  Population and Demographic Context ....................................................................................................................10
  Households Context ................................................................................................................................................13
  Economic Context ...................................................................................................................................................14

Current Housing ................................................................................................ 17
  Dwellings .................................................................................................................................................................17
  Housing Costs ..........................................................................................................................................................21
  Housing Needs and Affordability ............................................................................................................................23
  Supportive Housing Needs and Other Groups ........................................................................................................28
  Housing for New Employees/ Transient Workforce ................................................................................................29

Anticipated Housing Needs (five-year timeframe) ............................................ 30
  Anticipated Population............................................................................................................................................30
  Anticipated Number of Households .......................................................................................................................34

Appendices ....................................................................................................... 39
Executive Summary
Population
• Masset’s population decreased 16% from 940 in 2006 to 793 in 2016, a significant drop when
  compared to the region (8% decrease) and the province (6% increase).
• Estimated future population numbers for Masset are based on and expected to mirror regional
  projections, stabilizing and then growing slightly to 804 residents by 2025.
• Age distribution of Masset’s population is expected to remain relatively constant to 2025, with the
  working age cohort making up between 55-60% of the population and seniors comprising 12-15%.
• Median age in Masset was around 41 in 2006 and 2011, but rose sharply to 46 in 2016 due to a
  decrease in the population largely in the younger cohorts. By 2025, median age is expected to return
  to 41, reflecting the regional median age.

               1000
                900
                                                     10                                                               8
                800
                                                                                                                     101
                700
                                                    135
  Population

                600
                500
                                            450                                                               472
                400
                300
                                                    30                                                                   38
                200
                                                    30                                                                   46
                100
                                                    135                                                              139
                 0
                      2006        2011       2016       2020       2021        2022        2023     2024      2025
                       0-14 years     15-19 years    20-24 years    25-64 years     65-84 years   85+ years

Economy
• Employment in 2016 was at 61% of the working age population, down by 4% from 2006.
• There are 420 job positions in Masset and the six largest employment sectors account for 64% of
  them. These sectors, and related job numbers, are: health care and social assistance (75); public
  administration (45); agriculture, forestry, fishing and hunting (40); construction (40); retail (35); and
  educational services (35).
• Median household income was $60,000 in 2016, which is 8% lower than the household income in the
  region.

                                                                                                                     1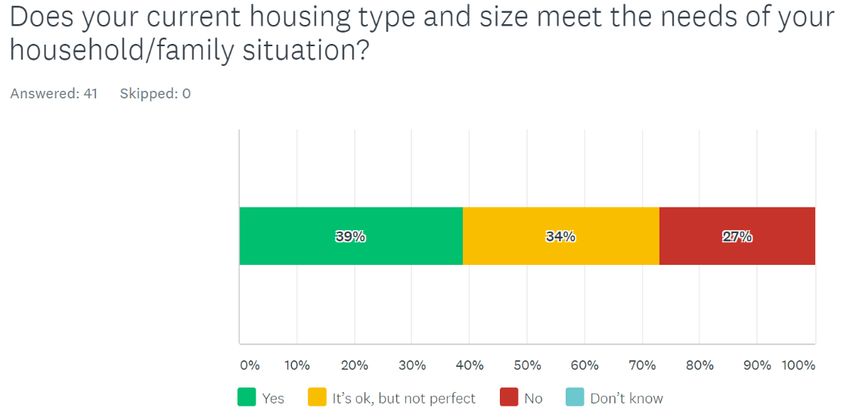
Current Housing Stock
• There are 462 private dwellings in Masset;
  79% of those are considered occupied by                                             Occupied Dwelling Type, 2016
                                                                        Apartment in a building
  permanent residents, and 21% (approx. 100)                          that has fewer than five
  are not utilized full time.                                         storeys, 25
                                                                        Apartment or flat in a
• Despite a very large number of one and two-                         duplex, 10

  person households, most dwellings have three                             Row house, 10
  or more bedrooms.
                                                                                                  Semi-detached
                   “There is plenty of housing inventory                                           house, 95                     Single-
                   to meet current and near future                                                                              detached
                   needs however the problem is many                                                                           house, 230

                   of the homes require substantial
                   repairs and/or small suites added for
                   single people to live.” – Survey
                   respondent

                                                   Household and Housing Size, 2016
                            180                                                     170
                            160
    # of households/units

                            140
                                                     145
                            120   130                      100                                                    95
                            100                                                                                                   2016 Household size
                            80
                                                                                                                                  2016 Dwelling Size
                            60
                            40
                                         10
                                                                             45
                            20
                                                                                                           25                           25
                             0
                                  1 person/1bd      2 persons/2bd          3 persons/3bd              4 persons/4 or more bd        5 or more persons

• Most (84%) of Masset’s housing was built before 1980, with the majority being built between 1961
  and 1980 by the Department of National Defense.
• There are very few beds in Masset for those at risk. Through BC Housing and operated by the Haida
  Gwaii Society for Community Peace, there are 14 ‘units’ for those in assisted living situations (frail
  seniors, special needs, women and children fleeing violence) and six units for independent social
  housing (low income families or seniors). There are no emergency shelter beds, although there are
  some Masset residents who experience homelessness.

Current Housing Suitability
•                   The vast majority (96%) of respondents to the Masset housing survey indicated that their current
                    housing type and size meets their needs or is “okay” given their household/family situation.

                                                                                                                                      2
• 90 households (40 renter and 50 owner) in Masset are in homes requiring major repairs according to
the 2016 Census.
Current Housing Affordability
• Monthly shelter costs 1 overall are increasing in Masset, and the average monthly cost of renting a
home ($780) is higher than the average monthly cost of owning a home ($700). Both owners and
renters with the median household income or higher are more than able to afford the current
median ownership costs and the average costs for all sizes of detached units.
• Average monthly rental prices increased by 23% between 2006 and 2016, from $570 to $700. The
median monthly rent of occupied rental dwellings is $830.
Median Assessment of a Detached Home
$120,000
$106,512
$100,000 $93,646 $93,875
$91,229 $88,977
$80,000
$60,000
$50,365
$40,000
$20,000
$-
2006 2011 2016 2017 2018 2019
Value $50,365 $91,229 $93,646 $93,875 $88,977 $106,512
• For owners, the median assessed value of housing was $106,500 in 2019, an increase of 17% since
2011, and of 111% since 2006. Despite this increase, prices are still relatively low compared to
elsewhere in BC.
• Of the 105 renter and 250 owner householders in Masset, 70 households (30 renter and 45 owner)
are spending 30% or more before tax income on shelter costs. Of these households, 50 (mostly
owners) are spending more than 50% of their income on housing.
Core Need
• Overall, there are 100 Masset households considered to be in “core need” for housing, meaning they
are in housing that doesn’t meet their needs due to affordability challenges, major repairs needed or
inadequate number of rooms for the family size, and they cannot afford alternative housing options
in the community.
1Shelter cost refers to the average or median monthly total of all shelter expenses paid by households that own or rent their
dwelling. Owner costs include mortgage payments, property taxes and condominium fees, along with the costs of electricity,
heat, water and other municipal services. Renter costs include rent, electricity, heat, water and other municipal services.
3Anticipated Housing Demand
• Housing demand will likely stabilize and increase marginally (15 units by 2025) along with the
population and the number of households. Most anticipated demand is expected in 3+ bedroom
units, 2 which aligns with the community survey input and preferences for more rooms despite the
mismatch in household sizes.
• Half of survey respondents indicated that a single detached home will best meet their need in the
next five years. This was reflected across most age groups, including those over 70 years of age.
2Demand projections do not indicate demand for a specific unit type (single-family home, apartment, townhome, etc.), rather a
specific number of bedrooms. Masset may decide to meet this need through a variety of housing types.
4Introduction
Purpose
Municipalities and regional districts in B.C. are required to complete housing needs reports by April
2022, and every five years thereafter. This report, Masset’s Housing Needs Assessment, will help Masset
better understand and respond to housing needs over the next five to ten years.
Policy Context
Masset’s housing needs and future efforts to address them should be considered within the context of
Masset’s Integrated Official Community Plan (IOCP), called Masset2040, which articulates guiding
principles, a vision and broad goals and policies that regulate the seven focus areas below, including
residential areas and housing.
1. Land Use and Natural Areas
2. Residential Areas and Housing
3. Commercial, Industrial and Institutional Areas
4. Infrastructure
5. Recreation, Culture and Learning
6. Individual and Community Health
7. Governance and Capacity
Masset’s Guiding Principles
The guiding principles describe the science-based requirements (or definition) of sustainable
development – what Masset will need to achieve in the very long-term to create a sustainable
community. The guiding principles are embedded within the goals on the next page to ensure they
remain top of mind in decision-making within each focus area.
Sustainability: Meeting the needs of the present without compromising the ability of future generations
to meet their own needs 3, with more clarity articulated by these four, more specific principles:
• Environmental Sustainability: Ensuring ecosystems are healthy by avoiding continuous
encroachment into natural areas, and by reducing and eventually eliminating the ongoing build-
up of synthetic materials, toxins, metals and fossil fuels in nature. (Based on the Natural Step
sustainability principle 1-3);
• Social Sustainability: Being inclusive and free of barriers for all people, so they can meet their
physical and emotional needs, regardless of age, ability, income or ethnicity. (Based on the
Natural Step sustainability principle 4);
3
: Brundtland, G. (1987). Report of the World Commission on Environment and Development: Our Common
Future. United Nations General Assembly document A/42/427.
5• Economic Sustainability: An economic system that is strong, resilient, adaptable and more
localized; one that avoids undermining the social and ecological systems on which it is
dependent;
• Smart Growth: Land use that supports our overall sustainability objectives by prioritizing infill,
redevelopment, and densification strategies, which aim to enhance quality of life, avoid
continuous encroachment into the natural environment, maintain ecological integrity, and save
money over time.
Masset’s Community Vision
Masset’s vision and goals for the future provide the picture of what community members in Masset
want the future to look and be like. Together, the vision and goals provide a compass for discussions and
dialogue about how best to move forward. They are written in the present tense with the intent to place
the reader in 2040.
Our Vision: Masset’s unique location at the north end of Haida Gwaii, the
vastness of the beaches and surrounding oceans, and the Haida culture,
create vibrancy, energy and a sense of freedom that make it a special
place for residents and visitors alike. Residents enjoy a good quality of life
with strong social connections and healthy lifestyles. The community is
welcoming and beautiful, and new residents and small businesses have
been attracted to Masset, while natural areas, beach access, green
spaces and trees have been protected and even enhanced. The well-used
trail system connects neighbourhoods to each other and to places beyond
Masset, making it easy and enjoyable for people to walk and bike around.
The community has the capacity and commitment to achieve its goals,
and contributes to the wellbeing and sustainability of the island’s
environment, economy, and communities. 4
Residential Areas and Housing Goals
1. New housing development has been situated to protect natural areas, green spaces, trees,
views and trails, and uses Village infrastructure and services efficiently.
2. A diversity of housing types meets the needs of community members of all ages, abilities and
incomes.
3. Masset neighbourhoods have retained their quiet, small-town character; they are welcoming,
well-maintained, walkable and safe.
4. Homes are healthy, increasingly energy-efficient, and transitioning to the use of renewable
energy and sustainable materials.
4
Contributing to the wellbeing and sustainability of the island’s environment, economy, and communities is a commitment
made as part of the Protocol Agreement between the Council of the Haida Nation and the Municipalities of Port Clements and
Masset (2004).
6Residential Areas and Housing Policies
Note: Policies from the Land Use and Natural Areas sections must also be referenced.
RESIDENTIAL DEVELOPMENT
1. Adopt an infill approach to new residential development, directing it to undeveloped parcels
and to those marked on the Land Use Map (Map 1) with “Proposed Land Use Changes” and
where the possible transition to residential uses is specified.
2. Consider development incentives in return for providing community amenities.
3. Ensure new development can be accommodated within the capacity of the current
infrastructure system.
HOUSING DIVERSITY
4. Allow and encourage secondary suites to create additional affordable housing options, ensuring
they are registered with the Village of Masset and they comply with applicable zoning and
building codes.
5. Explore avenues to encourage some rental offerings within the supply of single-family detached
homes.
6. Support the development of multi-family housing of different types and tenures, including
smaller options suitable for singles and seniors, and a mix of rental and ownership options.
7. Encourage multi-family development to be located within or close to the commercial core.
8. Support modular homes as an affordable type of single-family housing.
NEIGHBOURHOOD CHARACTER
9. Encourage development and construction that enhances and maintains Masset’s heritage and
character.
10. Consider a second home ownership policy, which may include increased taxation for those who
are not primary residents or not renting the property under a long-term lease agreement.
HOME/BUILDING CONSTRUCTION
11. Encourage the use of green, local and/or healthy building materials and design for new and
renovated buildings, especially the use of energy efficient building design and water
conservation features.
12. Endeavour to use green and healthy building practices in municipal buildings.
Housing 101
The housing continuum model, which has been used around the world for some time, visually describes
the different segments of housing. It suggests a linear progression from homelessness to
homeownership. However, housing needs don’t necessarily follow this linear progression and
homeownership isn’t necessarily the end goal for everyone.
7Source: Canada Mortgage and Housing Corporation
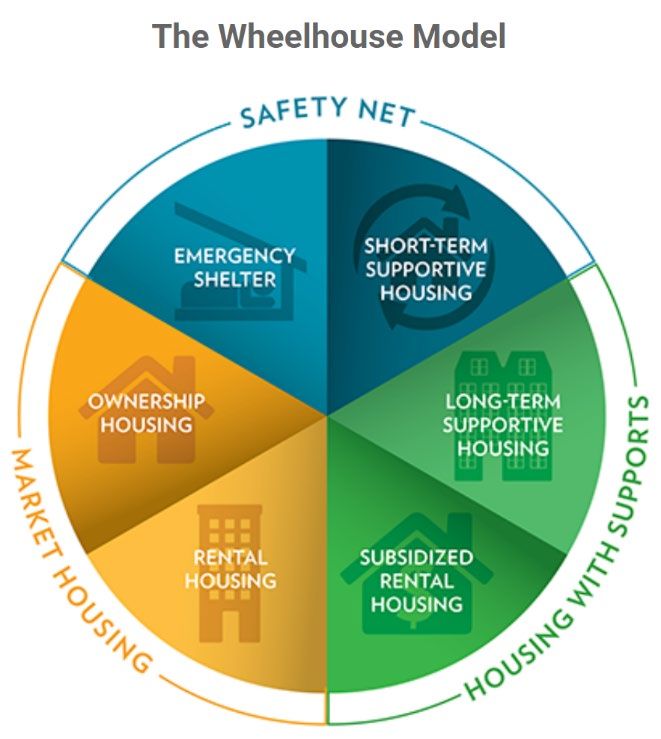
A wheelhouse concept (developed by the City of
Kelowna) is a different way of thinking about
housing. It provides a circular model instead of a
linear one, reflecting the reality that people’s
housing needs are changing as they go through life,
and these changes don’t always occur in a straight
line ‘forward’. Most importantly, it de-emphasizes
homeownership in favour of a more diverse and
evolving approach.
Whichever model is used, what’s critical is that a
healthy housing stock in a community should ideally
include a variety of housing forms and tenures, in
order to meet the diverse needs of residents from
different socio-economic backgrounds and as they
move through every stage of their lives.
Methodology
In order to estimate current and anticipated housing needs for the Village of Masset, demographic and
housing data was reviewed and analyzed from a variety of government data sources such as BC Statistics
and Statistics Canada. Much of this data was drawn from custom tables provided by the Ministry of
Municipal Affairs and Housing. Due to the smaller population, the full suite of government agency
housing data was not available. To supplement the data, the following was undertaken: a community
housing survey; conversations with municipal staff and elected officials; internet research; and
stakeholder interviews and discussions. The community survey had a large response with 196
respondents and good mix of age demographics.
Projection Methodology
To determine future needs, communities rely on projections of population and anticipated household
demand. A well-constructed projection can give stakeholders and decision-makers an idea of where to
allocate resources, what issues to prioritize, and what the future might look like.
To fulfil the requirements of British Columbia’s Housing Needs Reports legislation, the province requires
two core projections be undertaken. First, a projection of population from 2020 to 2025 with
breakdowns of different age cohorts and special consideration of cohorts that may be growing or
diminishing. Second, a projection of household demand with breakdowns of different unit types by
number of bedrooms.
To help communities through the projection process, the Province has commissioned a specialized
projection dataset that is available through the Statistics BC website. However, the dataset is only
available on a regional level and is not granular enough to offer meaningful information for the Village of
Masset. To meet the requirements of the Province, a set of projection data, specific to Masset, had to be
developed.
Population projections are typically developed using two main modelling techniques:
1. The Cohort Survival Method
8Population projections use the Cohort Survival Method to anticipate growth every five years
until the chosen cut-off period using historical birth, mortality, and migration rates. Essentially,
each five-year cohort is given a coefficient representing the number of members of the cohort
who are likely to die or give birth during any given period. 5 This data is supplemented with
immigration and emigration data. The Cohort Survival Method is generally considered to be the
most accurate method when working with larger populations and is the method used by the
Province to construct regional projections.
2. Constant Share Method
Constant share is typically applied to smaller populations and relies on a well-constructed
Cohort Survival Method projection to work properly. The constant share technique assumes that
a smaller community will make up a consistent proportion of a larger population and that it will
broadly follow the same growth or decline trends.
The Constant Share Method is the projection model used to project the population and anticipated
number of households for Masset. Over the past three Census periods, Masset has made up an average
of 4% of the population of the North Coast Regional District (NCRD), never varying by more than 0.2%
from the number. Assuming the proportion will remain at 4%, the model can project population and
total household demand with relative accuracy. Demand by unit size is projected by analyzing the
historical share of the housing stock that each unit type occupies and assuming that those trends will
continue. For example, if the proportion of 2-bedroom units grew at a rate of 2% per year from 2006 to
2016, the model assumes that trend will continue from 2020 to 2025.
Like any projection exercise, results become less accurate over longer periods. These methods assume
the Village of Masset will remain in a constant state economically, socially, and environmentally. In
reality, population and household demand for housing can change constantly due to local, regional, and
wider influences. This housing needs assessment should be one tool in a complete toolbox. Engagement
and anecdotal information can be just as important when determining how to meet community needs
moving forward.
Statistics Canada Data Limitations
Data reported here was provided by Statistics Canada. Statistics Canada data rounds to the nearest five
in its data sets, which creates different rounding results when data is combined and when cross
tabulations are undertaken for analysis. Due to methodological changes for the 2011 Census, many
comparisons can only be made between 2006 and 2016. Finally, census data for incomes and housing
costs are for 2015, though reported as 2016 Census data.
Total population and household reporting data are collected through the Short Form Census, distributed
to 100% of Canadian households, so the data has a high degree of accuracy. Data for renter and owner
populations and information on housing unit size (number of bedrooms) rely on the Long Form Census,
which is only distributed to 25% of households, making it less accurate. Also, as a result, the data for
renters, owners and housing unit size may not always add up perfectly.
5
Each coefficient determines how many members will make it to the next cohort and how many new members
will be added to the 0-5 cohort. Younger cohorts typically have a coefficient of around 1 as they have high survival
rates, but low birth rates. Middle-age cohorts tend to have a coefficient of greater than 1 as they have high survival
rates and high birth rates. Older cohorts tend to have a coefficient of less than one as they have lower survival
rates and low birth rates.
9Community Profile
About
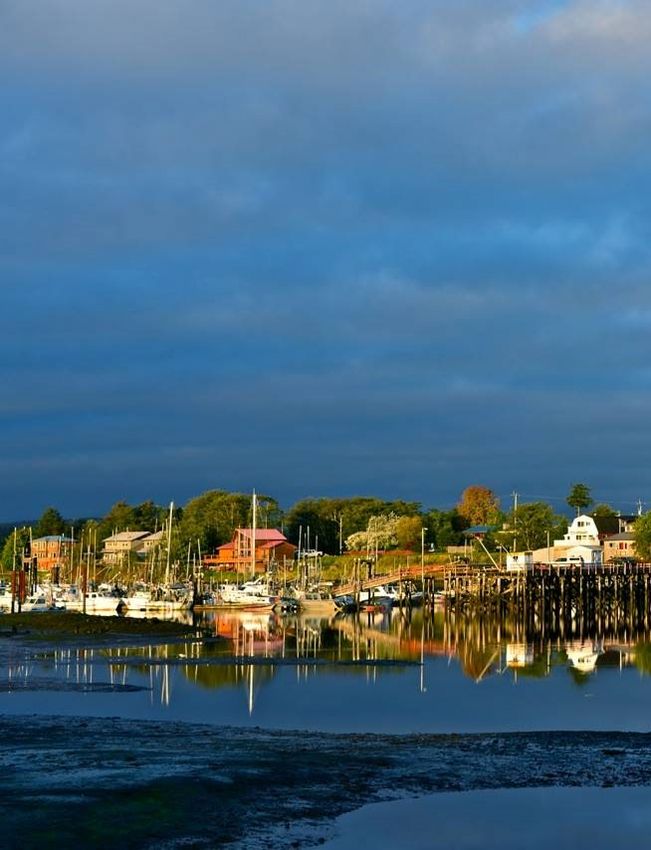
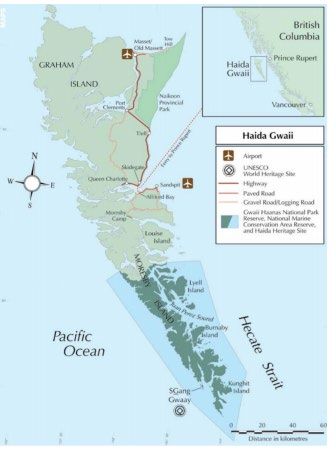
The Village of Masset is located at the north end
of the islands of Haida Gwaii, which is located 100
kilometers west off the northern coast of British
Columbia, Canada. Made up of over 200 islands
large and small, Haida Gwaii covers an area of
approximately 1,000,000 hectares and has a
population close to 5,000 residents. Masset is the
largest and oldest municipality, and Graham Island
is the largest and northern most island in the
archipelago. Haida Gwaii is part of the North Coast
Regional District (NCRD).
Incorporated in 1961, Masset’s population was
793 in 2016, yet the Village provides amenities
and services to a larger rural area with a
population nearing 2,300, including the
unincorporated area of Tow Hill (539) and Old
Massett (IR) (555). Masset has many amenities to
support residents and visitors alike, including an
airport, grocery stores, library, elementary school,
high school, post office, taxi service, liquor store, a
marina, sea-plane base, visitor accommodation,
restaurants, recreation programming, social
services, museum, church, and access to amazing
outdoor recreation.
Masset’s closest neighbour is the Haida community of Old Massett, positioned at the entrance to
Masset Inlet and home to 614 residents (2011 Census). It has a number of Haida cultural facilities, an
elementary school, art gallery and houses the Council of the Haida Nation offices. The unincorporated
area of Tow Hill is also close to Masset and it spreads out along the northwestern boundary of Naikoon
Provincial Park. Recent developments on private lands within the Park boundaries have increased the
number of people moving to the area.
Population and Demographic Context
Population
According to Statistics Canada, the total population for the Village of Masset was 793 in 2016, which was
a 16% decrease from 940 in 2006 as shown in Figure 1. This decrease builds on a general downward
trend from 2001, and is also reflected in the decrease in School District (SD) 50 secondary/elementary
school enrolment from 362 to 148 between 2004 and 2019 6. The enrolment shift from SD50 schools to
6
https://catalogue.data.gov.bc.ca/dataset/bc-schools-student-enrolment-and-fte-by-grade/resource/35b9a70d-
0dc0-4b9e-975e-4719cf673b02
10the Old Massett School Chief Matthews doesn’t account for the entire decrease experienced at the
SD50 schools and therefore is related to overall population decreases.
• This decline is significant when compared to the 8% population decrease in the Skeena-Queen
Charlotte Regional District (now called North Coast Regional District) and the provincial
population increase of 5.6%.
• The population of the neighbouring Old Massett (Masset 1) Indian Reservation decreased by
20% from 2006 to 2016, down to 555 residents. About half of that decrease was experienced
between 2011 and 2016.
Total Population
1,000 940
900
793
800
700
600
500
400
300
200
100
0
2006 2016
Figure 1: Population 2006-2016 Census
Age
Median age
The population of the Village is slightly older than that of the region. Masset’s median age is 46, which is
slightly older than the median age in the Regional District of 41.5, and provincial median age of 43.
• Homeowners (median age of 55 years) tend to be older than renters (median age 29 years) in
2016.
• Masset is getting older, as the median age of residents in Masset increased quite dramatically
between 2006 and 2016.
11Median Age 2006-2016
60
50 46
41
40
30
20
10
0
2006 2016
Figure 2 Median Age of whole Masset population, 2006-2016 Census
Age distribution
Those aged 0-14 years of age make up 17% of the population and those aged 65 and over make up 18%
of the population. Those aged 65 and over make up a larger proportion of the population than they did
in 2006.
Age Distribution
1,000
900
800
700
600
500 2016
515
2006
400
300
200
100 135 145
0
0 to 14 years 15 to 64 years 65 years and over
Figure 3 Age Distribution, 2006-2016 Census
12Households Context
Number of households
• The number of households is decreasing; in 2016, there were 370 private households in the
Village of Masset, which is down 55 households (13%) from 425 in 2006.
Household size
• The average household size has decreased slightly; in 2016, the average household size in
Masset was 2.1 compared to 2.2 in 2006, and is lower than the North Coast Regional District
average of 2.4.
• At 1.8, the average household size of owner households was about a third the size (or one
person smaller) of the renter household (2.7 persons) in 2016. Owner households have
decreased in size compared to 2006, whereas renter households have increased in size since
that time.
• A large majority of households are one or two-person households.
Household Size 2016
160
140
145
120 130
100
80
60
40
45
20
25 25
0
1 person 2 persons 3 persons 4 persons 5 or more
persons
Household tenure
• Of the 370 households in 2016, 260 (70%) are owner households, and 105 (30%) are renter
households. This distribution is about the same as in 2006, and leans more toward ownership
than in the region (65% owner households) and province (68% owner households).
13Economic Context
Unemployment and participation rate
In 2016, 61% (405) of the population 15 years of age and over were employed with 63% (415) employed
or looking for work. The employment rate is higher than in the Regional District, which has an
employment rate of 58%.
• Participation in the economy has slowed as those employed or looking for work in Masset
dropped by 4% from 2006.
• Renters, more so than owners, participate in the economy with employment rates in 2016 of
74% and 55% respectively.
Number of workers by industry
The six largest employment sectors in Masset account for 64% of the 420 job positions. The employment
sectors for those living in Masset include a mix of service and industry jobs, with service sectors
dominated by health and public administration jobs. See Table 1.
Table 1 Employment, 2016 Census
Village of Masset North Coast Regional District
Sector Rank # % Sector Rank %
Health care and social Transportation and
assistance 1 75 18% warehousing 1 14%
Public administration 2 45 11% Retail trade 2 11%
Agriculture, forestry, Health care and social
fishing and hunting 3 40 10% assistance 2 11%
Construction 3 40 10% Public administration 3 10%
Accommodation and
Retail trade 4 35 8% food services 4 8%
Educational services 4 35 8% Educational services 5 7%
Since 2006 there was an overall reduction in the workforce with a relatively large decline in education
jobs from 90 to 35 and manufacturing jobs from 55 to 20. However, health care and social assistance
jobs increased from 30 to 75 in 2016, likely due to the new hospital.
Place of work
There was a similar proportion of Masset’s labour force commuting 7 from home to a place of work in
2016 as in 2006. Almost all commuters work in either the Village or Old Massett. However, the
proportion of Masset’s labour force working within the Village dropped from 2006 to 2016, and the
proportion of workers commuting to neighbouring Old Massett increased over this same period.
7
Commuting refers to the travel of a person between his or her place of residence and his or her usual place of
work.
14Table 2 Commuting flow, Census 2016
Village of Masset 2006 2016
Total - Labour force population aged 15 years and over 520 420
Commuters with a fixed place of work 360 285
Percentage commuting to a fixed place of work 69% 68%
Commute within the Village of Masset 63% 49%
Commute to a different area with the immediate region 5% 18%
• Those who commute to a fixed place of work in the Village of Masset from out of town consist
of about 70 workers from the greater Skeena-Queen Charlotte Census Division (D) and 80 from
the Old Massett (Masset 1) Indian Reservation.
• Given the proximity of the Village and Old Massett it is understandable that the labour force
commutes back and forth; however, the 70 workers commuting into the Village from elsewhere
indicates there is a housing or lifestyle opportunity outside of Masset that is attracting people to
areas outside of Masset – a theory that was supported by the stakeholder interviews.
Household income
The 2016 median household income of $59,950 in Masset is about 8% lower than the North Coast
region household income of $64,700 8.
• Median household incomes in 2016 dollars trended upwards by 18% from 2006 to 2016,
primarily due to increases in renters’ incomes.
• Owner households’ median income of $54,000 in 2016 was 25% greater than renters’ median
income of $43,150 as shown in Figure 4 and Table 3.
Table 3 Household Income all, adjusted to 2015, 2006-2016 Census
Household Income 2006 2016
Median total household income - all $ 50,800 $ 59,950
Median total household income - owners $ 54,200 $ 54,000
Median total household income - renters $ 32,800 $ 43,150
Median income of one person
households – with no family $ 34,550
Median income of two-or-more person
households $ 78,350
8
Census Profile results, not from the BC Stats Data Set.
15Median Income of Households
2006-2016 Census
$60,000
$54,194 $54,005
$50,000
$43,144
$40,000
$32,819
$30,000
$20,000
$10,000
$0
2006 renter 2006 Owner 2016 renter 2016 Owner
Figure 4 Household Income, renter/ owner adjusted to 2015, 2006-2016 Census
• There is a disparity in income between owners and renters as displayed in Figure 5. Compared
to owners, a much higher percentage of renters have household incomes below $35,000. The
difference in household incomes cannot be explained by household size differences as a greater
percentage of owner households (42%) are made up of one-person households, vs. 19% in
renter households.
Household Income Distribution
2006-2016 Census
100%
40 15
90%
80% 20
55
70%
60% 30
95
50%
40%
30% 35
20%
55
10%
0%
Owner Renter
$34,999 and Under $35,000-$69,999 $70,000-$99,000 $100,000+
Figure 5 Household income distribution, Renters and Owners 2016 Census
16In 2016, the median income of a single person living alone was $34,550 and for two or more person
households it was $78,336. Lone parent households have significantly less income than couples with
kids. See Figure 7.
Median Incomes by Household Type (2016)
Couple with kids (70) $93,696
Couple without kids (115) $80,384
All households (370) $59,968
Lone parent (25) $36,992
Single not in families (170) $34,560
Figure 6 Median Incomes by Household Type, Census 2016
Current Housing
This section of the document summarizes information on Masset dwellings, housing stock, market
values and affordability, core housing need indicators, as well as other types of housing. Most of the
data in this section is taken from Statistics Canada Census program data. It is processed and organized
along the same lines as the custom information delivered to the BC Ministry of Municipal Affairs (direct
census data is used where significant differences exist). Other sources include BC Assessment data and
interview findings.
Dwellings
Statistics Canada collects data on private dwellings occupied by “usual residents”, which means
dwellings occupied on a permanent basis.
Dwellings and Structural Type
There are 462 private dwellings in Masset; 79% of those are considered occupied by usual permanent
residents and 21% 9 (approx. 100) are not utilized permanently. Interviews confirmed that many of those
100 homes are vacation homes used by owners, vacant homes that go unused, or dwellings used for
short-term vacation rentals (i.e. rental for less than 30 days). Summer rental prices make it attractive
for owners to keep units solely for this purpose.
Of the 365 occupied dwellings, almost two thirds (63%, 230) are single detached dwellings. By
comparison, the provincial composition of single detached dwellings is only 44%. Compared to other
small communities, Masset has a lower percentage of detached homes. This is likely due to the large
number of semi-detached (duplex) buildings constructed by the military between 1961 and 1980.
9
Tofino is 27%, North Coast Regional District is 24%.
17Apartment in a Occupied Dwelling Type, 2016
building that has
fewer than five
storeys, 25
Apartment or
flat in a duplex, 10
Row house, 10
Semi-detached
house, 95 Single-
detached house,
230
Figure 7 Occupied Dwelling Type
“Other dwellings” make up 36% of all occupied dwellings and include duplexes (semi-detached houses),
apartments or flats in a duplex (may include secondary suites), row houses, and apartments in buildings
fewer than five storeys.
In Masset, 77% of owners live in single detached dwellings, whereas only 29% of the 105 renter
households live in this type of housing.
Owner Dwelling Types, 2016 Renter Dwelling Types, 2016
Other
attached Single-
dwelling, 60 Other detached
attached house, 30
Single- dwelling, 80
detached
house, 200
Figure 8 Dwelling Types by Tenure
The breakdown of housing types is essentially unchanged for owners between 2006 and 2016; however,
there is now a lower percentage of renters living in single detached homes, 29% in 2016 vs. 41% in 2006.
18As noted earlier, the homes constructed by the military in Masset had a large influence on the style of
housing, creating a housing stock that is fairly homogenous.
Number of Bedrooms
Despite a very large number of one and two-person households, most occupied dwellings have three or
more bedrooms. There is potentially a mismatch between housing needs and housing supply and
perhaps an opportunity to better meet community housing needs by better aligning dwellings and
households based on size.
Household and Housing Size, 2016
180 170
160
140
145
# of households/units
120 130
100
100 95
2016 Household size
80
2016 Dwelling Size
60
40
45
20 10 25 25
0
1 person/1bd 2 persons/2bd 3 persons/3bd 4 persons/4 or more 5 or more persons
bd
Figure 9 Comparison of the number of households by size to the number of dwellings by size people
Period of Construction
A high concentration of the occupied dwellings in the community were built before 1980 with the bulk
(up to 190) constructed between 1961 and 1980 to house military staff. See Table 4.
Table 4 Dwelling Age, Census 2016
2016 # 2016 %
Dwelling Age
All All
1960 or before 60 16%
1961 to 1980 240 66%
1981 to 1990 30 8%
1991 to 2000 10 3%
2001 to 2005 10 3%
2006 to 2010 20 5%
2011 to 2016 0 16%
19There have only been two housing starts since 2016, one in 2018 and one in 2019; both are single family
detached homes. There is no new development planning for the Village of Masset; however, the
neighbouring Old Massett (Masset 1) Indian Reservation may have some funding for affordable housing
that could add supply and reduce local demand.
Secondary Suites
There are very few secondary suites in Masset, yet the OCP encourages suites as a way to create
additional affordable housing options.
Supportive and Social Housing
There are very few beds in Masset for those at risk. Through BC The one-storey wood-frame Nick Grosse
Housing 10 there are 14 units for those in assisted living situations assisted living development is adjacent to the
(frail seniors, special needs, women and children fleeing violence) new Haida Gwaii Hospital and Health Centre
and six units for independent social housing (low income families that officially opened in October 2008. The
or seniors). These BC Housing supported units are located among: four assisted living homes are funded under
Independent Living BC (ILBC), an innovative
1) The Tlaa Juuhldaa Naay Transition House (assisted living), which housing-for-health program that provides
is for women and their dependents fleeing abuse. It has six housing for seniors and people with
disabilities.
bedrooms that can each accommodate one adult and up to two
children (the kitchen, bathroom, laundry and living room are Residents pay 70 per cent of their after-tax
shared spaces). This facility serves all of Haida Gwaii and the income for their units and services, which
basement is used for overflow; include two meals per day, weekly
housekeeping and linen services, 24-hour
2) Nick Grosse Assisted Living, which is a one-story building with response, personal care services, and social
four apartments that has access to subsidized assisted living and recreational opportunities. The Village of
units 11; Masset is providing land equity valued at
$20,000 and Northern Health will provide
3) Masset Heritage Housing 12, which is a retirement home with six funding for full personal care and some
one-bedroom units that offers residents independent living options hospitality services.
as well as a variety of amenities and services. It is currently https://archive.news.gov.bc.ca/releases/news_rele
ases_2005-2009/2009HSD0075-000887.htm
providing housing for individuals over 55 years with mental health
issues, and;
4) Northern Health Family Care Home (assisted living, placement with a family), which is currently used
for those who require care. It is not; however, the right environment for those with special needs. 13
While some Masset residents are without housing, there are no emergency shelters or programs to
assist them.
10
BC Housing only tracks units where it has a financial relationship. There may be other subsidized housing units
in the community. BC Housing’s ‘Housing Continuum’ reports are based on ‘units’ ( housing units, beds, spaces and
rent supplements, depending on each program) and do not report on the number of ‘people’ assisted.
11
https://www2.gov.bc.ca/gov/content/health/accessing-health-care/home-community-care/care-options-and-
cost/assisted-living
12
https://www.bchousing.org/publications/Zone-10-Seniors-and-Adults-with-Disabilities.pdf
13
Interviews
20Housing Costs
Rental and Owner Costs
Renters’ monthly shelter costs are higher than monthly costs for owners.
• The most recent census data (2016) shows an average monthly rental shelter cost of $778.
Ownership shelter costs of $703 per month are lower than rental shelter costs. While data does
exist for owned homes, there is little in the way of (recent) data sources for rental shelter costs
or methodologies for estimating more recent rental costs. A website search discovered two 1.5-
bedroom duplex units being offered for rent at $700 per month. Rental rate information was
also collected through interviews, suggesting that $700 is a typical monthly rental price for a
two-bedroom, and that the cost of a three-bedroom home ranges from $900 and $1300,
depending on upgrades. There are very few one-bedroom units in the community 14
Table 5 Shelter Costs 2006, 2016, - 2015 constant dollars, Census 2006-2016
2006 2016
All
Average monthly shelter cost
$594 $725
Average shelter-cost-to-income ratio 0.17 0.19
Renter – 105 Dwellings
Average monthly shelter cost $639 $778
Average shelter-cost-to-income ratio 0.22 0.22
Owner – 260 Dwellings
Average monthly shelter cost $573 $703
Average shelter-cost-to-income ratio 0.15 0.17
• The 2016 shelter cost to income ratio 15 for renters was 0.22, about the same as in 2006. For
owners, the cost-to-income ratio was 0.17; an increase from 2006.
• While rental and ownership shelter costs are lower in Masset than in the Regional District, the
shelter cost-to-income ratios are similar due to corresponding lower income in Masset.
Ownership – Assessed Values
The median assessed value for a residential home in Masset in 2019 was $106,512. This recent value
represents an increase of 17% since 2011 and 111% since 2006. See Figure 10.
14
https://realestate.mitula.ca/for-rent-duplexes-masset
15
Census Canada– annual cost of housing divided by annual household income.
21Median Assessment of a Detached Home
$120,000
$106,512
$100,000 $91,229 $93,646 $93,875
$88,977
$80,000
$60,000 $50,365
$40,000
$20,000
$-
2006 2011 2016 2017 2018 2019
Value $50,365 $91,229 $93,646 $93,875 $88,977 $106,512
Figure 10 Median Assessment, BC Assessment 2011-2019
Despite the increase in assessed value, all dwelling types are assessed at relatively low values compared
to other BC communities (see Table 6). The value of the dwelling types is determined by the dwelling
ownership structure (strata vs. freehold) rather than the number of rooms in the dwelling.
Table 6 Average Value, BC Assessment 2019
Number of Units Average Assessed Value
Total (all property sizes)
Residential (Single Detached) 254 $ 135,634.00
Other 202 $ 80,139.00
One-bedroom
Residential (Single Detached) 12 $ 103,125.00
Other 6 $ 119,617.00
Two-bedroom
Residential (Single Detached) 39 $ 101,305.00
Other* includes manufactured homes 43 $ 31,802.00
Three-Bedroom+
Residential (Single Detached) 203 $ 144,151.00
Other 153 $ 92,176.00
Home Sales
Sales of dwellings in Masset are generally handled by the very few real estate agents on the island;
whereas in the past, private sales were the main manner of exchange. Sales have increased over the
past two years and purchasers are currently made up of retirees (50%) and local residents shifting
around in the existing housing stock. There have not been many new homes built in the Village recently,
22but of those that have been built, the large majority have been built by retirees moving to the area from
elsewhere. There is little demand for condo/townhouse purchases. 16
Housing Needs and Affordability
Rental Housing Affordability
Affordable housing is considered housing where the shelter costs that are 30% or less of the occupants’
before tax household income.
Using the median household income of renters in Masset ($43,000 from the 2016 Census), affordable
monthly rental shelter costs for those earning this income or higher is $1,077 (Table 7), which is
considerably more than the median rental shelter cost (reported in the Census) in Masset of $831. In
order to afford the median monthly rental shelter costs of $831 a household would need an annual
income of $33,000. There were 90-105 households in Masset reporting under that income level in 2016.
The median income renter is not able to afford a three-bedroom unit (which make up the majority of
the building stock), but they can afford the estimated costs for a one- and two-bedroom unit. An owner
earning the median of $54,000 is able to afford any of the rental unit sizes at the monthly cost
Table 7: Affordable Rent, Census 2016 and interviews (green means affordable, yellow means difficult to afford, orange means
unaffordable)
Table 8 highlights that the lone parent households are more at risk, as those earning the median
income are just able to afford the rental costs for a two-bedroom unit and not able to afford a three-
bedroom unit. While one-person households can afford a one-bedroom unit, there are very few of these
units in Masset. One-person households earning the median income can just afford a two-bedroom
sized rental. Couple families with or without children earning the median income can more than afford
the appropriately sized dwelling, but those at the bottom of the income generation scale may still have
challenges.
Table 8 Affordable Rent by Household Type, Census 2016 and interviews (green means affordable, yellow means difficult to
afford, orange means unaffordable)
Affordable
Median
Household (# of Monthly Rent
Household Monthly Rent Prices in
household types) (30% of
Income (All) Income) Masset
All home sizes (median): $83113
Lone Parent (25) $ 37,000 $924
Two-bedroom: Est. $800
16
Interviews.
23Three-bedroom+: Est. $1,100
One-person One-bedroom: Est. $700
$34,550 $864
household (170)
Couple families One-bedroom: Est. $700
$80,400 $2,009
without children (70)
Couple families with Two-bedroom: Est. $800
$93,700 $2,342
children (115) Three-bedroom+: Est. $1,100
Renter Household Needs
Engagement findings
Most renter survey respondents indicated that their current housing type and size meets the needs or
was, “OK, but not perfect” given their situation.
Figure 11 Renter, housing type and size perspective
Those who indicated that their housing does not meet their needs or that it was just, “OK” noted a
variety of concerns (listed here from higher to lower response frequency), including: their arrangement
is not secure, their unit is too small (does not offer enough living space), the home is unsafe (with major
repairs needed), and/or that it is not affordable.
Core household needs
Beyond the local housing survey and affordability analysis, the most recent census tracks housing
affordability using the number or proportion of households spending more than 30% of their income on
housing and utilities.
Of the 105 renting households in Masset, 30% (approx. 30 households) are spending 30% or more of
before tax income on shelter costs. These renters either need additional income or need housing that
is below market rates.
• Most of those renters comprise one and two-person households, though 5+ person households
are also challenged.
24• Of the 30, none are in severe affordability need, which is defined as spending between 50% and
100% of income on housing. 17
Overcrowding can also be an issue for housing and overcrowded conditions may indicate inadequate
housing and affordability issues. About 8% or 10 of Masset’s rental households are inadequately
housed.
Housing requiring significant repairs also challenges tenants. In Masset 38% of the renters or 40 in the
2016 Census indicated that major repairs 18 were needed.
Of all the renter households, 40 or 40% are in core housing need, meaning that they fall into one of
the needs above and cannot afford alternative housing.
Ownership Housing Affordability
Housing that costs 30% or less of occupants’ before tax household income is considered to be
“affordable housing.”
To better understand housing affordability, the annual average household income required to afford the
average assessed values of houses in the Village was calculated. Assumptions for ownership shelter
costs include: using a 25-year amortization, 5% down payment, and 3.14% rate. Other monthly costs 19
include: taxes ($176), heat ($125), strata or other costs ($167).
Table 9 highlights that owner households in Masset earning the median household income of $54,000
are able to afford $1,350/month in housing costs. (Comparatively, renters earning the median income
can afford $1,078/month in housing costs.) Both owners and renters with a median household income
are more than able to afford the current median ownership costs and the average costs for all sizes of
detached units. Despite the ability of many renters to afford home ownership, many continue to rent.
The interviews revealed a few anecdotal explanations for this trend. First, many people in Masset may
only be there for a short time and be unwilling to commit to owning a home. Second, many who grow
up in Masset anticipate leaving and so they also do not commit to ownership. According to census data
for those who have moved to the community in the past year, the transient nature of Masset residents
appears to be similar to the region and less so than BC as whole; therefore, this anecdotal explanation
may not be accurate.
17
Stats Canada Census 2016
18
The 'major repairs needed' category includes dwellings needing major repairs such as dwellings with defective
plumbing or electrical wiring, and dwellings needing structural repairs to walls, floors or ceilings.
19
http://www.cmhc-schl.gc.ca/en/co/buho/buho_020.cfm
25Table 9: Home Ownership Affordability, Census 2016 costs and cost for first-time homeowners looking to purchase a home
based of BC Assessment amounts (green is affordable, yellow is difficult to afford and orange is unaffordable)
Table 10 highlights that the affordability junction (i.e. the median household income at which home
ownership is affordable) in Masset begins quite far below the median owner income, only limiting
affordability and housing choice for these lower income households.
Table 10 Affordable Ownership Levels for first time homeowners looking to purchase a home
Table 11 highlights that one-person households in Masset earning the median income cannot afford
ownership prices for the appropriate dwellings size; lone parent families are close to not being able to
afford a two-bedroom, and cannot afford the three-bedroom dwelling. Couples and couples with
26children earning the median income can more than afford the appropriately sized average dwelling
prices.
Table 11 Affordable Ownership, Census 2016 and CMHC
Affordable
Median
Monthly
Household Average Home Ownership
Household (# of Housing Costs
Income (All) Monthly Costs
household types) (30% of Income)
Two-bedroom: $863
Lone Parent (25) $ 37,000 $924
Three-bedroom: $1,059
One-person
$34,550 $864 One-bedroom: $872
household (170)
Couple families
$80,400 $2,009 One-bedroom: $872
without children (70)
Couple families with Two-bedroom: $863
$93,700 $2,342
children (115) Three-bedroom: $1,059
There are up to 105 households that cannot afford the average ownership costs of a one-bedroom
residential dwelling at $872/month
Owner Household Needs
Engagement findings
A large majority of homeowner survey respondents indicated that their current housing type and size
meets their needs or is, “OK” given their situation.
Figure 12 Owner, housing type and size perspective
Those indicating concerns note the following issues in order of frequency: “not enough bedrooms”,
“too small – not enough living space”, “too old” and “poor quality”.
27Core household needs (beyond the local housing survey and affordability
analysis)
The most recent census tracks housing affordability using the number or proportion of households
spending more than 30% of their income on housing and utilities. Of the 250 owner households in
Masset, 18% or about 45 are spending 30% or more of their before tax income on shelter costs and
they may need housing that is below market rates.
• Of the 45, most are in severe need as they are spending between 50% and 100% of their
income on housing, 20 putting them at risk of homelessness and in need of housing that is
significantly below market rates.
• Most (25) of those households with affordability needs are one-person households.
Overcrowded conditions may indicate inadequate housing and affordability issues. Very few owner
households in Masset are inadequately housed based
on CMHC guidelines. Repairs are needed - foundation @
$5,500.00, metal roof 2818 Sq Ft, new
Finally, housing requiring significant repairs also vinyl flooring 1800 Sq Ft, interior
challenges tenants. Approximately 50 (20%) of owner
work @ $10,000.00 to bring up to
households in the 2016 Census indicated that major
standard of family home, exterior
repairs were needed.
work @ $10,000.00 including
Of all the owner households, 60 or 25% are in core outbuildings.
housing need, meaning that they fall into one of the
needs above and cannot afford alternative housing. Survey Respondent
Supportive Housing Needs and Other Groups
There is very little housing for the following groups:
seniors, persons with disabilities, persons escaping I don’t care how the housing crisis is
violence, and for those who are experiencing homeless. solved I just want to see people in
homes. The Transition House which is
As is the case in many places, seniors in Masset aim to
meant to house women and children
stay in their homes as long as they can, and they have few
options at their disposal. According to interviews some leaving violent situations is acting as
seniors wish to see smaller, accessible and easy to an informal shelter for people who
maintain units; however, the survey did not indicate a have no other options.
significant demand for this type of housing in the next 5-
Survey respondent
10 years.
Another group lacking housing options in Masset is men
at risk. There is no transition house that offers services to men, and this is a barrier to their recovery.
Some interviewees indicated that Old Masset Village Council is potentially exploring or planning options
for men. 21
20
Stats Canada Census 2016
21
Confirmation of this information was requested from Old Massett Village Council, but has not yet been received.
28You can also read