COMPARATIVE METHYLATION AND RNA-SEQ EXPRESSION ANALYSIS IN CPG CONTEXT TO IDENTIFY GENES INVOLVED IN BACKFAT VS. LIVER DIVERSIFICATION IN ...
←
→
Page content transcription
If your browser does not render page correctly, please read the page content below
Arora et al. BMC Genomics      (2021) 22:801
https://doi.org/10.1186/s12864-021-08123-x

 RESEARCH ARTICLE                                                                                                                                   Open Access

Comparative methylation and RNA-seq
expression analysis in CpG context to
identify genes involved in Backfat vs. Liver
diversification in Nanchukmacdon Pig
Devender Arora1, Jong-Eun Park1, Dajeong Lim1, Bong-Hwan Choi1, In-Cheol Cho2, Krishnamoorthy Srikanth1,4,
Jaebum Kim3 and Woncheoul Park1*

  Abstract
  Background: DNA methylation and demethylation at CpG islands is one of the main regulatory factors that allow
  cells to respond to different stimuli. These regulatory mechanisms help in developing tissue without affecting the
  genomic composition or undergoing selection. Liver and backfat play important roles in regulating lipid
  metabolism and control various pathways involved in reproductive performance, meat quality, and immunity.
  Genes inside these tissue store a plethora of information and an understanding of these genes is required to
  enhance tissue characteristics in the future generation.
  Results: A total of 16 CpG islands were identified, and they were involved in differentially methylation regions
  (DMRs) as well as differentially expressed genes (DEGs) of liver and backfat tissue samples. The genes C7orf50, ACTB
  and MLC1 in backfat and TNNT3, SIX2, SDK1, CLSTN3, LTBP4, CFAP74, SLC22A23, FOXC1, GMDS, GSC, GATA4, SEMA5A
  and HOXA5 in the liver, were categorized as differentially-methylated. Subsequently, Motif analysis for DMRs was
  performed to understand the role of the methylated motif for tissue-specific differentiation. Gene ontology studies
  revealed association with collagen fibril organization, the Bone Morphogenetic Proteins (BMP) signaling pathway in
  backfat and cholesterol biosynthesis, bile acid and bile salt transport, and immunity-related pathways in methylated
  genes expressed in the liver.
  Conclusions: In this study, to understand the role of genes in the differentiation process, we have performed
  whole-genome bisulfite sequencing (WGBS) and RNA-seq analysis of Nanchukmacdon pigs. Methylation and motif
  analysis reveals the critical role of CpG islands and transcriptional factors binding site (TFBS) in guiding the
  differential patterns. Our findings could help in understanding how methylation of certain genes plays an important
  role and can be used as biomarkers to study tissue specific characteristics.
  Keywords: CpG, DMR, DEGs, Differentiation, Methylation, Motif

* Correspondence: wcpark1982@korea.kr
1
 Animal Genomics and Bioinformatics Division, National Institute of Animal
Science, RDA, 55365 Wanju, Republic of Korea
Full list of author information is available at the end of the article

                                        © The Author(s). 2021 Open Access This article is licensed under a Creative Commons Attribution 4.0 International License,
                                        which permits use, sharing, adaptation, distribution and reproduction in any medium or format, as long as you give
                                        appropriate credit to the original author(s) and the source, provide a link to the Creative Commons licence, and indicate if
                                        changes were made. The images or other third party material in this article are included in the article's Creative Commons
                                        licence, unless indicated otherwise in a credit line to the material. If material is not included in the article's Creative Commons
                                        licence and your intended use is not permitted by statutory regulation or exceeds the permitted use, you will need to obtain
                                        permission directly from the copyright holder. To view a copy of this licence, visit http://creativecommons.org/licenses/by/4.0/.
                                        The Creative Commons Public Domain Dedication waiver (http://creativecommons.org/publicdomain/zero/1.0/) applies to the
                                        data made available in this article, unless otherwise stated in a credit line to the data.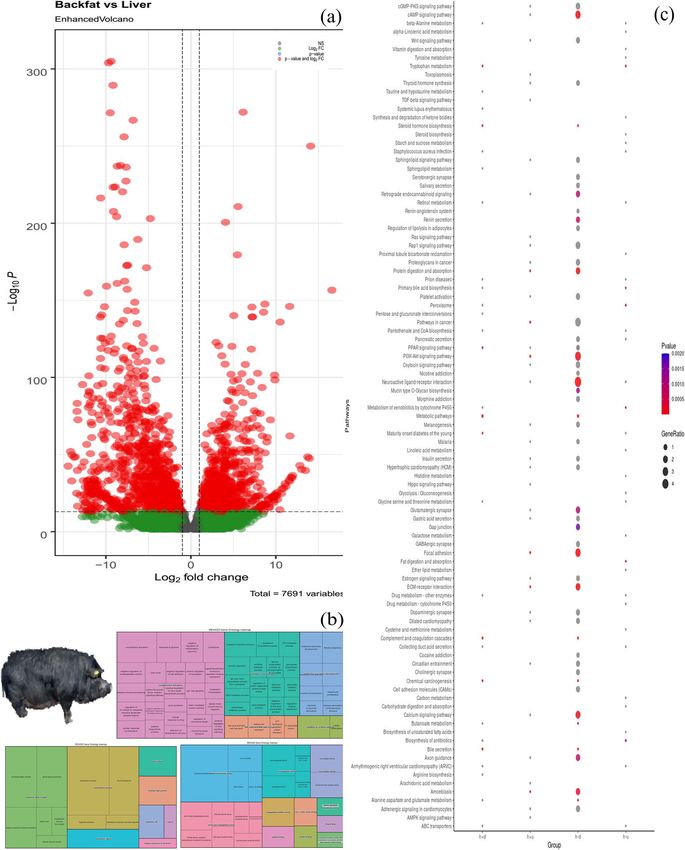
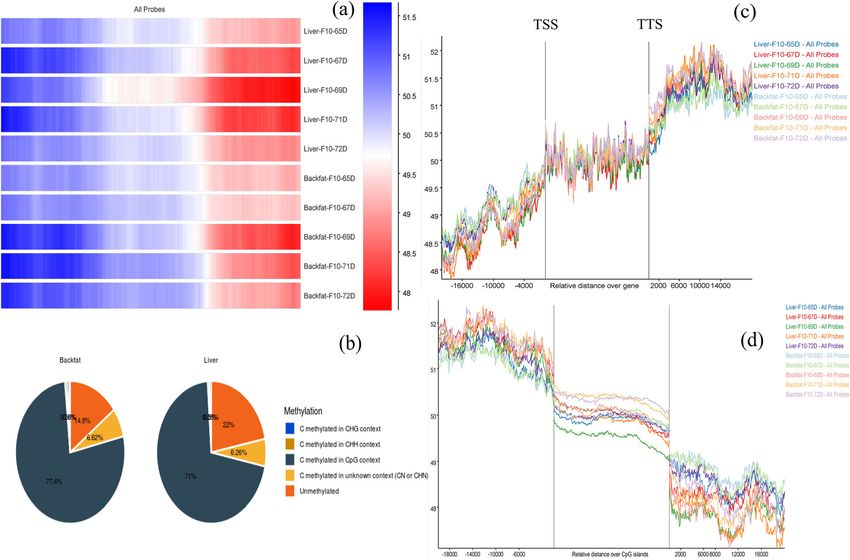
Arora et al. BMC Genomics       (2021) 22:801                                                                                              Page 2 of 10

Background                                                                    [9, 10]. A single cell at embryonic stages differentiates to
Pork is an important high-protein food consumed across                        form different tissues which could show contrasting
the world and requires timely effort to monitor and sus-                      physical characteristics with almost unchanged genomic
tain the quality of meat. Several molecular breeding pro-                     composition governed by DNA methylation [11, 12]
grams are being run around the world to understand                            (Fig. 1). These epigenetic mechanisms provide plasticity
and fulfil future requirements with enhanced food qual-                       to the organism and the ability to adapt to different situ-
ity which largely depends upon the taste and compos-                          ations by altering the expression pattern of genes to
ition, and these factors ultimately shape the breeding                        regulate related pathways [13, 14]. However, it is still un-
program by the choice of meat [1, 2]. The Republic of                         clear whether methylation profiles can help in identify-
Korea is one of the highest pig-consuming countries and                       ing tissue-specific genes that may have a role in
there is a huge domestic demand for its Jeju native black                     influencing tissue-specific features or may be involved in
pig (JNP) for its superior taste [3, 4]. Due to the en-                       biological functions by directing different pathways.
hanced taste but low reproduction of JNP, a threat of ex-                     There is consequently, a void in understanding the tissue
tinction has loomed over the JNP breed [5]. To address                        specific diversification through methylation and gene
this issue, an breeding program was conducted to de-                          regulation patterns. While DNA methylation in the
velop a pig breed with a high reproduction rate and sus-                      mammalian tissue development process is a conserved
tain the superior taste characteristics [6]. In the course                    process, understanding of the conversion process at the
of the intensive breeding program and continued close                         genome-wide level is still not very well understood. In
monitoring using modern biological methods, a pig                             eukaryotic organisms, DNA methylation leads to epigen-
breed referred to as ‘Nanchukmacdon’ was developed. It                        etic modification which “at the promoter site” leads to
has increased fat deposition, a better metabolism rate                        curbs the transcription process by binding to regulatory
and maintained superior characteristics features in sub-                      protein and primarily occurs in the CpG island that is
sequent generations. The enhanced characteristics dis-                        more abundant in the upstream region of the gene [12,
played by the mixed breed involve the expression of                           13, 15]. Comparative analyses of methylation in CpG is-
genes and different biological pathways in different tis-                     land have primarily focused on cross-species compara-
sues that play important roles in maintaining the har-                        tive analysis and have revealed intriguing trends in both
mony of the cells and the development of tissue from                          the conserved and divergent features of DNA methyla-
single cells [7, 8].                                                          tion in eukaryotic evolution [14, 16, 17]. Studying these
   Despite having the same genome, an unknown mech-                           factors provides a way to better understand the genes
anism is governing the gene expression, development,                          that influence these processes which could help us in
genome imprinting, diseases, and diversification, and has                     understanding the overall regulation mechanism [15,
been involved in evolutionary changes in different tissues                    18]. In an attempt to understand methylation, a previous

 Fig. 1 Overview of the cell differentiation into different tissues involving expression of certain genes in one tissue (Highlighting gene A,B,C,D)
 and silent or least expressed in other to govern different pathways required for development
Arora et al. BMC Genomics     (2021) 22:801                                                                                       Page 3 of 10

study reported that the role of backfat deposition is asso-                 In the present work, we reported genes involved in
ciated with growth rate, meat quality, and reproductive                  tissue-specific changes at the methylation level and the
performance [19]. Backfat thickness is also considered as                role of gene expression in the regions. To this end, we
one of the main parameters when selecting female pigs                    performed WGBS and RNA-seq of (N=5+5) samples of
for breeding herds since it dominates several reproduct-                 backfat and liver respectively and integrated the analysis
ive performance parameters [20, 21]. Liver is also a                     results to understand the tissue characteristics. The
major organ involved in the regulation of lipid metabol-                 methylation pattern in the CpG island was further stud-
ism with fatness and plays a crucial role in animal                      ied to determine the potential role in the hyper-
growth, meat quality, immunity, and reproduction rate.                   methylated region with the respective expression pattern
Comparative understanding of tissue diversification is a                 in the specific tissues. RNA-seq analysis abled us to
complex process that involves the expression of certain                  analyze the differential expression patterns, as well as
genes in one tissue while remaining unchanged in an-                     gene ontology studies, reveals the close association in
other. To understand the hidden mechanism that sustain                   different biological important pathways that were
such superior characteristics methylation studies in tis-                enriched in various tissue under methylated conditions.
sue diversification could open a new front in identifying                Along with this, we also aimed to conduct a de novo
the biological phenomena associated with the new pig                     whole genome motif analysis to identify the methylated
breed. The phenomena underlying these processes will                     motif and the transcription factor binding sites in terms
ultimately provide better insight to understand the regu-                of overall changes of tissue and specific pathways.
latory mechanism of genes in different tissues control-
ling biological pathways.

 Fig. 2 A A heat map was generated for methyl call of each tissue sample and the methylation pattern on the overall genome was observed.
 B Average methylation composition analysis in context with C methylation in CpG, CHG, CHH, and CN. (H could be A, C, and T nucleotide and N
 belong to Unknown) (C) Methylation pattern with the relative degree of gene stabilization can be seen and (D) sharply increased in the TSS
 region of CpG islands and stabilized afterward

Arora et al. BMC Genomics (2021) 22:801 Page 4 of 10
Results observed between samples from respective tissues of
WGBS data analysis Nanchukmacdon pig and the filter parameters used for
WGBS data analysis was performed to compare methyla- DEGs were false discovery rate (FDR) values of ≤ 0.05
tion patterns amongst backfat and liver tissue. Overall and log2FoldChange≥±2 [23].
mapping of WGBS data on the reference genome was
~75 % with an average conversion rate of methyl call ex- Lists of DEGs with FDR ≤0.05 were compiled and sub-
ceed for reverse and forward (C+T)> 99.4 %. The overall mitted to DAVID v6.8 [24] for functional annotation
methylation composition was inclined towards liver and enrichment analysis. To perform the gene ontology
(Fig. 2A) and methylation in the CpG context was higher analysis, we divided the obtained DMRs according to
in backfat than in the liver, with 77 % of total methyla- their expression pattern into four sets: hyper-methylated
tion vs. 71 %, respectively (Fig. 2B & Additional file: File upregulated (729 genes) and downregulated (630 genes)
S1). Using SeqMonk (https://www.bioinformatics. in backfat, and hyper-methylated upregulated (792
babraham.ac.uk/projects/seqmonk/), a tool for genes) and downregulated (1032 genes) in liver, for a
visualization of high throughput mapped sequence data, total of 3183 genes (Additional file: File S2). For each
we detected a sharp increase at the 2 kb upstream region list, enriched gene ontology (GO) in Biological Processes
of the TSS region and at downstream of TTS region. (BP), Molecular functions (MF), Cellular Compartments
CpG methylation help in stabilizing chromatin structure (CC), and KEGG pathway analyses were performed
as well as it also controls the regulation of related gene (Additional file: File S3). These terms were then clus-
expression and these effects could overall responsible for tered semantically using the ReviGO server. Throughout
stabilization of genome (Fig. 2C). This methylation level the transcriptome of Nanchukmacdon pig, an enriched
remains stable after the promoter region and contributes function with an elevated GO-term function was identi-
to structural stability and regulation of gene expression. fied and the clustered representation of these elevated
CpG island studies also confirmed a sharp decrease in GO terms was observed using a treemap (Additional file:
the methylated CpG level outside the 2 kb CpG island Figures S2: (BP)1a-4a, (CC)1b-4b, and (MF)1c-4c re-
(Fig. 2C and D). Individual methylation patterns for all spectively). We identified the significantly expressed
the identified genes confirms that the pattern of methy- genes (P-value ≤ 0.05) related to the KEGG pathway that
lation corresponds with the distribution of gene pro- ranges from metabolic pathway, fatty acid biosynthesis,
moters, which are usually prone to transcription ErbB signaling pathway, adipocytokine signaling path-
(Additional file: Figures S1). A DMR study was carried way, calcium signaling pathway, and oxidative phosphor-
out to compare the tissue-specific methylation level and ylation. The CpG island plays a major role in the
a de novo motif analysis for TFBS in backfat vs. liver differential expression of genes. Methylation of CpG
DMRs was conducted using Homer software (Table 1) islands has been reported to affect their gene expression.
(Additional file: Table S1). After identification of differentially expressed methylated
regions in the backfat and liver we retrieved coordinates
for all the autosome chromosomes from the UCSC
browser and mapped them to the identified regions. We
Identification of DEGs, CpG methylation, and Gene obtained a total of 16 genes were methylated at the CpG
ontology island (Table 2).
DESeq2 an R package was implemented to identify sta-
tistically significant differences in gene expression ob-
tained from featureCounts, which is used to count reads Circos plot
from RNA or DNA sequence data in terms of genomic A circular plot was generated with five rings where the
features [22]. The overall relationship between backfat outermost ring represents the 18 autosome chromo-
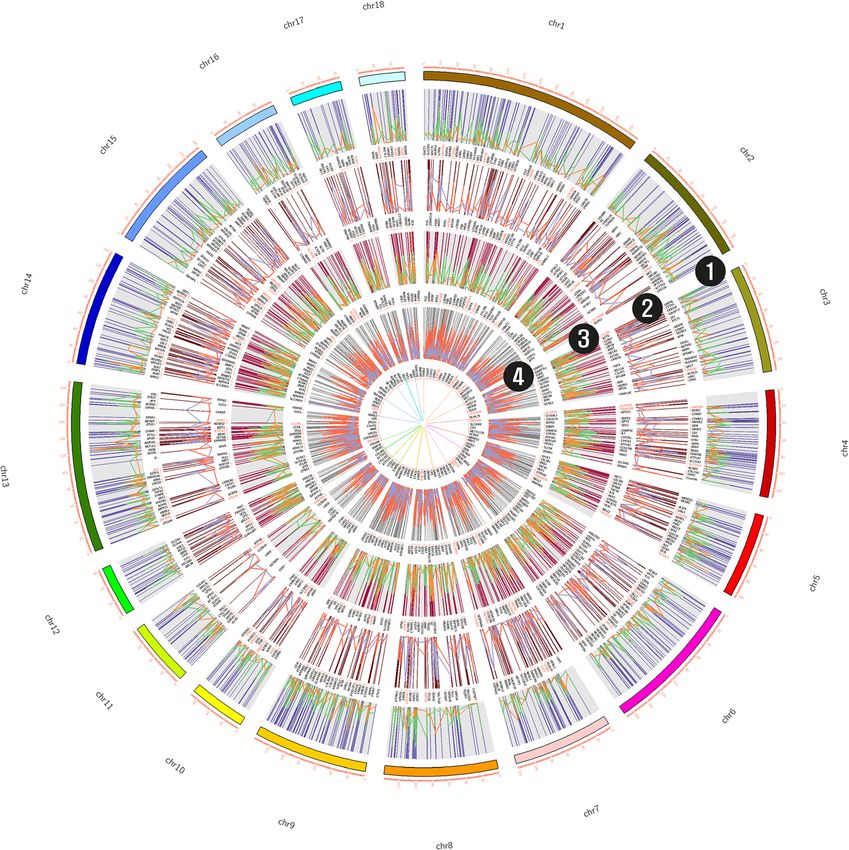
and liver was represented in a volcano plot (Fig. 3A). A somes of S. scrofa and the inner four rings were com-
total of 2761 and 2375 DEGs in liver and backfat were posed of different conditions. The second and fourth
Table 1 Represent the top 5 predicted motif based on rank in the Homer analysis, p-value, %targets, %background, and best match
Rank Motif P-value % of Targets % of Background STD(Bg STD) Best Match
1 1e-50,917 97.64 % 73.36 % 46.2 bp (69.8 bp) AT2G15740(C2H2)
2 1e-2855 13.01 % 8.33 % 56.2 bp (73.5 bp) RFX7
3 1e-1958 10.57 % 7.01 % 55.8 bp (67.3 bp) RAR:RXR(NR)
4 1e-1898 12.13 % 8.35 % 57.5 bp (73.1 bp) RFX3
5 1e-1813 11.64 % 8.01 % 54.8 bp (69.2 bp) MET28Arora et al. BMC Genomics (2021) 22:801 Page 5 of 10 Fig. 3 Reference pig is taken from Fig. 1 of Arora et al., [6] (A) Volcano plot of fold change expression level (y-axis) against –Log10P (x-axis). Each point represents a transcript; those with significant differential expression (FDR ≤ 0.05) are indicated in red. B Treemap for gene ontology studies for backfat and liver with BP, MF, and CC. C KEGG pathway analysis for DEGs with hyper-methylated downregulated liver (h-d), hyper-methylated up-regulated liver (h-u), hyper-methylated downregulated backfat (h+d), and hyper-methylated upregulated backfat (h+u)
Arora et al. BMC Genomics    (2021) 22:801                                                                             Page 6 of 10

Table 2 Common genes identified from different condition
Ens_Id                 chr   CpG         pvalue        padj          meth.diff      log2FoldChange   Gene       Coordinates
ENSSSCG00000032911      2    CpG:_196    1.77E-11      1.3E-10       -30.44324324     -2.326426281   TNNT3           989931-1317600
ENSSSCG00000008446      3    CpG:_73     6.44E-32      1.55E-30      -32.17542336    11.10018784     SIX2         95459937-95464066
ENSSSCG00000007574      3    CpG:_29     1.27E-15      1.28E-14      -27.95608782     4.797926491    SDK1           2814328-3324799
ENSSSCG00000038777      3    CpG:_2584   2.91E-19      3.74E-18      26.54798762      -2.310975194   C7orf50          648140-745331
ENSSSCG00000044546      3    CpG:_268    0.0000031     0.0000134     37.31729323      -2.390040267   ACTB           4091832-4096684
ENSSSCG00000000672      5    CpG:_30     5.58E-19      6.99E-18      -27.95833872     3.098361395    CLSTN3       63572062-63610618
ENSSSCG00000000978      5    CpG:_25     1.09E-10      7.53E-10      40.16694963      -5.798324853   MLC1             571961-591823
ENSSSCG00000033760      6    CpG:_45     2.42E-23      3.81E-22      -41.66461765     3.091738308    LTBP4        48831014-48861507
ENSSSCG00000030513      6    CpG:_22     1.64E-20      2.23E-19      -28.87776243     -3.566656672   CFAP74       63976011-64026767
ENSSSCG00000001004      7    CpG:_113    1.78E-79      1.8E-77       -47.36842105     -5.172667179   SLC22A23       1988695-2131709
ENSSSCG00000039756      7    CpG:_1263   0.000245614   0.000794638   -46.61016949     2.565410851    FOXC1            837171-838805
ENSSSCG00000000994      7    CpG:_48     1.98E-19      2.56E-18      -32.53353973     -2.603381323   GMDS            752239-1285550
ENSSSCG00000002490      7    CpG:_322    7.43E-17      8.2E-16       -26.30769231     4.557359006    GSC        116099047-116100966
ENSSSCG00000022383     14    CpG:_139    0.001072997   0.005378408   -28.33208302     -7.451598322   GATA4        14858159-14939941
ENSSSCG00000017095     16    CpG:_21     5.42E-20      7.2E-19       -29.06597882     3.18365959     SEMA5A       72492516-73329010
ENSSSCG00000016703     18    CpG:_55     3.93E-17      4.43E-16      -41.8356998      4.687258693    HOXA5        45421663-45432885

represent the hypermethylated and upregulated genes                  cell- and tissue-specific RANKL expression and the oste-
identified in the DMRs and DEGs for backfat and liver                oclastogenesis process [26]. We observed a uniform pat-
tissues respectively. Similarly, the third and fifth rings           tern of motif methylation in the highly conserved
represent the downregulated genes in the methylated re-              regulatory factor x gene family, which has been reported
gions and are generated using the CIRCOS tool [25]                   in the early development and maturation of cells [27]
(Fig. 4).                                                            (Table 1). The top identified motifs were of particular
                                                                     interest, with most motifs actively involved in upstream
                                                                     binding to transcription factors and affecting cis and epi-
Discussion                                                           cistrome features that regulate DNA landscape [28].
In the present investigation, to understand the role of              Similarly, the observed RAR/RXR binding sites are
genes involved in tissue-specific diversification, we have           enriched in differentiation regions and the identified
presented a comprehensive view of comparative methy-                 motif was found to have a strong association with regu-
lation pattern with differentially expressed genes                   latory transcription factors and previously has been in-
amongst backfat and liver tissue in Nanchukmacdon Pig.               volved in the differentiation process [29].
Methylation analysis is one of the most promising                      Our findings on common genes in CpG islands with
methods recently evolved and used to accurately de-                  methylation and differentially expressed patterns have a
cipher the diversification in cross tissue differentiation           limited total number of genes of 16. Amongst these, 13
patterns as well as to identify close relationships                  genes were hyper-methylated in the liver, and three were
amongst different tissues. Studying these patterns will              hyper-methylated in backfat. Among the identified
ultimately help us in identifying markers that specifically          genes, SIX2 was already reported to be involved in the
target breeds to enhance tissues of interest. Therefore,             differentiation process [30]. Methylation in the CpG is-
methylation analysis at CpG islands were performed by                land is necessary to control aberration and it regulates
integrating WGBS with RNA-seq data from different tis-               different pathways. To assess the impact, we performed
sues and profiled to identify potential genes and regions            gene ontology analysis on genes retrieved from four dif-
that are hyper-methylated and upregulated or down-                   ferent approaches: hyper-methylated upregulated in
regulated in backfat and liver in CpG islands which                  backfat and liver, hyper-methylated down-regulated
could be playing important roles in tissue-specific                  genes in backfat and liver tissues. The KEGG pathway
diversification.                                                     analysis correlated with the calcium signaling pathway,
  We performed a DMR analysis for de novo methylated                 fat digestion and absorption, cAMP signaling pathway,
regions and found the rank 1 motif includes “TATA                    etc. (Fig. 3C). Downregulated genes identified in hyper-
box” promoter sequence, which specifies to other mole-               methylated regions of backfat were related to comple-
cules where transcription begins and strongly modulates              ment activation, cholesterol biosynthesis, and tissue
Arora et al. BMC Genomics (2021) 22:801 Page 7 of 10
Fig. 4 Identified regions that were hyper-methylated and gene expression pattern in backfat and liver regions (1 & 3) highlighting hyper-
methylation in backfat and liver tissue with their expression pattern. Here green color represents the methylation pattern over the chromosomes
and orange represents the upregulated genes in the region and their expression pattern. Similarly, (2 & 4) indicate downregulated genes in
backfat and liver hyper-methylated region with dark orange color representing methylated regions and purple representing DEGs belonging in
the entire regions
development. In contrast, the up-regulated genes in tissues. The results indicate that methylation dominantly
hyper-methylated regions were strongly associated with occurred during backfat development at the CpG island
locomotory behavior, BMP signaling pathways, and col- in order to control aberrations. We have identified 16
lagen fibril development processes. Similarly, identified common genes that were highly expressed and differen-
genes in liver hyper-methylation and upregulated were tially methylated and could be used as potential markers
involved in biological important processes such as chol- in molecular breeding processes and to enhance bio-
esterol biosynthesis, bile acid, and bile salt transport, re- logical relevant tissues.
sponse to glucose, and the immune response
mechanism. As well, we found that downregulated genes Methods
have a role in the embryonic skeletal system, signaling Preparation of gDNA and Total RNA and Sequencing
pathways, cell adhesion, etc. Each rectangle in the tree- In the present study, Nanchukmacdon pigs were grown
map represents a single cluster which joined into ‘super- in farm of National Institute of Animal Science located
clusters’ of loosely related terms, visualized with on Jeju island with close monitoring of their health. Five
different colors (Fig. 3B & Additional file S3]. boars with average age of 26 months were randomly se-
lected for effective size calculation to collect samples for
Conclusions WGBS, and RNA-seq analysis (n=5 for liver and backfat
In conclusion, an integrated methylation and RNA-seq tissues, respectively). The pigs were euthanized with an
analysis provided a comprehensive overview of methyla- anesthetic injection given into the ear vein with an over-
tion and transcriptomic pattern in backfat and liver dose of Alfaxan (0.7 mg/kg) and bulk tissue (10 mg) wasArora et al. BMC Genomics (2021) 22:801 Page 8 of 10
thereafter collected [31]. Subsequently, samples were Trimmomatic tool before sequence alignment [42].
stored in a sterile container and immediately frozen at Paired-end reads were aligned to the S. scrofa genome
−70 °C until further analysis. Ethical committee of Na- (Sscrofa11.1) using Hisat2 [43, 44] following, read count
tional Institute of Animal Science (NIAS) approved and was performed using FeatureCount [22]. Finally, DESeq2
verified all the experimental procedures and followed [45] was used to identify DEGs.
ARRIVE guidelines to perform the experiments [32].
Genomic DNA was isolated using a DNeasy Blood & De novo motif discovery
Tissue Kit (Qiagen, Valencia, CA, USA), and total RNA Hyper-methylated regions were predicted with a cutoff
was isolated using the TRIzol method according to of ±25 in DMRs in backfat and liver. We were interested
manufacturer protocols. The concentrations of DNA in understanding the motif for these methylated regions
and RNA were determined using a Qubit fluorometer in GC% of the CpG island found near to the transcrip-
(Invitrogen, UK), NanoDrop (Thermo Scientific, USA), tion start site and these motif analysis was performed by
and 364 Bioanalyzer (Agilent, UK), and integrity was findMotifsGenome.pl module of HOMER software at
monitored by agarose gel electrophoresis. the default parameter [46]. Rank-wise motifs were de-
gDNA from Nanchukmacdon pig backfat and liver tected with sorted p-value, %target, and %background
was subjected to bisulfite conversion using the fragment targets.
size (250 bp±25 bp), and the sequencing libraries were
constructed as previously described [6]. Similarly, RNA-
Functional enrichment analysis of methylated genes with
seq data were generated for Nanchukmacdon pig (N=5)
differentially expressed genes
after RNA isolation of backfat and liver tissues using the
After identifying DEGs commonly found in backfat and
TRIzol method following the prescribed protocol and
liver, methylated regions with FDR ≤ 0.05 and log2Fold-
previously described [33]. The sequencing libraries were
Change ≥±2 were compiled and submitted to DAVID
constructed using a RNA sample preparation kit (Illu-
v6.8 [24] for functional annotation and enrichment ana-
mina, San Diego, CA, USA), and they were run in the
lysis. For each list, enriched Gene Ontology (GO) studies
Illumina NovaSeq instrument for 50 × 2 cycles.
were performed for BP, MF, and CC. ReviGO a web ser-
ver utilize the GO terms to present a treemap from re-
DMRs and DEGs analysis of WGBS and RNA-seq data
spective process and clustered semantically with
The WGBS data were analyzed as previously described
different colors [47] and the Clusterprofiler R package
to understand methylation patterns in the identified
[48] was used for summarizing the GO terms.
genes [34]. Trim_galore was utilized for quality check of
sequencing data [35] subsequently, sam_blaster was used
to remove duplicate reads from the alignment following CpG island and methylation pattern analysis
reads were sorted using SAMtools [36]. The reads were Based on DMRs, we aimed to identify regions either in-
then mapped to the reference genome of sscrofa11.1 clined towards backfat or liver by comparing CpG island
using Bismark [37] and the methylation level in CpG, coordinates retrieved from the UCSC genome browser
CHH, and CHG island measured using bismark methyl [49]. A total of 46,218 regions were retrieved across the
extractor. Sorting of Bam file was undertaken before genome by following the Table browser with the pig
running the methylcall and performed with an average genome assembly Sscrofa11.1 as the reference and se-
conversion rate of >99.4 % by applying filters based on a lected a track for the CpG island. The identified island
minimum coverage of 10 and a mapping quality of at was used to extract DMRs located in the genomic coor-
least 10. Since we were interested in identifying the dif- dinates and we extracted the region of interest that plays
ferential pattern in the respective tissues, we later per- a crucial role in tissue diversification.
formed DMR studies across backfat and liver using the
Abbreviations
methylKit an R package [38–40]. Logistic regression ap- WGBS: Whole-Genome Bisulfite Sequencing; DMR: Differentially Methylation
proach was implemented to model the odd log probabil- Region; DEG: Differentially Expressed Gene; JNP: Jeju Native Black Pig;
ity to observe the ratio. Following, false discovery rate UCSC: University of California, Santa Cruz; TFBS: Transcriptional Factors
Binding Site; GO: Gene Ontology; BP: Biological Processes; MF: Molecular
(Q ≤ 0.01) and percent methylation difference larger functions; CC: Cellular Compartments
than 25 % were selected and DMRs were extracted.
Similarly, we performed a RNA-seq analysis as it en-
Supplementary information
ables a comprehensive understanding of the expression The online version contains supplementary material available at https://doi.
pattern of tissue-specific changes in genes. With statis- org/10.1186/s12864-021-08123-x.
tical advanced tools, we performed a quality check by
FastQC to assess low-quality pair-end reads [41] and Additional file 1 Figure S1. Comparative methylation pattern of
identified genes using SeqMonk.
further removed potential adapters by using theArora et al. BMC Genomics (2021) 22:801 Page 9 of 10
Additional file 2 Figure S2. GO results for Biological process (BP), 2. Xu L, Yang X, Wu L, Chen X, Chen L, Tsai F-S. Consumers’ Willingness to Pay
Molecular function (MF), Cellular compartment. for Food with Information on Animal Welfare, Lean Meat Essence Detection,
and Traceability. International Journal of Environmental Research Public
Additional file 3 File S1. Cytosine methylation report for backfat and Health. 2019;16(19):3616.
liver. 3. Kim K, Kim D, Min Y, Jeong D, Son YO, Do K. Myogenic regulatory factors
Additional file 4 File S2. Differentially methylated as well as expressed are key players in determining muscle mass and meat quality in Jeju native
gene list for backfat and liver. and Berkshire pigs. Veterinary Medicine and Science 2020.
Additional file 5 File S3. Gene ontology studies of identified genes in 4. Lee Y-S, Shin D, Won K-H, Kim DC, Lee SC, Song K-D. Genome-wide scans
hypermethylation condition identified in backfat and liver tissue samples. for detecting the selection signature of the Jeju-island native pig in Korea.
Asian-Australasian Journal of Animal Sciences. 2020;33(4):539.
Additional file 6 Table S1. Motif output predicted results. 5. Kim J, Cho S, Caetano-Anolles K, Kim H, Ryu Y-C. Genome-wide detection
and characterization of positive selection in Korean Native Black Pig from
Acknowledgements Jeju Island. BMC Genet. 2015;16(1):3.
Not Applicable. 6. Arora D, Srikanth K, Lee J, Lee D, Park N, Wy S, Kim H, Park J-E, Chai H-H,
Lim D. Integration of multi-omics approaches for functional characterization
of muscle related selective sweep genes in Nanchukmacdon. Scientific
Authors’ contributions
reports. 2021;11(1):1–12.
D.A. and W.C.P. designed and performed the research, analyzed the data,
7. Gonzàlez-Porta M, Frankish A, Rung J, Harrow J, Brazma A. Transcriptome
and wrote the manuscript. J.E.P., D.L., B.H.C., I.C.C., K.S. and J.K. interpreted the
analysis of human tissues and cell lines reveals one dominant transcript per
results and finalized the manuscript. All authors read and approved the final
gene. Genome biology. 2013;14(7):1–11.
manuscript.
8. Martínez O, Reyes-Valdés MH: Defining diversity, specialization, and gene
specificity in transcriptomes through information theory. Proceedings of the
Funding National Academy of Sciences 2008, 105(28):9709-9714.
This work was supported by Korea Post-Genome Project (Project title: Deci- 9. Bartolomei MS, Oakey RJ, Wutz A. Genomic imprinting: An epigenetic
phering the reference genome and the discovery of trait-associated genes in regulatory system. In.: Public Library of Science San Francisco, CA USA; 2020.
Nanchukmacdon and mini pigs). Project No. PJ013343 of the National Insti- 10. Paulsen M, Ferguson-Smith AC. DNA methylation in genomic imprinting,
tute of Animal Science, Rural Development Administration, Republic of Korea. development, and disease. J Pathol. 2001;195(1):97–110.
This study was supported by 2020 the RDA Fellowship Program of National
11. Kim M, Costello J. DNA methylation: an epigenetic mark of cellular memory.
Institute of Animal Science, Rural Development Administration, Republic of
Exp Mol Med. 2017;49(4):e322–2.
Korea.
12. Trapnell C. Defining cell types and states with single-cell genomics.
This funding helped in successfully performing all the sample analysis and
Genome research. 2015;25(10):1491–8.
provided financial assistance to D.A. The funding bodies played no role in
13. Chen X, Schönberger B, Menz J, Ludewig U. Plasticity of DNA methylation
the design of the study and collection, analysis, and interpretation of data
and gene expression under zinc deficiency in Arabidopsis roots. Plant Cell
and in writing the manuscript”.
Physiol. 2018;59(9):1790–802.
14. Moore LD, Le T, Fan G. DNA methylation and its basic function.
Availability of data and materials Neuropsychopharmacology. 2013;38(1):23–38.
All data generated or analyzed during this study are included in the 15. Blake LE, Roux J, Hernando-Herraez I, Banovich NE, Perez RG, Hsiao CJ, Eres I,
supplementary information files or are available at the NCBI GEO database Cuevas C, Marques-Bonet T, Gilad Y. A comparison of gene expression and
with accession number: GSE176338 at https://www.ncbi.nlm.nih.gov/geo/ DNA methylation patterns across tissues and species. Genome Res. 2020;
query/acc.cgi?acc=GSE176338. Statistical Source Data underlying all figures 30(2):250–62.
are provided as separate supplementary files with a tab for each panel 16. Iguchi-Ariga S, Schaffner W. CpG methylation of the cAMP-responsive
generated from source data. enhancer/promoter sequence TGACGTCA abolishes specific factor binding
as well as transcriptional activation. Genes Dev. 1989;3(5):612–9.
Declarations 17. Tate PH, Bird AP. Effects of DNA methylation on DNA-binding proteins and
gene expression. Curr Opin Genet Dev. 1993;3(2):226–31.
Ethics approval and consent to participate 18. N’Diaye A, Byrns B, Cory AT, Nilsen KT, Walkowiak S, Sharpe A, Robinson SJ, Pozniak
The study was approved by the Ethics committee of National Institute of the CJ. Machine learning analyses of methylation profiles uncovers tissue-specific gene
Animal Science (NIAS)- Rural Development Administration with ethical expression patterns in wheat. The Plant Genome. 2020;13(2):e20027.
approval no: NIAS20181295. 19. Xing K, Zhu F, Zhai L, Liu H, Wang Z, Hou Z, Wang C. The liver
transcriptome of two full-sibling Songliao black pigs with extreme
Consent for publication differences in backfat thickness. J Anim Sci Biotechnol. 2014;5(1):1–9.
Not applicable. 20. Kim JS, Yang X, Pangeni D, Baidoo SK. Relationship between backfat thickness
of sows during late gestation and reproductive efficiency at different parities.
Competing interests Acta Agriculturae Scandinavica Section A—Animal Science. 2015;65(1):1–8.
The authors declare no competing interest. 21. Roongsitthichai A, Tummaruk P. Importance of backfat thickness to
reproductive performance in female pigs. The Thai Journal of Veterinary
Author details Medicine. 2014;44(2):171–8.
1
Animal Genomics and Bioinformatics Division, National Institute of Animal 22. Liao Y, Smyth GK, Shi W. featureCounts: an efficient general purpose
Science, RDA, 55365 Wanju, Republic of Korea. 2Subtropical Livestock program for assigning sequence reads to genomic features. Bioinformatics.
Research Institute, National Institute of Animal Science, RDA, 63242 Jeju, 2014;30(7):923–30.
Korea. 3Department of Biomedical Science and Engineering, Konkuk 23. Xing K, Wang K, Ao H, Chen S, Tan Z, Wang Y, Xitong Z, Yang T, Zhang F, Ni
University, 05029 Seoul, Republic of Korea. 4Department of Animal Science, H. Comparative adipose transcriptome analysis digs out genes related to fat
Cornell University, NY 14853 Ithaca, USA. deposition in two pig breeds. Scientific reports. 2019;9(1):1–11.
24. Dennis G, Sherman BT, Hosack DA, Yang J, Gao W, Lane HC, Lempicki RA.
Received: 23 February 2021 Accepted: 25 October 2021 DAVID: database for annotation, visualization, and integrated discovery.
Genome biology. 2003;4(9):1–11.
25. Krzywinski M, Schein J, Birol I, Connors J, Gascoyne R, Horsman D, Jones SJ,
References Marra MA. Circos: an information aesthetic for comparative genomics.
1. Wallenbeck A, Rydhmer L, Röcklinsberg H, Ljung M, Strandberg E, Ahlman T. Genome research. 2009;19(9):1639–45.
Preferences for pig breeding goals among organic and conventional 26. Kitazawa R, Kitazawa S. Methylation status of a single CpG locus 3 bases
farmers in Sweden. Organic agriculture. 2016;6(3):171–82. upstream of TATA-Box of receptor activator of nuclear factor-κB ligandArora et al. BMC Genomics (2021) 22:801 Page 10 of 10
(RANKL) gene promoter modulates cell-and tissue-specific RANKL
expression and osteoclastogenesis. Mol Endocrinol. 2007;21(1):148–58.
27. Elkon R, Milon B, Morrison L, Shah M, Vijayakumar S, Racherla M, Leitch CC,
Silipino L, Hadi S, Weiss-Gayet M. RFX transcription factors are essential for
hearing in mice. Nature communications. 2015;6(1):1–14.
28. O’Malley RC, Huang S-sC, Song L, Lewsey MG, Bartlett A, Nery JR, Galli M,
Gallavotti A, Ecker JR. Cistrome and epicistrome features shape the
regulatory DNA landscape. Cell. 2016;165(5):1280–92.
29. Bourguet W, Vivat V, Wurtz J-M, Chambon P, Gronemeyer H, Moras D.
Crystal structure of a heterodimeric complex of RAR and RXR ligand-binding
domains. Molecular cell. 2000;5(2):289–98.
30. Zhang M, Wang C, Jiang H, Liu M, Yang N, Zhao L, Hou D, Jin Y, Chen Q,
Chen Y. Derivation of novel naive-like porcine embryonic stem cells by a
reprogramming factor‐assisted strategy. FASEB J. 2019;33(8):9350–61.
31. Jew B, Alvarez M, Rahmani E, Miao Z, Ko A, Garske KM, Sul JH, Pietiläinen
KH, Pajukanta P, Halperin E. Accurate estimation of cell composition in bulk
expression through robust integration of single-cell information. Nature
communications. 2020;11(1):1–11.
32. Percie du Sert N, Hurst V, Ahluwalia A, Alam S, Avey MT, Baker M, Browne
WJ, Clark A, Cuthill IC, Dirnagl U. The ARRIVE guidelines 2.0: Updated
guidelines for reporting animal research. Journal of Cerebral Blood Flow
Metabolism. 2020;40(9):1769–77.
33. Kim H, Kim H, Seong P, Arora D, Shin D, Park W, Park J-E. Transcriptomic
Response under Heat Stress in Chickens Revealed the Regulation of Genes and
Alteration of Metabolism to Maintain Homeostasis. Animals. 2021;11(8):2241.
34. Wurmus R, Uyar B, Osberg B, Franke V, Gosdschan A, Wreczycka K, Ronen J,
Akalin A. PiGx: reproducible genomics analysis pipelines with GNU Guix.
Gigascience. 2018;7(12):giy123.
35. Krueger F. Trim galore. A wrapper tool around Cutadapt and FastQC to
consistently apply quality and adapter trimming to FastQ files 2015, 516:517.
36. Li H, Handsaker B, Wysoker A, Fennell T, Ruan J, Homer N, Marth G, Abecasis
G, Durbin R. The sequence alignment/map format and SAMtools.
Bioinformatics. 2009;25(16):2078–9.
37. Krueger F, Andrews SR: Bismark: a flexible aligner and methylation caller for
Bisulfite-Seq applications. bioinformatics 2011, 27(11):1571-1572.
38. Akalin A, Kormaksson M, Li S, Garrett-Bakelman FE, Figueroa ME, Melnick A,
Mason CE. methylKit: a comprehensive R package for the analysis of
genome-wide DNA methylation profiles. Genome biology. 2012;13(10):1–9.
39. Klambauer G, Schwarzbauer K, Mayr A, Clevert D-A, Mitterecker A,
Bodenhofer U, Hochreiter S. cn. MOPS: mixture of Poissons for discovering
copy number variations in next-generation sequencing data with a low
false discovery rate. Nucleic acids research. 2012;40(9):e69–9.
40. Lawrence M, Gentleman R, Carey V. rtracklayer: an R package for interfacing
with genome browsers. Bioinformatics. 2009;25(14):1841–2.
41. Andrews S. FastQC: a quality control tool for high throughput sequence
data. 2010. In.; 2017.
42. Bolger AM, Lohse M, Usadel B. Trimmomatic: a flexible trimmer for Illumina
sequence data. Bioinformatics. 2014;30(15):2114–20.
43. Kim D, Paggi JM, Park C, Bennett C, Salzberg SL: Graph-based genome
alignment and genotyping with HISAT2 and HISAT-genotype. Nature
biotechnology 2019, 37(8):907-915.
44. Kim D, Langmead B, Salzberg SL. HISAT: a fast spliced aligner with low
memory requirements. Nature methods. 2015;12(4):357–60.
45. Love M, Anders S, Huber W. Differential analysis of count data–the DESeq2
package. Genome Biol. 2014;15(550):10.1186.
46. Heinz S, Benner C, Spann N, Bertolino E, Lin YC, Laslo P, Cheng JX, Murre C,
Singh H, Glass CK. Simple combinations of lineage-determining
transcription factors prime cis-regulatory elements required for macrophage
and B cell identities. Molecular cell. 2010;38(4):576–89.
47. Supek F, Bošnjak M, Škunca N, Šmuc T. REVIGO summarizes and visualizes
long lists of gene ontology terms. PloS one. 2011;6(7):e21800.
48. Yu G, Wang L-G, Han Y, He Q-Y. clusterProfiler: an R package for comparing
biological themes among gene clusters. Omics: a journal of integrative
biology. 2012;16(5):284–7.
49. Karolchik D, Hinrichs AS, Furey TS, Roskin KM, Sugnet CW, Haussler D, Kent
WJ. The UCSC Table Browser data retrieval tool. Nucleic acids research.
2004;32(suppl_1):D493–6.
Publisher’s Note
Springer Nature remains neutral with regard to jurisdictional claims in
published maps and institutional affiliations.You can also read