Comparison of EMG Activity between Single-Leg Deadlift and Conventional Bilateral Deadlift in Trained Amateur Athletes - An Empirical Analysis
←
→
Page content transcription
If your browser does not render page correctly, please read the page content below
Original Research

Comparison of EMG Activity between Single-Leg Deadlift and Conventional
Bilateral Deadlift in Trained Amateur Athletes - An Empirical Analysis
WIKTOR DIAMANT‡1, STEPHAN GEISLER‡2, TIM HAVERS†2, and AXEL KNICKER‡1
1Institute
      for Movement and Neuroscience, German Sports University Cologne, Cologne,
GERMANY; 2Fitness and Health, IST University of Applied Sciences, Duesseldorf, GERMANY
†Denotes   graduate student author, ‡Denotes professional author

                                           ABSTRACT
International Journal of Exercise Science 14(1): 187-201, 2021. The purpose of the study was to compare
the normalized-electromyographic (NEMG) activity of the gluteus maximus (GMAX), gluteus medius (GMED),
biceps femoris (BF) and erector spinae (ES) muscles during the single-leg deadlift (SLDL) and the conventional-
deadlift (DL). Additionally, a potential influence of body height on the NEMG activity was examined. Fifteen
training-experienced male subjects completed the study. SLDL showed significantly higher average concentric
NEMG values of the GMED (77.6% vs. 59.3% [p = 0.002, ES = 1.0]) and BF (82.1% vs. 74.2% [p = 0.041, ES = 0.6]).
Significantly lower NEMG levels were found only in the left strand of the ES muscle (67.2% vs. 82.7% [p = 0.004, ES
= 0.9]). A significant influence of body height on EMG activity was also observed for all muscles, with the exception
of the GMED, during the SLDL. Body height correlated negatively with the concentric EMG activity of the ES (r =
–0.54 to –0.58), the BF (r = –0.63) and the GMAX (r = –0.85). In the DL there was a negative correlation only in the
BF (r = –0.59) and the GMAX (r = –0.7). This means that subjects with a lower body height showed a higher NEMG
activity in corresponding muscles. The results of this study indicate that the SLDL is preferable to the DL in training
the BF, and GMED. In addition, coaches should be aware that athletes body height can influence the extent to which
the respective muscles are activated.

KEY WORDS: hip extensors, knee flexors, bilateral resistance, unilateral resistance, muscle
activity

INTRODUCTION

The growing popularity of functional training led coaches to call for an increased use of
unilateral leg exercises in order to comply with the training principle of specificity (5, 19). Recent
research demonstrates that unilateral leg exercises can achieve comparable or better training
effects than similar bilateral exercises (24, 28, 35, 41). Apart from greater specificity and force
carryover in the respective target sport form, four primary arguments for the use of unilateral
exercises are given (8, 14, 16, 29): (i) lower risk of injury to the torso due to reduced axial load
on the spine in comparison to bilateral exercises; (ii) higher activation of joint-stabilizing
musculature, which can contribute to increased loading in the three planes of movement and
Int J Exerc Sci 14(1): 187-201, 2021
help to control excessive evasive movements; (iii) correction of any asymmetries between limbs
and the underlying muscular imbalances an athlete might possess, as it has been shown that
bilateral asymmetries of >15% increase the risk of injuries (20) and reduce sports performance
(25); (iv) higher potential force production per limb during unilateral training compared to
similar bilateral exercises due to bilateral deficit (BLD).
Furthermore, in previous investigations, the BLD was consistently observed in force during
simultaneous knee and hip extensions, but not in electromyography (EMG) (23, 37, 38). So far,
only a few studies have compared surface EMG activity during free unilateral and bilateral leg
exercises (3, 11, 18, 26, 27). In two of these studies, the methodological procedure also hinders
correct assessment of the BLD in EMG, because the testing intensity of the unilateral variant was
determined at 50 % of the bilateral variant (3, 11). Since BLD is strongly influenced by unilateral
training and previous training history (14, 37), a 50% intensity reduction without testing for the
corresponding load does not lead to an adequate activation comparison because the intensity of
both exercises did not match. Therefore, only a few studies compared unilateral and bilateral
exercises in heavy resistance training exercises of equal intensity.
To date, no study has compared the surface EMG activity of the most significant muscles during
the single-leg-deadlift (SLDL) to those during the bilateral-deadlift (DL) using the same
percentage of the repetition maximum. Previous exercise comparisons by McCurdy et al. (26,
27) and Deforest et al. (11) and ongoing observation of the BLD during simultaneous knee and
hip extensions (23, 37, 38) suggest that the EMG activity of the gluteus medius (GMED), gluteus
maximus (GMAX), and biceps femoris (BF) is higher during the SLDL than during the DL. In
contrast, a lower EMG activity of the erector spinae (ES) can be expected due to the lower
absolute loads for the SLDL.
EMG activity is related to the respective muscle length and the associated joint angles (10, 31).
A relationship between anthropometric parameters and EMG activity could be assumed, since
it has been shown that anthropometric parameters, such as body height, also have an influence
on the performance parameters of the DL (22). However, it has not been investigated whether
anthropometric parameters have an influence on EMG activity during lower body lifting
exercises. This knowledge is essential for coaches to be able to create programs suitable to the
demands of different sports and to the individual athlete’s needs.
Therefore, the primary purpose of this study is to compare the EMG activity of the GMED,
GMAX, BF, and ES between SLDL and DL at the same relative intensity. Furthermore, the
secondary purpose is to investigate whether there is a relationship between EMG values and
body height. The hypotheses to be reviewed are: (H1) during unilateral SLDL, in comparison to
bilateral DL, significantly higher EMG activity of the muscles GMAX, GMED, and BF can be
measured, while lower activities of the left and right ES can be observed; (H2) there is a
correlation between body height and EMG values for SLDL and DL.
International Journal of Exercise Science http://www.intjexersci.com
188Int J Exerc Sci 14(1): 187-201, 2021
METHODS
Participants
A power analysis was performed with G*Power (Version 3.1.9.2, Universität Kiel, Germany). It
was calculated that a sample size of 16 subjects is sufficient to achieve a statistical power of 95%.
All subjects were male (N = 16) with a mean age, body mass, and height of 31.3 years (SD = 8.9),
80.4 kg (SD = 11.1), and 180 cm (SD = 6.5 cm). All volunteers signed a consent form explaining
the background and risks of the study. At the time of the study, no participants suffered from
pain, illness or injury. To ensure acute habituation to the two exercises, all subjects underwent
a two-month habituation phase in which both exercises were performed at least once a week.
For this purpose, subjects were instructed at least once in the correct execution in preliminary
meetings. In the preceding training, 12-15 repetitions and six to eight repetitions were alternated
evenly, with sessions of six to eight repetitions used regularly to determine the current
maximum load at eight repetitions (8RM). Participants were asked to refrain from lower body
strength training for 48 hours before testing to exclude possible fatigue effects. The local ethics
commission confirmed that the requirements of the Declaration of Helsinki were met. This
research was carried out fully in accordance to the ethical standards of the International Journal
of Exercise Science (30).
Protocol
A Within-Subject design was used to compare the neuromuscular activity of the GMAX, GMED,
BF and ES during the SLDL and DL with the respective 8RM (27, 36). The right leg was examined
electromyographically during both exercises. The individual 8RM load was determined in the
last training session, which took place at least 48 hours before the measurement. To ensure
identical electrode placement, the EMG data of both exercises were recorded in the same run.
The order in which these exercises were performed was randomized between subjects to ensure
nonbiasing of data (21).
EMG amplitude measured during exercise execution was recorded for the GMAX, GMED, and
BF of the right leg, and left and right strand of the ES. Since these muscles are primarily
responsible for execution of the tested movements and allow comparison with other studies in
which the EMG amplitude was investigated in one-leg exercises (3, 11, 12, 26, 27) and DL (1, 13),
they were specifically selected. Preparation of the skin and the placement of the electrodes were
carried out according to the specifications of the SENIAM Project (15). The first four electrodes
were attached in the prone position; for the GMAX, halfway between the os sacrum and the
greater trochanter; for the BF, halfway between the tuber ischiadicum and the lateral condyle
tibiae; for the left and right strand of the ES, two finger widths each from the spinosus L1
process. The fifth electrode for the GMED was placed in the lateral position, halfway between
the greater trochanter and the iliac crest. The corresponding sites were first marked, shaved, and
cleaned with 70% isopropanol. Electrodes were then placed on the middle of the muscle belly,
parallel to the orientation of the muscle fibers. For stronger fixation, electrodes were additionally
covered with Fixomull® Stretch patches.
International Journal of Exercise Science http://www.intjexersci.com
189Int J Exerc Sci 14(1): 187-201, 2021
For testing, a standard 20kg Olympic weightlifting barbell, as well as solid rubber bumper plates
with a disc diameter of 450mm according to the IWF standard, was used. Prior to the testing,
the subjects completed a warm-up program consisting of a 5-minute dynamic stretching
followed by 2x8 repetitions at increasing loads of 30% and 50% of their 8RM with a 1-minute
break in between (26, 27). For the SLDL, warm-ups were executed successively with the left and
right leg, although measurement was taken from the right side only. Pauses of 5 minutes were
assigned between measurements to avoid fatigue (6, 13). Five repetitions per exercise were
recorded electromyographically (18). Through the use of acoustic timer signals (Gymboss®
Interval-Timer), the controlled execution of the concentric/eccentric movement phase and
pause between repetitions was normalized to four seconds per repetition (13, 21). This
procedure was deliberately chosen to ensure a higher comparability of the integrated EMG
signals, as the IEMG shows a more reliable relationship to produced force (32). A pause of
approximately two seconds was inserted between the repetitions to separate the EMG data of
the individual repetitions (13). The measurements were performed barefoot to exclude any
potential influences of different footwear (2, 34). Furthermore, no supporting equipment was
used (e.g. weightlifting belts, pulling-aids). The foot position during DL was self-selected.
Because the motion sequence of the SLDL has not been described in detail in any known
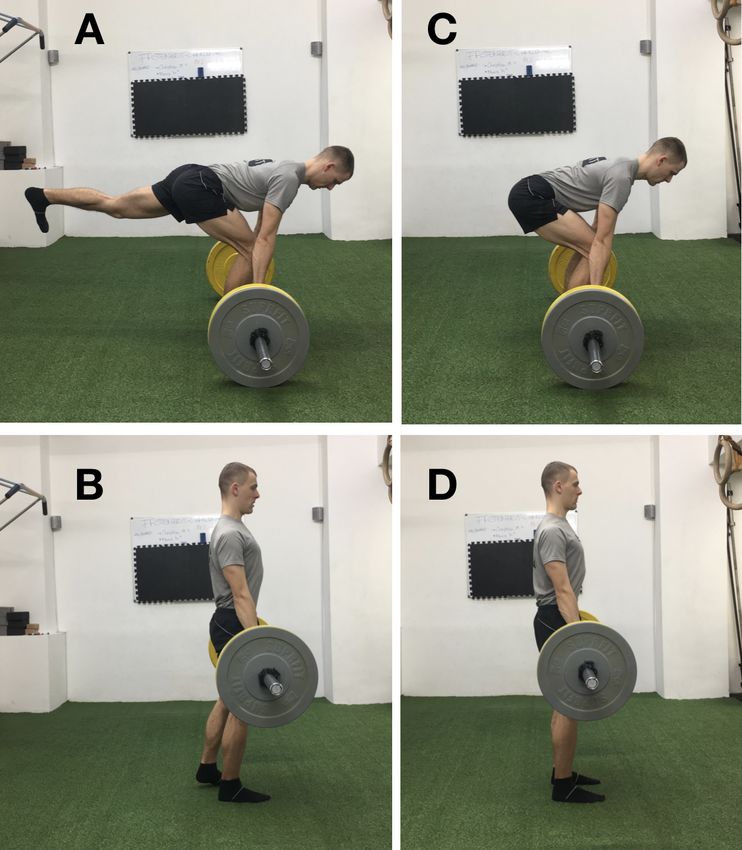
publication so far, it is described in more detail below. Participants began in an upright, offset
position, with the support leg positioned centrally in front of the barbell. From here on the
starting position was adopted (Figure 1, A).
The standing leg side was bent at the knee and hip, while the back was kept extended. The knee
of the standing leg was bent only as far as it was needed to maintain a straight back. A posture
with the upper body parallel to the ground is optimal, as a larger flexion angle of the knee
impairs the close, upward movement of the barbell. The unloaded straight leg was extended
behind the body to counterbalance the forward bending of the upper body. The barbell was
gripped with both hands (pronated) at shoulder width and the back was brought into a
pretension by activating the latissimus dorsi muscle, the abdominal muscles, and by retracting
the shoulder blades. In the concentric phase, the upper body was straightened until the standing
leg hip was completely extended (Figure 1, B). The barbell was pulled upwards as close as
possible to the knee in order to keep the load arm shortest at the hip rotation axis. The straight
rear leg was moved along with the extended hip and in extension of the back so that, in the
upright end position, it was almost at the level of the standing leg; the front foot was allowed to
be set down on the floor briefly for stabilization. To complete the repetition, the buttocks and
the abdomen were tensed so that the lumbar spine was in a neutral position. Following a brief
isometric holding time in the upper end position, eccentric downward movement was initiated
back to the starting position and the weight was lowered to the ground in a controlled manner
as close to the body as possible.
International Journal of Exercise Science http://www.intjexersci.com
190Int J Exerc Sci 14(1): 187-201, 2021
Figure 1. Start- and end positions of SLDL (A, B) and DL (C, D)
Following both measurements, the maximal-voluntary-isometric-contraction (MVIC) test was
performed after a 5-minute rest period to normalize the recorded EMG data. The MVIC tests
were carried out after testing, as in the previous EMG DL studies (1, 12, 13), because participants
were warmed up but not fatigued. For each muscle, two MVIC tests with one-minute rest
intervals were performed in randomized order to minimize errors due to accumulated fatigue
(21). Test subjects were instructed to build up maximal tension over three seconds and maintain
it for five seconds. Subjects were verbally encouraged by the researchers to increase motivation.
Measurement recording was paused during exercise and position changes. The GMAX, BF, and
strands of the ES on both sides were tested manually by the examiner with participants in prone
position. The MVIC of the GMAX was performed with knee angled at 90°, with participants
extending the hip against resistance at the distal end of the thigh (9). For the BF, the pelvis was
secured with a knee flexion of approx. 30°. From this position, participants bent the knee against
resistance at ankle level (1). The testing of the ES started from a slight hyperextension. The test
subjects should tighten with maximum force against the fixation on the shoulder girdle. GMED
was tested in a lateral position with approx. 25-30° abduction in the hip joint against the
resistance of the examiner at the knee and foot (4).
Raw EMG signal was recorded using a wireless SEMG (Delsys® Trigno™, Boston, MA). The
system signal bandwidth was 20-450Hz with a range of 20Hz. The transmission frequency was
2.4GHz and the Common-Mode-Rejection-Ratio (CMRR) was > 80dB. EMGworks® Acquisition
(Delsys, Natick, MA, USA) was used to record the EMG raw data. The EMG data was imported
into the analysis software EMGWorks Analysis for further processing. Raw EMG baseline was
checked for a possible shift within the program using the Remove-Mean-Calculation. The mean
concentric, eccentric, and combined EMG values were then calculated using the RMS calculation
International Journal of Exercise Science http://www.intjexersci.com
191Int J Exerc Sci 14(1): 187-201, 2021
for the three middle repetitions with a sliding window length of 50ms. The mean EMG
amplitudes for each repetition were calculated for concentric, eccentric, and combined
movement phases. Mean values for each muscle and contraction type were calculated in Excel
(Microsoft, Redmond, WA, USA) from the amplitude values of the three middle repetitions. An
RMS with a window length of 500ms was calculated for each MVIC test. The highest of the two
mean amplitude values was used as the reference value for MVIC normalization.
Statistical Analysis
The dependent variables were the normalized EMG values for the SLDL and DL exercises. The
independent variables were contraction type (eccentric, concentric, or combined) and the
respective muscle being studied (GMAX, GMED, BF, left/right ES). Both independent variables
were Within-Subject (repeated measurement) variables. The statistical calculations to check for
significant differences between dependent variables were performed in Excel. The Statistics
Package for Social Sciences (Version 25.0; IBM Corporation, New York, USA) was used for
testing for normal distribution and to calculate the bivariate correlation coefficients. Testing for
normal distribution was performed with the Kolmogorov-Smirnov and the Shapiro-Wilk test.
Subsequently, the two-sample t-Test for dependent samples measured differences between the
normalized EMG measurement pairs. All tests were carried out at the two-sided significance (p
< 0.05 and p < 0.01). Cohen's d effect size was calculated to determine the size and relevance of
the statistical difference.
The correlation coefficient according to Bravais-Pearson examined the relationship between
body height and normalized EMG values.
RESULTS
Out of initially 16 subjects, 15 completed the study; one subject discontinued the experiment due
to muscular hardening and subsequent pain. Means of the individual 8RM loads for DL and
SLDL were 112.8kg (SD = 24.2) and 62.7kg (SD = 16.0) respectively.
The EMG data for the MVIC normalized RMS values for the concentric, eccentric, and combined
movement phases are reported in Tables 1–3. In the concentric phase, with the exception of the
GMAX (p = 0.25; ES = 0.3) and right strand of the ES (p = 0.061; ES = −0.5), the EMG activities
for DL and SLDL differ significantly.
Table 1. Concentric mean EMG activity (mean values ± SD [%] of MVIC)
Muscle Unilateral Bilateral Delta p ES
GMED 77.6 ± 20.3 59.3 ± 22.7 18.3 p = 0.002 1.0
ES RIGHT 66.2 ± 22.3 75.5 ± 17.4 –9.3 p = 0.061 –0.5
ES LEFT 67.4 ± 20.0 82.7 ± 26.8 –15.3 p = 0.004 –0.9
BF 82.1 ± 30.9 74.2 ± 28.8 7.9 p = 0.041 0.6
GMAX 91.7 ± 28.2 85.7 ± 29.2 6.0 p = 0.25 0.3
International Journal of Exercise Science http://www.intjexersci.com
192Int J Exerc Sci 14(1): 187-201, 2021
Table 2. Eccentric mean EMG activity (mean values ± SD [%] of MVIC)
Muscle Unilateral Bilateral Delta p ES
GMED 55.3 ± 15.5 29.5 ± 14.9 25.9 p < 0.001 2.3
ES RIGHT 45.7 ± 13.0 62.4 ± 13.8 –16.7 p < 0.001 –1.1
ES LEFT 47.3 ± 15.1 65.6 ± 19.8 –18.3 p < 0.001 –1.1
BF 50.0 ± 15.9 37.3 ± 18.1 12.7 p < 0.001 1.2
GMAX 46.9 ± 10.9 28.7 ± 9.8 18.2 p < 0.001 1.7
Table 3. Combined mean EMG activity (mean values ± SD [%] of MVIC)
Muscle Unilateral Bilateral Delta p ES
GMED 68.1 ± 17.2 47.8 ± 19.3 20.3 p < 0.001 1.4
ES RIGHT 56.8 ± 17.3 69.8 ± 15.3 –13.0 p = 0.009 –0.8
ES LEFT 58.7 ± 16.5 76.1 ± 23.2 –17.4 p = 0.001 –1.1
BF 68.9 ± 24.8 60.2 ± 25.2 8.7 p = 0.014 0.7
GMAX 73.4 ± 19.5 65.6 ± 20.0 7.8 p = 0.045 0.6
Integrated EMG values of the concentric phase differed significantly for all investigated muscles
and are listed in Table 4.
Table 4. Concentric mean IEMG activity (mean ± SD)
Muscle Unilateral Bilateral Delta (%) p ES
GMED 365 ± 111 209 ± 74 42.8 p < 0.001 1.6
ES RIGHT 446 ± 148 554 ± 207 –24.2 p = 0.011 –0.8
ES LEFT 428 ± 134 529 ± 183 –23.7 p = 0.011 –0.8
BF 542 ± 178 428 ± 135 21.1 p = 0.002 1.0
GMAX 309 ± 146 260 ± 147 15.9 p = 0.001 1.0
The correlations of body height, and NEMG values for the SLDL are shown in Tables 5–7 and
for the DL in Tables 8–10. With the exception of the GMED, the SLDL showed a significant
influence of body height on the concentric NEMG values. Body height correlated negatively
with the concentric NEMG activity of the ES (r = −0.54 to –0.58), the BF (r = −0.63) and the GMAX
(r = −0.85), meaning that subjects with a lower body height displayed higher NEMG activity.
With DL, there was a negative association between body height and concentric NEMG values
only for BF (r = −0.59) and GMAX (r = −0.7).
International Journal of Exercise Science http://www.intjexersci.com
193Int J Exerc Sci 14(1): 187-201, 2021
Table 5. Pearson correlations SLDL (concentric)
Body Height Contraction GMED ES right ES left BF GMAX
r 1 Time
.142 .102 –.579* –.537* –.630* –.851**
Body Height
p .613 .718 .024 .039 .012 .000
Contraction r .142 1 .033 –.490 –.407 –.033 –.404
Time p .613 .907 .064 .133 .906 .135
r .102 .033 1 –.229 –.346 –.158 .132
GMED
p .718 .907 .412 .207 .574 .638
r –.579* –.490 –.229 1 .734** .602* .754**
ES right
p .024 .064 .412 .002 .018 .001
r –.537 * –.407 –.346 .734** 1 .704** .687**
ES left
p .039 .133 .207 .002 .003 .005
r –.630 * –.033 –.158 .602* .704** 1 .648**
BF
p .012 .906 .574 .018 .003 .009
r –.851 ** –.404 .132 .754** .687** .648** 1
GMAX
p .000 .135 .638 .001 .005 .009
*. Level of significance: 0.05 (2-tailed)
**. Level of significance: 0.01 (2-tailed)
Table 6. Pearson correlations SLDL (eccentric)
Body Height Contraction GMED ES right ES left BF GMAX
r 1 Time
–.074 .120 –.582* –.199 –.490 –.469
Body Height
p .793 .670 .023 .478 .064 .078
Contraction r –.074 1 .202 –.196 .211 –.126 .244
Time p .793 .470 .483 .451 .655 .380
r .120 .202 1 .093 –.247 –.033 .674**
GMED
p .670 .470 .741 .374 .906 .006
r –.582 * –.196 .093 1 .469 .374 .432
ES right
p .023 .483 .741 .078 .169 .108
r –.199 .211 –.247 .469 1 .252 .054
ES left
p .478 .451 .374 .078 .366 .847
r –.490 –.126 –.033 .374 .252 1 .343
BF
p .064 .655 .906 .169 .366 .211
r –.469 .244 .674** .432 .054 .343 1
GMAX
p .078 .380 .006 .108 .847 .211
*. Level of significance: 0.05 (2-tailed)
**. Level of significance: 0.01 (2-tailed).
International Journal of Exercise Science http://www.intjexersci.com
194Int J Exerc Sci 14(1): 187-201, 2021
Table 7. Pearson correlations SLDL (combined)
Body Height Contraction GMED ES right ES left BF GMAX
r 1 Time
.043 .113 –.616* –.443 –.619* –.852**
Body Height
p .878 .690 .015 .098 .014 .000
Contraction r .043 1 .303 –.304 –.149 –.248 –.041
Time p .878 .273 .270 .597 .373 .883
r .113 .303 1 –.175 –.342 –.101 .201
GMED
p .690 .273 .533 .213 .720 .473
r –.616* –.304 –.175 1 .657** .592* .737**
ES right
p .015 .270 .533 .008 .020 .002
r –.443 –.149 –.342 .657** 1 .631* .540*
ES left
p .098 .597 .213 .008 .012 .038
r –.619 * –.248 –.101 .592* .631* 1 .674**
BF
p .014 .373 .720 .020 .012 .006
r –.852 ** –.041 .201 .737** .540* .674** 1
GMAX
p .000 .883 .473 .002 .038 .006
*. Level of significance: 0.05 (2-tailed)
**. Level of significance: 0.01 (2-tailed)
Table 8. Pearson correlations DL (concentric)
Body Height Contraction GMED ES right ES left BF GMAX
r 1 Time
–.114 .146 –.426 –.209 –.587* –.698**
Body Height
p .685 .603 .113 .455 .021 .004
Contraction r –.114 1 –.077 .210 .278 .417 –.150
Time p .685 .786 .453 .316 .122 .595
r .146 –.077 1 –.135 –.035 –.001 .116
GMED
p .603 .786 .632 .902 .996 .680
r –.426 .210 –.135 1 .828** .651** .229
ES right
p .113 .453 .632 .000 .009 .411
r –.209 .278 –.035 .828** 1 .578* .044
ES left
p .455 .316 .902 .000 .024 .878
r –.587 * .417 –.001 .651** .578* 1 .423
BF
p .021 .122 .996 .009 .024 .117
r –.698 ** –.150 .116 .229 .044 .423 1
GMAX
p .004 .595 .680 .411 .878 .117
*. Level of significance: 0.05 (2-tailed)
**. Level of significance: 0.01 (2-tailed)
International Journal of Exercise Science http://www.intjexersci.com
195Int J Exerc Sci 14(1): 187-201, 2021
Table 9. Pearson correlations DL (eccentric)
Contraction
Body Height GMED ES right ES left BF GMAX
Time
r 1 –.058 .103 –.458 –.145 –.353 –.712**
Body Height
p .837 .715 .086 .606 .197 .003
Contraction r –.058 1 –.235 –.207 .014 –.376 .527*
Time p .837 .400 .458 .961 .168 .043
r .103 –.235 1 .155 .282 .337 –.249
GMED
p .715 .400 .582 .308 .220 .370
r –.458 –.207 .155 1 .867** .558* .249
ES right
p .086 .458 .582 .000 .031 .371
r –.145 .014 .282 .867** 1 .396 .220
ES left
p .606 .961 .308 .000 .144 .431
r –.353 –.376 .337 .558* .396 1 –.125
BF
p .197 .168 .220 .031 .144 .656
r –.712** .527* –.249 .249 .220 –.125 1
GMAX
p .003 .043 .370 .371 .431 .656
*. Level of significance: 0.05 (2-tailed)
**. Level of significance: 0.01 (2-tailed)
Table 10. Pearson correlations DL (combined)
Body Height Contraction GMED ES right ES left BF GMAX
r 1 Time
–.238 .139 –.460 –.200 –.524* –.763**
Body Height
p .393 .622 .084 .474 .045 .001
Contraction r –.238 1 –.166 .064 .008 .184 .339
Time p .393 .555 .819 .977 .512 .216
r .139 –.166 1 –.050 .076 .104 .041
GMED
p .622 .555 .859 .788 .713 .885
r –.460 .064 –.050 1 .875** .712** .312
ES right
p .084 .819 .859 .000 .003 .258
r –.200 .008 .076 .875** 1 .591* .128
ES left
p .474 .977 .788 .000 .020 .649
r –.524* .184 .104 .712** .591* 1 .425
BF
p .045 .512 .713 .003 .020 .114
r –.763 ** .339 .041 .312 .128 .425 1
GMAX
p .001 .216 .885 .258 .649 .114
*. Level of significance: 0.05 (2-tailed)
**. Level of significance: 0.01 (2-tailed).
DISCUSSION
The concentric EMG activity of GMED and BF was higher in the SLDL than in the DL. For the
GMED, BF, and GMAX, eccentric and combined EMG activity and the concentric IEMG activity
during SLDL were higher than for the DL with the exception of the concentric activity of GMAX.
Furthermore, with the exception of the concentric EMG activity of the right strand, the EMG
activity of ES in all phases and the concentric IEMG activity were significantly higher in DL than
in SLDL. Therefore, these findings support H1.
International Journal of Exercise Science http://www.intjexersci.com
196Int J Exerc Sci 14(1): 187-201, 2021
For the SLDL there was a negative correlation between body height and concentric NEMG
values of the ES (both sides), BF, and GMAX. The body height also correlated negatively with
the combined NEMG values for the right ES, BF, and GMAX. In the eccentric phase, only the
NEMG values of the right ES correlated negatively with body height. During the DL, there was
a negative correlation between body height and concentric and combined NEMG values of the
BF and GMAX and the eccentric NEMG values of the GMAX. Both exercises in the case of the
aforementioned muscles were in accordance with H2.
In this study, the presence of a BLD in the EMG during free resistance (16) lower limb exercises
could be demonstrated with the example of the SLDL and DL using the same relative intensities
(8RM). For SLDL, significantly higher concentric NEMG activity of the GMED and BF could be
measured in contrast to the DL (18.3 % and 7.9 %). Also, the mean EMG activity of the GMAX
for the SLDL was higher by 6% than for the DL, yet the difference was not significant. These
results are consistent with other studies that previously demonstrated BLD in force in machine-
guided combined knee and hip extension (23, 37, 38). However, only Magnus and Farthing
recorded the EMG activity and could not detect any BLD in the EMG (23).
Since the DL has already been electromyographically investigated in other studies, the EMG
values of the present study can be compared with the results of other studies. Camara et al. (6)
found comparable NEMG values for the BF (concentric: 83.3%, SD = 9; eccentric 34.7%, SD = 11)
and for the ES (concentric: 98.9%, SD = 26; eccentric: 75.3%, SD = 28). Andersen et al. (1) reported
slightly higher combined NEMG values for the GMAX (95%, SD = 15), ES (90%, SD = 18) and BF
(101%, SD = 21), although the measurements were performed using a 1RM load. In contrast,
using a 12RM load, Escamilla et al. (13) identified lower combined NEMG values for the GMAX
(35%, SD = 27), ES (32%, SD = 19) and BF (28%, SD = 19),
Considering these results, it is also worth mentioning that it had previously been doubted
whether the mechanisms of the BLD could contribute to a higher training stimulus in free
unilateral leg exercises than in bilateral leg exercises (16). Since unilateral exercises are generally
more unstable than bilateral exercises, Howe et al. (16) speculated that the potential benefits
associated with the BLD could be offset by the higher instability of free single-leg exercises.
Indeed, some studies have shown that the EMG activity of agonists and force production during
strength exercises under unstable conditions is sometimes lower, whereas the EMG activity of
stabilizing synergists increases (2). However, the results of this investigation suggest the
opposite, as both the activities of the agonists and those of the synergists and the absolute loads
per leg were higher in the SLDL than in the DL.
To date, no studies investigated the EMG activity of the GMED during the DL, presumably
because the muscle is attributed a predominantly stabilizing function, and a lower need for
stabilization can be assumed for bilateral exercises. More surprising are the concentric NEMG
values recorded in our study, which amounted to 59.3% (SD = 22.7) and differed from the
concentric NEMG values in the SLDL only with an effect strength of 1.0 (77.6%, SD = 20.3).
International Journal of Exercise Science http://www.intjexersci.com
197Int J Exerc Sci 14(1): 187-201, 2021
One of the primary goals of fitness coaches is to increase the strength and performance of their
athletes while minimizing the risk of injury during training. In this context, it has been argued
that lower back strength is the weakest link in DL, which is why powerlifting at maximum
strength often results in a rounded lumbar spine (5, 19, 29). However, under high loads, flexion
of the lumbar spine represents a risk of injury to the lower back (7). Based on the use of lower
loads, unilateral lower body exercises would have the advantage of avoiding the potential
limitation of the lower back (5, 19). Although, ES EMG activity was lower during SLDL (between
-9.3% and -18.3%; ES: between -0.5 and -1.1), a larger difference would have been expected in
view of the significantly lower loads during the SLDL. One possible cause for the small relative
differences in EMG activity of the ES could be due the inclination angles of the trunk. Both
exercises differ in the angle of inclination of the torso in the starting position. During the SLDL,
the torso was approximately parallel to the ground, while the DL requires a more upright torso
position. Participants had to increasingly bend their knee to ensure that the torso remained
horizontal. This peculiarity of the SLDL could have contributed to an elongation of the load arm
and thus increase the torques at the facet joints of the lumbar spine, which could lead to the
observed ES EMG values. Camara et al. (6) also confirm that the torso angle of the DL can
influence the EMG activity of the ES. In their investigation EMG activity of the ES was
significantly higher in the DL during the eccentric movement phase than in the Hexagon-Barbell
DL (75.3%, SD = 28 vs. 61.4%, SD = 21), whereas the difference in the concentric movement phase
was 10.9% but not statistically significant (98.9%, SD = 26 vs. 88.0%, SD = 27). Whether
significant differences in joint angles contributed to higher EMG values and absolute loads per
leg in the SLDL cannot be conclusively assessed, as kinematic parameters were not recorded.
Furthermore, a negative correlation was found for the height and concentric NEMG values of
the BF and GMAX for both exercises, as well as for the ES in the SLDL. An explanation for the
negative correlation of the BF might be that, due to the shorter distance to the barbell, athletes
with a smaller body height were able to perform the movement with less knee flexion. This
could have brought the BF closer to its optimal muscle length for maximum force production,
which is about 30° knee flexion (40), and is also used for the MVIC test (1). Escamilla et al. (13)
examined the NEMG activity as a function of knee joint angle during different DL variants and
indicated that the activity rises from approximately 20% at around 85° to over 55% in the joint
area between 40 and 30° and is still approximately 50% close to full knee extension. For the
GMAX, differences in the hip joint angle may explain the strong negative correlation between
body height and concentric NEMG activity. Measurements have shown that the MVIC-EMG
activity of the GMAX increases with hip extension (17, 40), which may have resulted in
participants of smaller height being able to start from a larger hip angle in both exercises and
therefore show higher NEMG values. For both BF and GMAX, the negative correlation was
higher in the unilateral condition compared to the bilateral condition (−0.63 vs. −0.59 and −0.85
vs. −0.7), although this difference was small. Somewhat surprising is the high negative
correlation between height and concentric NEMG activity of the left and right ES during the
SLDL. One may assume that a smaller body height influences the torso angle of inclination in
favor of a shorter load arm and, therefore, lower strength requirements, resulting in lower
NEMG values. An explanation could be that subjects with a lower body height also had BFs
more capable of working closer to the optimal muscle length for maximum power production,
International Journal of Exercise Science http://www.intjexersci.com
198Int J Exerc Sci 14(1): 187-201, 2021
which could have increased the performance of the kinetic chain. In such a case, an unfavorable
joint angle for the BF would be a limiting factor, which leads to the explanation that the NEMG
values of the ES were lower in larger subjects due to the lower realizable loads. It can be assumed
that not only the EMG activity, but also the kinematic parameters (39), depends on the load
used. The results of this study suggest that in future EMG investigations for DL, body size
should also be handled as an influential variable. It can be assumed that the examination of the
influence of arm and leg length as well as the arm length to leg length ratio would also reveal
relevant correlations with the EMG, as already shown by Lockie et al. (22) for various
mechanical parameters. Following the argument that the strength of the back extensors
constitutes a limiting performance factor during the DL (5, 19), it also seems promising to study
the influence of the torso length on kinematic, electromyographic, and mechanical parameters
in DL.
Several limitations of this study require noting. Whether significant differences in the joint
angles contributed to the higher EMG values and the absolute loads per leg in the SLDL cannot
be conclusively assessed, as no kinematic parameters were recorded. The same restriction also
applies to the correlation data presented. In the present study, assumptions about the
underlying joint angles were only made on the basis of the observed correlations. It would
therefore be instructive to investigate in future studies to what extent individuals adapt their
technique to variations of the DL depending on their anthropometric characteristics on the basis
of kinematic parameters. Since only men were tested in the present study, it would be necessary
to check in the following studies whether these findings are comparable with those of a female
subject group. The fact that in this study no connection between body height and absolute
bilateral and unilateral 8RM loads could be ascertained could also be attributed to the small
sample size and the high-performance heterogeneity. Therefore, this question should be
examined in a more homogeneous sample in the future (e.g. weightlifters).
ACKNOWLEDGEMENTS
The authors would like to thank all participants for their time and support in assisting with this
study.
REFERENCES
1. Andersen V, Fimland MS, Mo D-A, et al. Electromyographic Comparison of Barbell Deadlift, Hex Bar Deadlift,
and Hip Thrust Exercises: A Cross-Over Study. J Strength Cond Res 32(3): 587-593, 2018.
2. Behm DG, Anderson K, Curnew RS. Muscle Force and Activation Under Stable and Unstable Conditions. J
Strength Cond Res 16(3): 416-422, 2002.
3. Bellon C, Leigh S, Suchomel T. A comparison of muscle activation of the lower back and legs between a back
squat and a rear foot elevated split squat exercise: Presented at Conference Papers from the 8th Annual Coaches
and Sport Science College December 13-14, 2013, 2013.
4. Bolgla LA, Uhl TL. Reliability of electromyographic normalization methods for evaluating the hip
musculature. J Electromyogr Kinesiol 17(1): 102-111, 2007.
5. Boyle M. Advanced in functional training: Training techniques for coaches, personal trainers and athletes. s.n.:
Lotus Publ; 2011.
International Journal of Exercise Science http://www.intjexersci.com
199Int J Exerc Sci 14(1): 187-201, 2021
6. Camara KD, Coburn JW, Dunnick DD, Brown LE, Galpin AJ, Costa PB. An Examination of Muscle Activation
and Power Characteristics While Performing the Deadlift Exercise With Straight and Hexagonal Barbells. J
Strength Cond Res 30(5): 1183-1188, 2016.
7. Cholewicki J, McGill SM, Norman RW. Lumbar spine loads during the lifting of extremely heavy weights.
Med Sci Sports Exerc 23(10): 1179-1186, 1991.
8. Comfort P, Graham-Smith P. Training consideration for athletes with lower limb muscle imbalance. Prof
Strength Cond (15): 4-8, 2009.
9. Contreras B, Vigotsky AD, Schoenfeld BJ, Beardsley C, Cronin J. A comparison of two gluteus maximus EMG
maximum voluntary isometric contraction positions. PeerJ 3: e1261, 2015.
10. Currier DP. Maximal isometric tension of the elbow extensors at varied positions. 2. Assessment of extensor
components by quantitative electromyography. Phys Ther 52(12): 1265-1276, 1972.
11. DeForest BA, Cantrell GS, Schilling BK. Muscle Activity in Single- vs. Double-Leg Squats. Int J Exerc Sci 7(4):
302-310, 2014.
12. Distefano LJ, Blackburn JT, Marshall SW, Padua DA. Gluteal muscle activation during common therapeutic
exercises. J Orthop Sports Phys Ther 39(7): 532-540, 2009.
13. Escamilla RF, Francisco AC, Kayes AV, Speer KP, Moorman CT. An electromyographic analysis of sumo and
conventional style deadlifts. Med Sci Sports Exerc 34(4): 682-688, 2002.
14. Gonzalo-Skok O, Tous-Fajardo J, Suarez-Arrones L, Arjol-Serrano JL, Casajús JA, Mendez-Villanueva A.
Single-Leg Power Output and Between-Limbs Imbalances in Team-Sport Players: Unilateral Versus Bilateral
Combined Resistance Training. Int J Sports Physiol Perform 12(1): 106-114, 2017.
15. Hermens HJ, Freriks B, Merletti R, et al. European recommendations for surface electromyography: Results of
the SENIAM Project. 1999.
16. Howe L, Goodwin J, Blagrove R. The integration of unilateral strength training for the lower extremity within
an athletic performance programme; 2014.
17. Inman VT, Ralston HJ, C.M. Saunders JB de, Bertram Feinstein MB, Wright EW. Relation of human
electromyogram to muscular tension. Electroencephalography and Clinical Neurophysiology 4(2): 187-194, 1952.
18. Jones MT, Ambegaonkar JP, Nindl BC, Smith JA, Headley SA. Effects of unilateral and bilateral lower-body
heavy resistance exercise on muscle activity and testosterone responses. J Strength Cond Res 26(4): 1094-1100,
2012.
19. Juan CS. Single‐Leg Training for 2‐Legged Sports: Efficacy of Strength Development in Athletic Performance.
Strength Cond J 23(3): 35-37, 2001.
20. Knapik JJ, Bauman CL, Jones BH, Harris JM, Vaughan L. Preseason strength and flexibility imbalances
associated with athletic injuries in female collegiate athletes. Am J Sports Med 19(1): 76-81, 1991.
21. Konrad P. The ABC of EMG: A Practical Introduction to Kinesiological Electromyography; 2006.
22. Lockie RG, Moreno MR, Orjalo AJ, et al. Relationships Between Height, Arm Length, and Leg Length on the
Mechanics of the Conventional and High-Handle Hexagonal Bar Deadlift. J Strength Cond Res 32(11): 3011-3019,
2018.
23. Magnus CRA, Farthing JP. Greater bilateral deficit in leg press than in handgrip exercise might be linked to
differences in postural stability requirements. Appl Physiol Nutr Metab 33(6): 1132-1139, 2008.
24. Makaruk H, Winchester JB, Sadowski J, Czaplicki A, Sacewicz T. Effects of unilateral and bilateral plyometric
training on power and jumping ability in women. J Strength Cond Res 25(12): 3311-3318, 2011.
25. Manning JT, Pickup LJ. Symmetry and performance in middle distance runners. Int J Sports Med 19(3): 205-
209, 1998.
International Journal of Exercise Science http://www.intjexersci.com
200Int J Exerc Sci 14(1): 187-201, 2021
26. McCurdy K, O'Kelley E, Kutz M, Langford G, Ernest J, Torres M. Comparison of lower extremity EMG
between the 2-leg squat and modified single-leg squat in female athletes. J Sport Rehabil 19(1): 57-70, 2010.
27. McCurdy K, Walker J, Yuen D. Gluteus Maximus and Hamstring Activation During Selected Weight-Bearing
Resistance Exercises. J Strength Cond Res 32(3): 594-601, 2018.
28. McCurdy KW, Langford GA, Doscher MW, Wiley LP, Mallard KG. The effects of short-term unilateral and
bilateral lower-body resistance training on measures of strength and power. J Strength Cond Res 19(1): 9-15, 2005.
29. McGill S. Low back disorders: Evidence-based prevention and rehabilitation. Third edition; 2016.
30. Navalta J, Stone W, Lyons S. Ethical Issues Relating to Scientific Discovery in Exercise Science. Int J Exerc Sci
12(1), 2019.
31. Okada M. Effect of muscle length on surface EMG wave forms in isometric contractions. Eur J Appl Physiol
56(4): 482-486, 1987.
32. Petrofsky JS. Frequency and amplitude analysis of the EMG during exercise on the bicycle ergometer. Europ J
Appl Physiol 41(1): 1-15, 1979.
33. Santana J. Single‐Leg Training for 2‐Legged Sports: Efficacy of Strength Development in Athletic Performance.
Strength and Conditioning Journal. 2001.
34. Shorter K, Lake J, Smith N, Lauder M. Influence of the foot-floor interface on squatting performance. ISBS-
Conference Proceedings Archive. 2011.
35. Speirs DE, Bennett MA, Finn CV, Turner AP. Unilateral vs. Bilateral Squat Training for Strength, Sprints, and
Agility in Academy Rugby Players. J Strength Cond Res 30(2): 386-392, 2016.
36. Stone MH, O'Bryant H, Garhammer J. A hypothetical model for strength training. J Sports Med Phys Fitness
21(4): 342-351, 1981.
37. Taniguchi Y. Relationship between the modifications of bilateral deficit in upper and lower limbs by resistance
training in humans. Eur J Appl Physiol 78(3): 226-230, 1998.
38. Vandervoort AA, Sale DG, Moroz J. Comparison of motor unit activation during unilateral and bilateral leg
extension. J Appl Physiol Respir Environ Exerc Physiol 56(1): 46-51, 1984.
39. Vigotsky AD, Harper EN, Ryan, Contreras B. Effects of load on good morning kinematics and EMG activity.
PeerJ 3: e708, 2015.
40. Worrell TW, Karst G, Adamczyk D, et al. Influence of joint position on electromyographic and torque
generation during maximal voluntary isometric contractions of the hamstrings and gluteus maximus muscles. J
Orthop Sports Phys Ther 31(12): 730-740, 2001.
41. Wyland T, Reyes GF". The implications of unilateral training on performance. International Journal of Exercise
Science: Conference Proceedings 8(1): 23, 2013.
International Journal of Exercise Science http://www.intjexersci.com
201You can also read