Comparison of MultiMap and TSP/CONCORDE for Constructing Radiation Hybrid Maps
←
→
Page content transcription
If your browser does not render page correctly, please read the page content below
Journal of Heredity 2003:94(1):9–13                                                  Ó 2003 The American Genetic Association
DOI: 10.1093/jhered/esg012

Comparison of MultiMap and
TSP/CONCORDE for Constructing
Radiation Hybrid Maps
C. HITTE, T. D. LORENTZEN, R. GUYON, L. KIM, E. CADIEU, H. G. PARKER, P. QUIGNON,
J. K. LOWE, B. GELFENBEYN, C. ANDRE, E. A. OSTRANDER, AND F. GALIBERT
From UMR6061, CNRS, Université de Rennes1, 2 av. Pr. Léon Bernard 35043 Rennes Cedex, France (Hitte, Guyon, Cadieu,
Quignon, Andre, and Galibert) and the Divisions of Clinical Research and Human Biology, Fred Hutchinson Cancer Research
Center, 1100 Fairview Ave. N, D4-100, Seattle WA 98109-1024 (Lorentzen, Kim, Parker, Lowe, Gelfenbeyn, and Ostrander).
We thank Richa Agarwala and Alejandro Schaffer for their help with the TSP/CONCORDE package and for meaningful
discussions. We thank Tara Matise for her help with MultiMap. We gratefully acknowledge the support of the American Kennel

                                                                                                                                  Downloaded from http://jhered.oxfordjournals.org/ by guest on May 11, 2015
Club Canine Health Foundation, the U.S. Army (grant no. DAAD19-01-1-0658; to E.A.O. and F.G.), the National Institutes of
Health (grant no. 1R01CA092167; to E.A.O. and F.G.), and PHS National Research Grant T32 GM07270 (to H.G.P.). R.
Guyon is supported by a fellowship from La Region de Bretagne and L. Kim is supported by a fellowship from Nestlé Purina.
The TSP/CONCORDE package is available at ftp://ftp.ncbi.nih.gov/pub/agarwala/rhmapping/rh tsp map.tar.gz. This paper
was delivered at the Advances in Canine and Feline Genomics symposium, St. Louis, MO, May 16–19, 2002.

Address correspondence to Francis Galibert at the address above, or e-mail: francis.galibert@univ-rennes1.fr.

Abstract
Radiation hybrid (RH) map construction allows investigators to locate both type I and type II markers on a given genome
map. The process is composed of two steps. The first consists of determining the pattern distribution of a set of markers
within the different cell lines of an RH panel. This is mainly done by polymerase chain reaction (PCR) amplification and gel
electrophoresis, and results in a series of numbers indicating the presence or the absence of each marker in each cell line.
The second step consists of a comparison of these numbers, using various algorithms, to group and then order markers.
Because different algorithms may provide (slightly) different orders, we have compared the merits of the MultiMap and
TSP/CONCORDE packages using a data set of information currently under analysis for construction of the canine genome
RH map.

Whole genome map construction is a two-step process:            and RH maps result from a statistical treatment of ex-
molecular data generation and the resulting data analysis       perimental data, and thus depend on the analysis program
(McCarthy 1996). The latter uses computer programs              used as well the underlying parameters used in evaluating
specifically dedicated to the nature of the map under           the data set. As happens frequently, distinct analysis may
construction. There are three different types of genome         yield statistically valid yet distinctly different maps. Even
maps: meiotic linkage, radiation hybrid (RH), and physical.     recomputing the same set of data using an identical setting of
They differ, in part, in the type of markers used to make up    parameters and the same computer program can produce
the map, the method of genotyping, and the presentation of      different versions of a given map (Figure 1).
the results. One of the fundamental differences between
meiotic linkage and RH map construction versus physical
                                                                RH Mapping
maps is in assembly methodology. For a physical map, the
respective position of two markers A and B is not—or            RH maps result from comparing marker distributions within
should not be—affected by the addition of new markers to        collections of hybrid cell lines that were previously obtained
the data set. By comparison, in meiotic linkage and RH map      by fusion of gamma-irradiated cells with heterologous carrier
construction, the addition of new markers to an existing data   cells (Goss and Harris 1975; Vignaux et al. 1999; Walter et al.
set can, and often does, affect the position of previously      1994). Since each viable hybrid contains only a subset, ideally
mapped markers. This is due to the fact that meiotic linkage    25%–35%, of the irradiated genome, markers sharing

                                                                                                                             9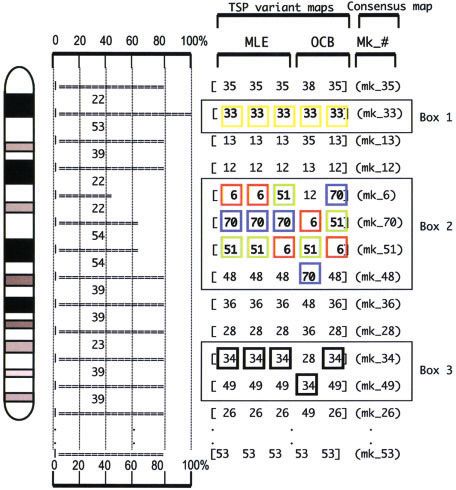
Journal of Heredity 2003:94(1)

                                                                  of each marker to be localized is determined for each cell line
                                                                  of interest by polymerase chain reaction (PCR) amplification
                                                                  using DNA isolated from each cell line in the RH panel. The
                                                                  resulting data set consists of a series of numbers, with 1
                                                                  indicating the presence of a marker in a specific hybrid cell
                                                                  line, 0 its absence, and 2 an uncertain result. Thus the
                                                                  distribution of each marker in the panel is characterized by
                                                                  a sequence of 1, 0, 2, called ‘‘vectors’’ (Cox et al. 1990), as
                                                                  shown in Figure 2.
                                                                      During the second step of map construction, marker
                                                                  retention patterns within the panel are compared using
                                                                  different algorithms. This comparison is performed in two
                                                                  phases. In the former, a two-point analysis assigns markers to
                                                                  RH groups that ultimately will correspond to individual
                                                                  chromosomes. In a well-developed map there will be only
                                                                  one RH group associated with each chromosome. The
                                                                  second phase involves determining the markers order within
                                                                  each RH group. To perform these computations, several
                                                                  computing program packages, including RHMAP, RHMAP-

                                                                                                                                      Downloaded from http://jhered.oxfordjournals.org/ by guest on May 11, 2015
                                                                  PER, and MultiMap, have been made publicly available
                                                                  (Boehnke et al. 1991; Matise et al. 1994; Slonim et al. 1997).

Figure 1. Vectors corresponding to a subset of markers
located on a canine chromosome have been computed 10 times
                                                                  Interpreting RH Maps
with the MultiMap program, changing only the initial pair of      As discussed previously, the end result of RH map con-
markers used for the computation. Comparison of these 10          struction is a graphical representation of the vector distribu-
maps shows that although a given marker is predominantly          tion that most closely fits the results of statistical treatment.
present at each position (i.e., marker 8 is present seven times   Unfortunately, for a given set of vectors, there is no unique
out of 10 in position 1, marker 17 is present three times, and    statistically sound graphical representation. As shown in
marker 13 is present one time), no position is occupied in all    Figure 1, we analyzed the same set of vectors 10 times with
10 maps by the same marker.                                       the MultiMap program (Matise et al. 1994), varying only
                                                                  the initial pair of markers that were used. Comparison
                                                                  of the 10 maps shows they are not exactly the same. For
identical or similar distributions within the RH panel will       instance, the most telomeric marker is marker 8 in six maps,
be identified as being in close physical proximity on the         marker 17 in three maps, and marker 13 in the last map.
chromosome of interest, while markers with a distinct             Figure 1 also shows that marker 12 is mapped at four differ-
distribution pattern are, of necessity, unlinked. During the      ent positions: 2, 3, 11, and 15. Other discrepancies between
first step of RH map construction, the presence or absence        the 10 maps can be detected in Figure 1.

Figure 2. Example of vector suites defining the pattern distribution of markers within an RH panel. The presence of a
marker in a specific cell line is indicated by 1, its absence by 0, and uncertain results by 2.

10
Hitte et al. Comparison of MultiMap and TSP/CONCORDE
General Principles of RH Map Construction
Two methods, classified as nonparametric and parametric,
are widely used in constructing RH maps. Nonparametric
methods utilized by programs such as RHMAP, developed
by M. Boehnke (Boehnke et al. 1991), or a program
developed by A. Ben-Dor (Ben-Dor and Chor 1997) try to
determine the order of markers that minimizes the number
of obligate chromosome breaks (OCB). These data are
calculated by publicly available software based on the
retention pattern of each marker. Parametric methods
(MultiMap, RHMAPPER, RHMAP) (Boehnke et al. 1991;
Matise et al. 1994; Slonim et al. 1997) are based on the
comparison of the likelihood of several locus orders. Starting
with a pair or triplet of markers, parametric approaches carry
out local extension and perform local permutations of
consecutive markers to produce the most likely marker order.
RH Mapping and the TSP Approach
Downloaded from http://jhered.oxfordjournals.org/ by guest on May 11, 2015
In 2000 Agarwala et al. published an RH computation
package using the CONCORDE algorithm, which utilizes
the ‘‘traveling salesman problem’’ (TSP) approach for
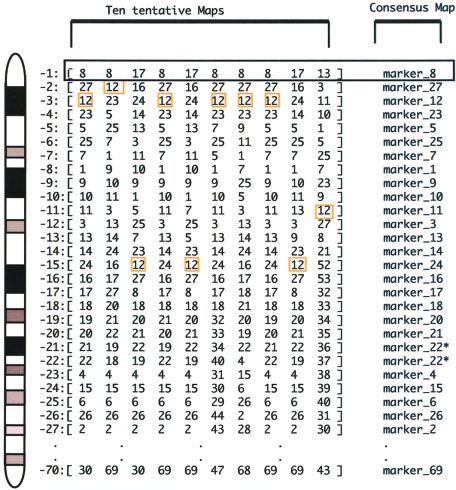
ordering markers within a specific region (Agarwala et al. Figure 3. The vectors grouped to a given chromosome by
2000; Ben-Dor and Chor 1997). In the classic TSP problem, two-point analysis performed with MultiMap were then ordered
one attempts to determine the shortest route by which with TSP/CONCORDE, automatically delivering five maps.
a series of cities can be visited without ever visiting the same Computation running time with the TSP/CONCORDE or the
city twice. In the mathematical adaptation of this problem to MultiMap package approach was found to be equivalent and
genome map construction, the cities correspond to the did not provide an advantage to one or the other approach.
markers and the cost to the distances. The TSP/CON- Results of the comparison of these five maps is shown by the
CORDE algorithm systematically computes five indepen- horizontal bars. When the same marker is present in the five
dent RH maps. Three are variants of the maximum maps at a given position, the horizontal bars have a maximum
likelihood estimate (MLE) approach and two of the OCB length and correspond to mapping positions reaching high
approach. Agarwala et al. (2000) described the TSP/ confidence (i.e., box 1). Map positions occupied by two or
CONCORDE package as an improved option to compute more markers are characterized by shorter horizontal bars (i.e.,
maps, resulting in marker orders with higher MLE and lower boxes 2 and 3). Although, as in box 2, a given marker can
OCB values. In this particular case, the analysis is mostly occupy three different positions, extending the size of the
insensitive to the initial RH data file and the final map orders scrambled region, in box 3 only two adjacent markers exchange
are independent of the initial format of the data set their positions, limiting the zone of uncertainty. Such results
(alphabetical order or reverse, etc.), as marker order is probably reflect the overall resolution of the 5000 rad panel
determined using large neighborhood rearrangements rather used in these experiments.
than local permutations. Thus the work represents a major
step forward in RH mapping software.
We developed an additional feature that evaluates the five
maps and calculates a consensus map. Our method consists
Constructing Canine RH Maps
of determining the frequency of the position of a given
We are presently using the TSP/CONCORDE package to marker over the five variant maps. When the position of
order the 3,270 markers that make up the most recent a marker is concordant between the five maps, the placement
version of the whole-genome canine RH map (Guyon et al., is considered to have a high confidence level and is assigned
in preparation). Figure 3 shows an example of the type of a support score of 100%. By comparison, any marker dis-
results we have obtained thus far. In contrast to the example playing a concordant position in only three maps is assigned
presented in Figure 1, the five TSP maps are derived using a 60% confidence level. We then generate a consensus
both principles—that is, the MLE approach for the first map containing the markers placed at their best position
three maps, which has three independent parameter settings, determined by the position frequency calculated among
and the OCB approach, which has two independent settings the five TSP maps, as represented in Figure 3. Markers
to compute the two OCB maps. In its original presentation, with a high confidence support are very likely to be mapped
the TSP/CONCORDE package (Agarwala et al. 2000) at a robust position, whereas markers present less than
presents the results as five independent maps, systematically three times at the same position in the five maps (less
and automatically generated from the same set of RH data. than 60% confidence support) are considered questionable.
11Journal of Heredity 2003:94(1)
Downloaded from http://jhered.oxfordjournals.org/ by guest on May 11, 2015
Figure 4. (a) TSP/CONCORDE computation results presented with horizontal bars to indicate the level of agreement
between the different maps. The box corresponds to a region of 12 markers where discrepancies between the five maps are
observed. Nevertheless, this region can be subdivided into four definable subregions, indicated by vertical bars, limiting the extent
of the discrepancies. (b) The results obtained by recomputing the 12 boxed markers are shown. Note that recomputation of
a limited number of vectors can result in a higher level of confidence within a regional map.
Occasionally a single marker will be placed at two score than used previously (i.e., 9, 10, or even higher), if the
different positions, revealing a major mapping conflict. Since first one was done at LOD 8. When this is done, more than
presentation of the results as a consensus map is prone to one RH group often results, dividing the chromosome into
mask regions where a certain level of uncertainty exists, we two to three RH groups. These individual RH groups can
include a graphical representation of the best position data often be ordered in a more satisfactory way with TSP/
for each marker. This will allow map users to immediately CONCORDE. Alternatively, or in addition, a two-point
spot regions with high statistical support, as well as those for analysis performed with a higher LOD score threshold might
which less confidence can be obtained. Of interest is that eject markers with dubious vectors, thus facilitating sub-
quite often, even if the scrambled region is made of several sequent correct ordering of the novel RH groups.
markers, it can be subdivided in smaller subregions of two to
four markers (Figure 4a). At this stage it is not necessary to
account for this slight scrambling; all markers have been
typed twice and demonstrate results above a predefined
Conclusion
quality threshold. As shown in Figure 4b, by exclusively It is still too early to judge the merits of the TSP/
recomputing the vectors of the 12 markers present between CONCORDE package in RH mapping relative to other
positions 13 and 25 with the TSP/CONCORDE package, programs such as MultiMap and RHMAPPER, which have
more marker placements are now concordant between the been extensively used for previous map construction. (Avner
five maps. et al. 2001; Breen et al. 2001; Deloukas et al. 1998; Mellersh
One final strategy we propose to use for solving et al. 2000; Murphy et al. 2000; Priat et al. 1998; Stewart
construction problems in difficult regions is to repeat the et al. 1997). However, the advantages we presently perceive
two-point analysis using MultiMap, but with a higher LOD manifest themselves at both map construction and map
12Hitte et al. Comparison of MultiMap and TSP/CONCORDE
utilization levels. During map construction, this program acts Deloukas P, Schuler GD, Gyapay G, Beasley EM, Soderlund C, Rodriguez-
as an automatic alert, highlighting construction problems. Tome P, Hui L, Matise TC, McKusick KB, Beckmann JS, Bentolila S,
Such problems can then be solved by regional recomputing Bihoreau M, Birren BB, Browne J, Butler A, Castle AB, Chiannilkulchai N,
Clee C, Day PJ, Dehejia A, Dibling T, Drouot N, Duprat S, Fizames C,
and identifying problematic vectors. Obviously, as shown
Bentley DR, et al., 1998. A physical map of 30,000 human genes. Science
in Figure 1, several computations of the same vectors can, 282:744–746.
in principle, be done with another program, resulting in
Goss SJ and Harris H, 1975. New method for mapping genes in human
delineation of problematic regions. But then this is done
chromosomes. Nature 255:680–684.
using a unique approach and each time with the same
Matise TC, Perlin M, and Chakravarti A, 1994. Automated construction of
parameter setting. In addition, such multiple computations
genetic linkage maps using an expert system (MultiMap): a human genome
are not made automatically and necessitate a program linkage map. Nat Genet 4:384–90.
adaptation. At the level of map utilization, graphical
McCarthy LC, 1996. Whole genome radiation hybrid mapping. Trends
representation of the five maps and display of the name of
Genet 12:491–493.
the markers immediately tell users what confidence they may
Mellersh CS, Hitte C, Richman M, Vignaux F, Priat C, Jouquand S, Werner
have in the map and where problems may still exist.
P, Andre C, DeRose S, Patterson DF, Ostrander EA, and Galibert F, 2000.
An integrated linkage-radiation hybrid map of the canine genome. Mamm
Genome 11:120–130.
Murphy WJ, Sun S, Chen Z, Yuhki N, Hirschmann D, Menotti-Raymond
References M, and O’Brien SJ, 2000. A radiation hybrid map of the cat genome:
Agarwala R, Applegate DL, Maglott D, Schuler GD, and Schaffer AA, implications for comparative mapping. Genome Res 5:691–702.
Downloaded from http://jhered.oxfordjournals.org/ by guest on May 11, 2015
2000. A fast and scalable radiation hybrid map construction and integration Priat C, Hitte C, Vignaux F, Renier C, Jiang Z, Jouquand S, Cheron A,
strategy. Genome Res 3:350–364. Andre C, and Galibert F, 1998. A whole-genome radiation hybrid map of
Avner P, Bruls T, Poras I, Eley L, Gas S, Ruiz P, Wiles MV, Sousa-Nunes R, the dog genome. Genomics 54:361–378.
Kettleborough R, Rana A, Morissette J, Bentley L, Goldsworthy M, Haynes A, Slonim D, Kruglyak L, Stein L, and Lander E, 1997. Building human
Herbert E, Southam L, Lehrach H, Weissenbach J, Manenti G, Rodriguez-
genome maps with radiation hybrids. J Comput Biol 4:487–504.
Tome P, Beddington R, Dunwoodie S, and Cox RD, 2001. A radiation hybrid
transcript map of the mouse genome. Nat Genet 29:194–200. Stewart EA, McKusick KB, Aggarwal A, Bajorek E, Brady S, Chu A, Fang
N, Hadley D, Harris M, Hussain S, Lee R, Maratukulam A, O’Connor K,
Ben-Dor A and Chor B, 1997. On constructing radiation hybrid maps.
Perkins S, Piercy M, Qin F, Reif Y, Sanders C, She X, Sun W-L, Tabar P,
J Comput Biol 4:517–533.
Voyticky S, Cowles S, Fan J-B, Mader C, Quackenbush J, Myers RM, and
Boehnke M, Lange K, and Cox DR, 1991. Statistical methods for multi- Cox DR, 1997. An STS-based radiation hybrid map of the human genome.
point radiation hybrid mapping. Am J Hum Genet 49:1174–1188. Genome Res 7:422–433.
Breen M, Jouquand S, Renier C, Mellersh CS, Hitte C, Holmes NG, Chéron Vignaux F, Hitte C, Priat C, Chuat JC, André C, and Galibert F, 1999.
A, Suter N, Vignaux F, Bristow AE, Priat C, McCann E, Andre C, Boundy Construction and optimization of a dog whole-genome radiation hybrid
S, Gitsham P, Thomas R, Bridge W, Spriggs HF, Ryder EJ, Curson A,
panel. Mamm Genome 10:888–894.
Sampson J, Ostrander EA, Binns M, and Galibert F, 2001. Chromosome-
specific single-locus fish probes allow anchorage of an 1800-marker Walter MA, Spillett DJ, Thomas P, Weissenbach J, and Goodfellow PN,
integrated radiation-hybrid/linkage map of the domestic dog genome to all 1994. A method for constructing radiation hybrid maps of whole genomes.
chromosomes. Genome Res 11:1784–1795. Nat Genet 7:22–28.
Cox DR, Burmeister M, Price ER, Kim S, and Myers RM, 1990. Radiation
hybrid mapping: a somatic cell genetic method for constructing high-
resolution maps of mammalian chromosomes. Science 250:245–250. Corresponding Editor: William Murphy
13You can also read