Contribution of Remote Sensing Techniques for monitoring Natura 2000 sites
←
→
Page content transcription
If your browser does not render page correctly, please read the page content below
C O N T R I B U T I O N  O F   R E M O T E  S E N S I N G  T E C H N I Q U E S

40             F O R   M O N I T O R I N G  N A T U R A  2 0 0 0   S I T E S

       CHAPTER A.II.

Contribution of Remote Sensing
Techniques for monitoring
Natura 2000 sites

       Sander Mücher & Gerard Hazeu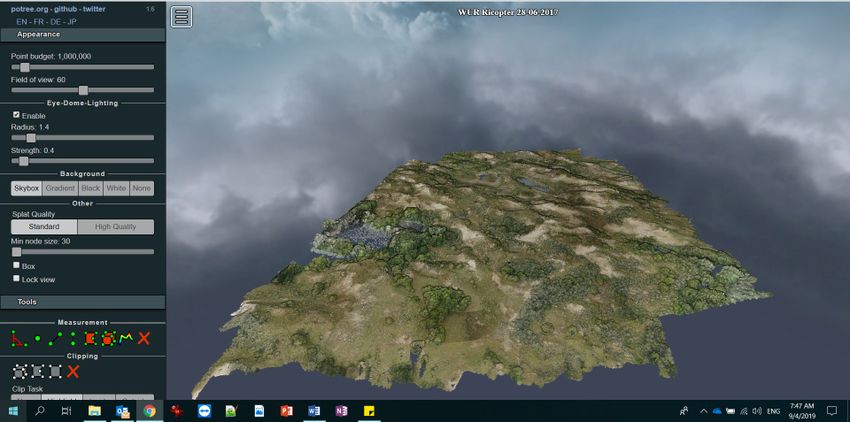
C O N T R I B U T I O N  O F   R E M O T E  S E N S I N G  T E C H N I Q U E S

  41                                     F O R   M O N I T O R I N G  N A T U R A  2 0 0 0   S I T E S

                                                                                                                   Citation
                                                                                                                   Chapter A.II: Mucher, C.A. & Hazeu, G.W. (2021)
II.1 Introduction                                                                                                  Contribution of remote sensing techniques for
                                                                                                                   monitoring Natura 2000 sites. In: Schmidt, A.M. &
Remote sensing is becoming increasingly important in habitat mapping and monitoring due to                         Van der Sluis, T. (2021). E-BIND Handbook (Part A):
the strong synoptic overview of its images in the temporal and spatial domain. Early applica-                      Improving the availability of data and information on
tions pertained to the visual interpretation of aerial photography, but more recently                              species, habitats and sites.
satellite imagery with a huge range of spatial and temporal resolutions is in use that                             The whole document can be downloaded under
increases the applicability from entire ecosystems to specific vegetation types. The                               ecologic.eu/book/improving-the-availability-of-data-
newest developments are the use of UAVs (Unmanned Aerial Vehicles) at the most detailed                            and-information
spatial scale (up to centimeter pixel detail) to support vegetation surveyors. Besides this, more
and more satellite imagery is becoming available as open data, such as the imagery from the
European SENTINELS, next to a much longer tradition in open data policy for American satellite
sensors such as MODIS and Landsat, to widen the opportunities for their applications. Some
vegetation mapping projects apply aerial photographs or remotely sensed imagery only to divide                   Early applications pertained to the visual
the area of interest into homogenous vegetation mapping units that are further labelled in veg-                  interpretation of aerial photography, but more
etation types by field surveyors, while other classification methods produce vegetation or habitat               recently satellite imagery with a huge range of
maps directly from imagery by combining imagery with ground truth data. The latter approach is                   spatial and temporal resolutions is in use that
gaining momentum in light of major technological improvements, but also because it can speed                     increases the applicability from entire ecosystems
up the mapping process compared to traditional methods.                                                          to specific vegetation types.

Traditional vegetation and habitat mapping methods using visual interpretation of aerial
photography in combination with field surveys work very well, but are often labor intensive and
updating frequencies are normally low, while policies are demanding currently higher monitor-
ing frequencies. Therefore terrain managers are looking for alternatives that can support the
mapping and monitoring of vegetation in more efficient ways. New developments in remote
sensing such as very high resolution (VHR) satellite imagery, LiDAR techniques that support the
measuring of the vegetation structure and the application of UAVs that can fly at any request-
ed time and spatial resolution and are not affected by cloud cover, can help to speed up the
process of vegetation mapping and monitoring. Nevertheless, these methods are all quite new
and are not yet that robust that they immediately convince vegetation surveyors and/or terrain
managers who often lack the skills to apply these new methods. Using a mixture of remote
sensing and field methods seems to deliver the best results. This requires ecologists and re-
mote sensing experts to collaborate closely and review the newest methods and technologies.
Some of these technologies and methods are demonstrated below, but first a short introduc-
tion to remote sensing.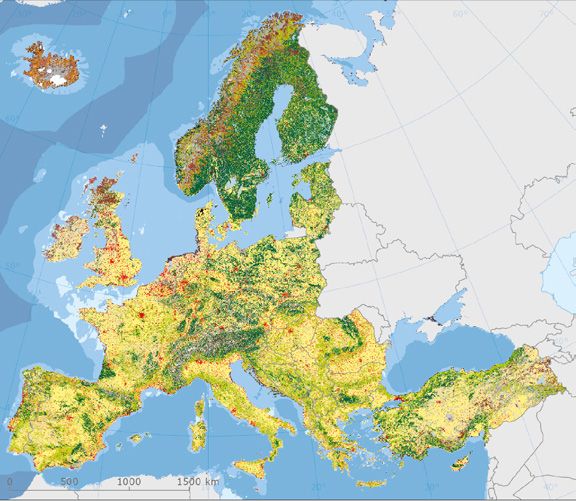
C O N T R I B U T I O N  O F   R E M O T E  S E N S I N G  T E C H N I Q U E S

    42                                    F O R   M O N I T O R I N G  N A T U R A  2 0 0 0   S I T E S

II.1.3 Theory and definition
                                                                                                                  Definition of remote sensing
Remote sensing is the science of obtaining information about an object, an area, or phenomenon                    Remote sensing is the science of obtaining informa-
through the analysis of data acquired by a sensor that is not in contact with the object, area or                 tion about an object, an area, or phenomenon through
phenomenon under investigation (Lillesand et al., 2015). The human eye only detects the reflec-                   the analysis of data acquired by a sensor that is not
tive solar radiance, the part of the electromagnetic range in the band length range 0.4–0.7μm.                    in contact with the object, area or phenomenon under
But remote sensing technology allows for the detection of other reflective and radiant (including                 investigation (Lillesand et al., 2015).
thermal) energy band-length ranges. Sensors can be divided into two broad groups—
passive and active. The earliest example of this is photography. With airborne cameras we
have long been able to measure and record the reflection of light off of earth features. While
aerial photography is still a major form of remote sensing, newer solid state technologies have
extended capabilities for viewing in the visible and near-infrared wavelengths to include longer
wavelength solar radiation as well.

II.1.4 Sensor characteristics and important platforms of remotely
       sensed imagery (spaceborne, airborne [manned & unmanned])
The relevance of remote sensing as a source of information for e.g. grassland monitoring is
conditioned by the following sensor characteristics:

»   spatial resolution – determines the amount of information in a remotely sensed image of
    a given area;

»   temporal resolution – revisit frequency (how often a satellite takes a picture of the same
    area) helps to distinguish abrupt and gradual changes, but also allows an improvement in
    the identification of grassland associations

»   spectral resolution – helps to distinguish between plants of different species and their traits;

Next to the sensor characteristics that determine the application domain, it is very important
to have a good pre-processing line, which includes radiometric calibration including atmospher-
ic correction, and cloud masking. Furthermore you need a good post-processing line, which
includes for example time compositing of products derived from the calibrated satellite imagery:
images can be combined, for example to remove clouds (accumulating images of the same area
to increase chances of cloud free observations) and to create 8-day, monthly and annual com-
posite (of variables such as spectral indices, like NDVI, or variables like fAPAR, SST).

Spatial and temporal resolution
The spatial resolution of spaceborne sensors today ranges from one kilometre to about 40
centimetres (Figure II.1). In general, a distinction is made between:

»   Low Resolution Optical Satellite Data: >= 1km spatial resolution by multi-spectral sensors
    like GOES, Meteosat, NOAA, SPOT-Vegetation.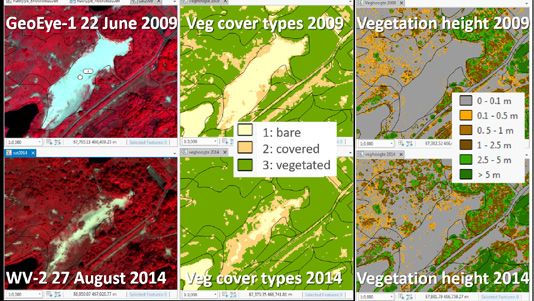
C O N T R I B U T I O N  O F   R E M O T E  S E N S I N G  T E C H N I Q U E S

    43                                                        F O R   M O N I T O R I N G  N A T U R A  2 0 0 0   S I T E S

                                                                                                                                                           Figure II.1
                                                                                                                           RESOLUTION IN METERS
                                     Terrestric survey                                                                                                     Spatial and temporal resolution of satellite sensors.
                                                                                                                    2,5   5,8   10   15   20   23,5   30
                      50 years                                                                     IKONOS                                                  Source: dib.joanneum.ac.at/edtr/satsys.html
                                           Aerial photographs                                   SPOT 5A, ALOS
                       5 years

                                                   Satellite photographs                                IRS 1C/D
                       3 years
    Repetition rate

                                                            SPOT                                      SPOT 4 PAN

                                                                                             SENSOR
                      26 days
                                                                   Landsat-TM                         LANDSAT 7
                       17 days

                                                                           NOAA
                      12 hours                                                                          SPOT MS
                                                                                  METEOSAT
                       30 min                                                                         IRS 1C-LISS

                                 0,1 m   1m     5m       15 m   30 m   1 km   5 km

                                                 Ground resolution

»       Medium Resolution Optical Satellite Data: 80–500m spatial resolution by multi-spectral sen-
        sors like MODIS, Landsat MSS, RESURS-01 (MSU-SK) and IRS-1C (Wide Field Sensor – WiFS).

»       High Resolution Optical Satellite Data: 5–30m spatial resolution by panchromatic or
        multi-spectral sensors or analogue camera systems such as Sentinel-2, Landsat TM, SPOT
        PAN and MS, IRS-1C/D (PAN and LISS), KFA 1000, MK4, etc.

»       Very High Resolution (VHR) Optical Satellite Data: 1–4m spatial resolution by panchromat-
        ic or multi-spectral sensors, e.g. Worldview-2 and Quickbird with half a meter resolution for
        panchromatic band and 2m for the multi-spectral bands.

See also Annex I for a long list of satellite sensors and their characteristics.

Airborne sensors can be distinguished in manned and unmanned sensors (better known as
drones) and commonly have spatial resolutions between 40cm and 1cm.

There is a clear trade-off between spatial and temporal resolution. The higher the temporal
resolution the lower the spatial resolution. The European Space Agency (ESA) is developing
five new missions called Sentinels specifically for the operational needs of the European GMES
programme. The Sentinel missions are based on a constellation of two satellites to fulfil revisit
and coverage requirements, providing robust datasets for GMES Services. The Sentinels were
launched from 2013 onwards. The mission orbits at a mean altitude of approximately 800 km
and, with the pair of satellites in operation, has a revisit time of five days at the equator (under
cloud-free conditions) and 2–3 days at mid-latitudes (source: www.esa.int/Our_Activities/Observ-
ing_the_Earth/GMES/Overview4).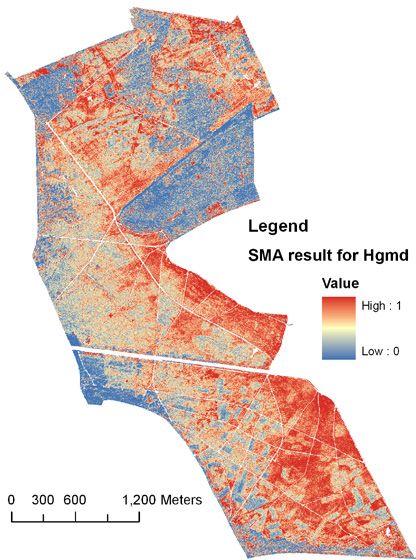
C O N T R I B U T I O N  O F   R E M O T E  S E N S I N G  T E C H N I Q U E S

  44                                                     F O R   M O N I T O R I N G  N A T U R A  2 0 0 0   S I T E S

Spectral resolution
An example of a typical spectrum for photosynthetic (green) vegetation is given in Figure II.2,
but characteristic spectra relevant to land cover and habitat mapping are also available for
non-photosynthetic (brown) vegetation, soils, water (in liquid and frozen form), bare areas and
urban surfaces.

Within the vegetation (photosynthetic) spectra, characteristic features include the green peak,
red edge and near infrared (NIR) plateau with absorption features (relating to moisture content)
evident in the latter and also in the short-wave infrared (SWIR) wavelength regions. Reflectance
in the visible regions is primarily a function of pigment concentrations in foliage whilst in the
NIR and SWIR, the internal leaf structure and moisture content of the leaves respectively influ-
ence reflectance (Swain & Davis, 1978). In all cases, it should be noted that the reflectance of
vegetation canopies is different from of individual components (e.g. leaves, branches), because
of the different contributions to the reflectance from plant materials and also the underlying
surface and shadowing as a function of canopy heterogeneity, which particularly influences the
NIR and SWIR wavelength regions. The loss of pigments, cell structure and moisture content
during senescence of leaves leads to the loss of most of the characteristic features of green
leaves (with the exception of the water absorption features) and the transition to the spectral
curve typical of non-photosynthetic vegetation.

                                      Photosynthetic
                                                                                                                                      Figure II.2
                                                               Structure                         Water content                        Typical spectra for vegetation highlighting the main
                                        Pigments
                                                                                                                                      contributors to reflectance.

                            0.50
                                      Chlorophyll                                                  Water Absorption
                            0.45
                                      Absorption
                            0.40

                            0.35
              reflectance

                            0.30

                            0.25

                            0.20

                            0.15

                            0.10

                            0.05

                            0.00
                                400        600         800    1000         1200   1400    1600     1800          2000   2200   2400

                                                                                  wavelength

                                          VIS                 NIR                                         SWIR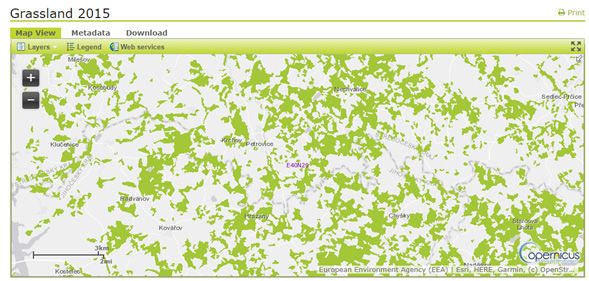
C O N T R I B U T I O N  O F   R E M O T E  S E N S I N G  T E C H N I Q U E S

  45                                      F O R   M O N I T O R I N G  N A T U R A  2 0 0 0   S I T E S

A large number of studies have used spectral reflectance data to differentiate plant species and
communities on the basis of differences in spectral reflectance, with this being attributed largely
to differences in foliar chemistry, the internal structure of leaves, moisture content and the
overall canopy structure (e.g. in terms of shadowing and relative amounts of plant components
(e.g. leaves, branches). As examples, Lucas et al., (2008) extracted reflectance spectra (based
on CASI data) from the sunlit portions of delineated tree crowns in Australia savannas, discrim-
inating species of Callitris, Eucalyptus, Acacia and Angophora through discriminant analysis. Lu
et. al., (2009) used hyper-spectral data to map the distribution of two spectrally similar grasses
(Miscanthus sacchariflorus and Phragmites australis) in Japan on the basis of subtle differences
in canopy density, leaf and canopy structure as well as biochemical properties. The benefits of
using hyper-spectral data for mapping aquatic vegetation (e.g., different species of Spartina in
San Francisco Bay, USA; Rosso et al., 2005), identifying and mapping invasive species (e.g. Ustin
et al., 2004; Hestir et al., 2008; Walsh et al., 2008; He et al., 2011); and differentiating between
trees of the same species that are of different ages and sizes have also been conveyed (Chris-
tian & Krishnayya, 2009).

II.1.5 Remote sensing for Natura 2000 surveying (status) &
       monitoring (changes)
The Habitats Directive requires EU Member States to maintain and restore all habitats and spe-
cies of “community interest” listed in annexes to the Directive.

A study of Lengyel et al. (2008) of 148 habitat monitoring schemes across Europe found that
the majority of the programs were launched to comply with EU Directives, thus underlining
their importance in European assessments of habitat change. At that time, the member states                       Aspects of habitat conservation status to
were only able to produce robust trend figures on the range of about 1.7% of habitat types                        be measured
and for no more than 4% of the populations of species listed. Most countries did not pro-                         Articles 11 and 17 of the Directive also require
duce trend figures at all (European Topic Centre Biodiversity, 2008). Due to the lack of such                     member states to report on five parameters of habitat
information, remotely sensed observations are increasingly being considered by EU Member                          conservation status every six years:
States to satisfy their reporting obligations under the Habitats Directive (Lengyel et al., 2008;
                                                                                                                  »   habitat area and geographic range,
Vanden Borre et al., 2011b). For instance, an approach proposed by Jongman et al. (2006) is
based on environmental stratification along with detailed field surveys in selected sites, with                   »   habitat structure and function (quality),
this utilising remote sensing data in conjunction with GIS databases and modelling. Remote
sensing data is also being used by other countries across the world to satisfy their conserva-                    »   and future prospects for habitat survival in the
tion reporting requirements.                                                                                          member state (European Commission, 2005;
                                                                                                                      Vanden Borre et al., 2011a).
Vanden Borre et al. (2011a) discussed the opportunities for remote sensing with over 30 mon-
itoring experts from administrations in 13 EU Member States. They see clear opportunities for
its application in their work processes, see box Remote sensing can help to measure habitat
conservation status.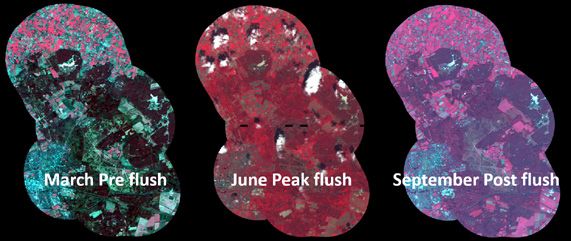
C O N T R I B U T I O N  O F   R E M O T E  S E N S I N G  T E C H N I Q U E S

    46                                    F O R   M O N I T O R I N G  N A T U R A  2 0 0 0   S I T E S

                                                                                                                  Remote sensing can help to measure
Remote sensing can also provide methods to monitor specific biophysical and biochemical                           habitat conservation status (Vanden Borre et
indicators of ecosystem functioning (e.g. leaf area index, normalised difference vegetation index;                al., 2011a)
Kerr & Ostrovsky, 2003; Mücher, 2009). The strength of remote sensing is its ability to deliver                   Habitat area
quantitative measures of such parameters in a standardised manner with full coverage over                         The production of habitat distribution maps, at various
larger areas, whereas field surveys can only deliver this through point sample measurements                       scale levels, constitutes an obvious area of high
and subsequent interpolation. The provision of such data by remote sensing may open new                           potential for remote sensing, as experts indicated. The
ways of looking at the quality of Natura 2000 habitats (Vanden Borre, 2011b).                                     advent of hyperspatial and hyperspectral sensors has
                                                                                                                  indeed greatly enhanced the possibilities of distinguish-
When we take grasslands as an example, remote sensing can contribute to:                                          ing related habitat types at very fine scales (Turner et
                                                                                                                  al., 2003). The end-users need such maps in the first
»   Identify spatially the land cover class grassland and in some cases specific habitat
                                                                                                                  place for estimating and update the sampling frame
    type. There are many different local and regional grassland classification schemes (floristic,
                                                                                                                  (the statistical ‘population’) of habitats for which field
    habitat, climatic, management, use etc.). In most cases floristic composition plays an import-
                                                                                                                  sample surveys are in place. The use of remote sensing
    ant role and this is not that easy to distinguish from satellite imagery.
                                                                                                                  also provides a major opportunity for harmonising
»   Identify grassland quality parameters. These parameters include amongst others LAI,                           Natura 2000 habitat mapping throughout Europe.
    fraction cover, canopy shade, gap fraction soil, biomass content, soil moisture (indirectly),
                                                                                                                  Habitat structure and function (quality)
    canopy coverage etc. The biophysical parameters that can be retrieved from GMES data
                                                                                                                  As stated already by Vanden Borre et al. (2011b)
    sources (e.g. GEOLAND-2) are amongst others:
                                                                                                                  the usefulness of remote sensing for habitat quality
    →      LAI and FAPAR are also classical parameters to quantify green vegetation (so we                        assessment is less straightforward for many mon-
           refer in fact to green LAI or GLAI). They are strongly correlated with fCover (but the                 itoring experts. However, airborne LiDAR data can
           relation between LAI and fCover is far from linear). It is a direct input into grass                   provide much information about habitat structure and
           vegetation density product.                                                                            changes in the habitat structure, while hyperspectral
                                                                                                                  and multispectral data can in most cases provide
    →      fCover: fractional green vegetation cover (FVC) is a useful parameter for many en-                     information about dominant species and changes in
           vironmental and climate-related applications. Comparing to previously used NDVI, it                    the coverage of those dominant species.
           has several strong advantages: absolute parameter (sensor-independent), robust-
           ness to thin clouds, fully scalable at different spatial resolutions                                   Change detection
                                                                                                                  Remote sensing is frequently identified as a powerful
    →      Canopy Shade Factor (CSF): this parameter allows to characterize the amount level                      tool for detecting change (Kennedy et al., 2009; Müch-
           of shadows self-cast on the canopies, and so in many conditions to discriminate                        er et al., 2000). Remote sensing driven change maps
           rough canopies (forests, shrub) from flat, homogeneous canopies (crops and grass-                      not only provide excellent instruments for estimating
           lands)                                                                                                 trends in range and area, but they also localise the
                                                                                                                  areas where change has occurred. Monitoring experts
    →      fSoil: quantifies the gap fraction of soil in the image, and relies on the capacity to
                                                                                                                  highly value this asset, because it allows subsequent
           discriminate a third contributor that is brown or non-photosynthetic (NPV) vegetation.
                                                                                                                  field work to concentrate on these areas, possibly
           It can be most useful to identify intensive agriculture practices with bare soil event.
                                                                                                                  yielding a significant increase in cost-efficiency. In the
»   Changes in extent and quality of the habitat type.                                                            Netherlands we will probably see that habitat maps
                                                                                                                  remain likely to be derived from conventional vege-
Literature review shows that remote sensing can play further a role in: grassland transpiration,                  tation maps updated once in the 12 years, but that
grassland emissions and fluxes, grassland dynamics and phenology, grassland albedo, grassland                     more frequent updates will be based on remote sens-
productivity, chlorophyll and water content and vegetation condition and structure.                               ing products such as LiDAR data, very high resolution
                                                                                                                  satellite imagery and aerial photographs.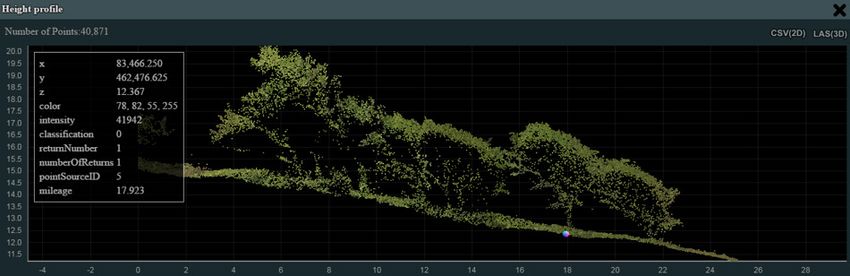
C O N T R I B U T I O N  O F   R E M O T E  S E N S I N G  T E C H N I Q U E S

  47                                     F O R   M O N I T O R I N G  N A T U R A  2 0 0 0   S I T E S

II.2 Current use of Remote Sensing for Natura
     2000 monitoring
II.2.1 State of the art of Remote Sensing for Natura 2000
       monitoring
The state of the art of remote sensing for Natura 2000 monitoring is told based on examples
from European and national projects that clearly explain how remote sensing is being exploited in
Natura 2000 monitoring.

Below is an overview of techniques and tools for different purposes in relation to Natura 2000
monitoring. It provides a link to the paragraph which further describes or gives examples of the
method.

Tool             Scale   Purpose                                                                    Aspects of habitat conservation             Table II.1
                                                                                                    status that can be measured                 Remote sensing tools and methods.
MODIS            250m    Global monitoring and monitoring large areas.                              »   habitat area
                 pixel   Typical MODIS products are: surface reflectance, surface tempera-          »   habitat structure and function
                 size    ture and emissivity, land cover, vegetation indices, e.g. NDVI, thermal        (quality),
                         anomalies /active fraction of photosynthetically active radiation (FPAR)   »   changes in area and quality (struc-
                         / leaf area index (LAI), evapotranspiration, gross primary productivity        ture and function)
                         (GPP) / net primary productivity (NPP), water, burned area, snow cover,
                         sea ice, sea surface temperature.
Landsat TM       30m     Regional studies and recently also global studies, such as Global Forest »     habitat area
                 pixel   Watch and Global Water Surface Explorer.                                 »     habitat structure and function (qual-
                 size    Typical Landsat products are: surface reflectance, spectral indices such       ity),
                         as NDVI, vegetation and moisture measurements, surface temperature,        »   changes in area and quality (struc-
                         dynamic surface water extent, fractional snow covered area, burned             ture and function)
                         area.
Sentinel         10m     Regional and global studies.                                               »   habitat area
                 pixel   Typical Sentinel products are: surface reflectance, land cover, vegeta-    »   habitat structure and function (qual-
                 size    tion indices, e.g. NDVI, leaf area index (LAI), water.                         ity),
                                                                                                    »   changes in area and quality (struc-
                                                                                                        ture and function)
Aerial photos    20cm    Local and national studies, typically used for topographical surveying.    »   habitat area
                 pixel                                                                              »   habitat structure and function
                 size                                                                                   (quality),
                                                                                                    »   changes in area and quality (struc-
                                                                                                        ture and function)
Airborne                 Local studies such as specific Natura 2000 sites.                          »   habitat area
LiDAR and                Typical UAV (drone) products are: canapy.                                  »   habitat structure and function
hyperspectral                                                                                           (quality)
imagery &                                                                                           »   changes in area and quality (struc-
UAVs                                                                                                    ture and function)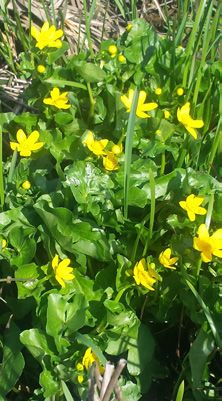
C O N T R I B U T I O N O F R E M O T E S E N S I N G T E C H N I Q U E S
48 F O R M O N I T O R I N G N A T U R A 2 0 0 0 S I T E S
Mapping and monitoring habitat area
In the following sections examples are given on the use of remote sensing data for the mapping
and monitoring of habitat area. The first example is based on the interpretation of historical ae-
rial photographs to detect land cover changes in and around Natura 2000 sites since the early
fifties. The second example concerns the Copernicus European land cover monitoring activities.
The third example concerns the mapping of ecosystems (MAES), the fourth example mapping
and monitoring of habitats using very high resolution data.
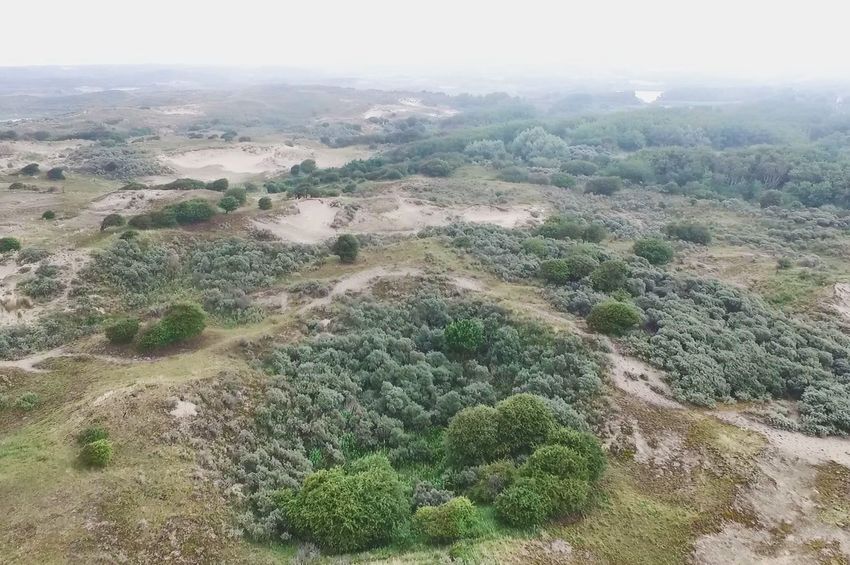
a. Interpretation of land cover changes in Figure II.3
and around Natura 2000 sites based on time Detected land cover changes in Slovakia in and around
series of historical aerial photographs Natura 2000 site ''Nitra'' since the early fifties, based on
historical aerial photographs (Gerard et al., 2006).
The EU project BIOPRESS funded within the EU
Fifth Framework is taken as an example for the
interpretation of land cover changes from his-
torical aerial photographs in and around Natura
2000 sites. Historical aerial photographs from the
1950s provide useful information about the orig-
inal state of natural areas before the process of
land consolidation and the associated amount of
land use changes. Moreover the land cover flows
(transition from one land cover type in another
land cover type) within and around protected sites
also provide information about the effectiveness
of protection. The BIOPRESS method was de-
signed to produce land cover change information
collected in an operational and consistent manner
from samples (including transects) across Natura
2000 within the different biogeographical regions
of Europe. Land cover was classified according
to the CORINE Land Cover nomenclature with
44 classes at the highest level 3 (Heymann et
al., 1993). Change was captured by means of
‘backdating’ where the older data set is compared
against the most recent. Change was recorded
at a scale of 1:100.000 within 73 samples of 30
by 30km, and 59 transects of 2 by 15km at a
scale of 1:20.000 for aerial photographs of the
reference years: 1950, 1990 and 2000. Figure II.3
shows an example for the Nitra site in Slovakia.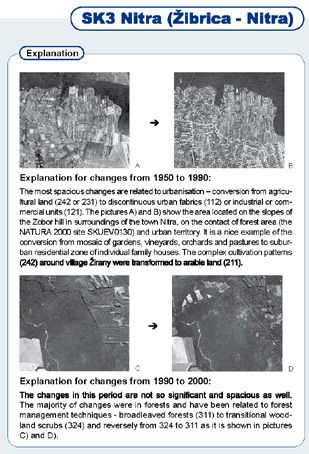
C O N T R I B U T I O N  O F   R E M O T E  S E N S I N G  T E C H N I Q U E S

  49                                     F O R   M O N I T O R I N G  N A T U R A  2 0 0 0   S I T E S

The degree of thematic detail and level of spatial detail of the land cover measured determines
the type, amount and rate of change detected. Moreover the land cover flows can be associated
with specific pressures such as urbanization, drainage, afforestation, deforestation, abandon-
ment and intensification.

b. European Land monitoring in the framework of Copernicus

European Land monitoring in the framework of Copernicus consists of two components, the
pan-European land monitoring and the local or hotspot land monitoring. The pan-European
component includes as main products the CORINE Land Cover (CLC), High Resolution Layers and
image mosaics. The CORINE Land Cover is provided for 1990, 2000, 2006, 2012, and 2018. This
vector-based dataset includes 44 land cover and land use classes with 25ha as minimum map-
ping unit (MMU). The time-series also includes a land-change layer, highlighting changes in land
cover and land-use (5ha MMU). The use of CLC for ecosystem mapping and assessment and the
mapping of High Nature Value Farmland is described in Feranec et al., 2016. The high-resolution
layers (HRL) are raster-based datasets which provides information about different land cover
characteristics and is complementary to land-cover mapping (e.g. CORINE) datasets (100*100m
aggregated products).

Five HRLs describe some of the main land cover characteristics: impervious (sealed) surfaces
(e.g. roads and built up areas), forest areas, grasslands, water & wetlands, and small woody fea-
tures (land.copernicus.eu/pan-european). Figure II.4 presents an example of the HRL Grassland
for Czech Republic. The local component focuses on different hotspots, i.e. areas that are prone

                                                                                                                 Figure II.4
                                                                                                                 Example for Czech Republic of the Copernicus High
                                                                                                                 Resolution Layer grassland 2015, from: land.copernicus.
                                                                                                                 eu/pan-european/high-resolution-layers/grassland/status-
                                                                                                                 maps/2015
C O N T R I B U T I O N O F R E M O T E S E N S I N G T E C H N I Q U E S
50 F O R M O N I T O R I N G N A T U R A 2 0 0 0 S I T E S
to specific environmental challenges and problems. It is based on very high resolution imagery
(2,5x2,5m pixels) in combination with other available datasets (high and medium resolution
images) over the pan-European area. The three local components are: Urban Atlas, Riparian
Zones and Natura 2000. The rationale for the last two local components is provided by the need
to monitor biodiversity at European level and to assess if the N2000 sites are being effectively
preserved (land.copernicus.eu/local).
c. Ecosystem Types of Europe
The dataset combines the Copernicus land service portfolio and marine bathymetry and seabed
information with the non-spatial EUNIS habitat classification for a better biological characteriza-
tion of ecosystems across Europe. As such it represents probabilities of EUNIS habitat presence
for each MAES ecosystem type. The Ecosystem
Type Map (ETM) is produced by applying different Figure II.5
mapping rules on input datasets. Ecosystem Map (aggregated, v3.1) (Weis & Banko, 2018).
The newest version, v3.1, is based on the following
input datasets:
» Corine Land Cover 2012 accounting layer
(instead of CLC 2012 status layer)
» HRL Forests 2012 (Forest Type, Tree Cover
Density)
» HRL Imperviousness 2012
» OpenStreetMap (OSM) data 2015 (main roads,
land use information)
And further integration of new available Coperni-
cus data
» Urban Atlas 2012
» Riparian Zones 2012
» Natura 2000 2012
» HRL Grassland 2012
» HRL Permanent Water Bodies 2012
The resulting Ecosystem Type Map (v3.1) is dis-
played in the Figure II.5.C O N T R I B U T I O N O F R E M O T E S E N S I N G T E C H N I Q U E S
51 F O R M O N I T O R I N G N A T U R A 2 0 0 0 S I T E S
d. Earth Observation data for Habitat Figure II.6
Mapping and Monitoring Results of EODHam for a part of the Veluwe in the Nether-
lands. On the left the land cover classification at level 4 of
To support decisions related to the use and
FAO LCCS. In the right the habitat classification in terms of
conservation of protected areas and surrounds,
General Habitat Categories (Mücher et al, 2015).
the EU-funded BIO SOS project has developed the
Earth Observation Data for HAbitat Monitoring
(EODHaM) system for consistent mapping and
monitoring of biodiversity. The EODHaM approach
has adopted the Food and Agriculture Organization
Land Cover Classification System (LCCS) taxonomy
and translates mapped classes to General Habitat
Categories (GHCs) from which Annex I habitats (EU
Habitats Directive) can be defined (Lucas et al.,
2015).
Although LCCS focusses on land cover and GHC
on habitats, both LCCS and GHC categories have
height information of the canopy as essential
information. Input data sources for EODHaM are
very high resolution (VHR) images, height infor-
mation from LiDAR data, and ancillary information
such as topographical maps (Mücher et al, 2015).
The EODHaM system uses decision rules to derive
GHC classes on the basis of spectral and height
information (Mücher et al, 2015), see also Figure
II.5 as an example.
Mapping and monitoring habitat quality
a. Remote sensing-enabled Essential Biodiversity Variables (RS-EBVs)
Essential Biodiversity Variables (EBVs) were proposed in 2013 by the biodiversity community to
improve harmonization of biodiversity data into meaningful metrics (see chapter A.III Access to
data and Information). The proposed EBVs have been grouped into six classes: genetic compo-
sition (not able yet with remote sensing data), species populations, species traits, community
composition, ecosystem structure, and ecosystem function (see Figure II.6). This concept has taken
root within wide segments of the theoretical and applied ecology communities. Furthermore, the
idea behind the original EBV concept was that at least one EBV per class should be monitored,
while keeping the set of EBVs limited is necessary to assure the usefulness of the EBV concept.
Possible EBV’s that capture biodiversity change on the ground and can be monitored from space
range from leaf nitrogen and chlorophyll content to seasonal changes in floods and fires (Skidmore
et al., 2015).C O N T R I B U T I O N O F R E M O T E S E N S I N G T E C H N I Q U E S
52 F O R M O N I T O R I N G N A T U R A 2 0 0 0 S I T E S
The RS-enabled EBVs can play a role in the monitoring of the quality of the habitats, next to the
mapping and monitoring of habitat types. Nevertheless, much effort still has to be put in place
to translate these remote sensing variables into useful information for ecologists in terms of
habitat quality.
For example, Vaz et al. (2015) collected field data on five habitat quality indicators in vegeta-
tion plots from woodland habitats of a landscape undergoing agricultural abandonment. Their
findings strongly suggest that some features of habitat quality, such as structure and habitat
composition, can be effectively monitored from EO data combined with field campaigns as part
of an integrative monitoring framework for habitat status assessment.
b. Mapping quality of heathland areas in terms of grass encroachment
Mücher et al. (2013) focused on the use of continuous Figure II.7
fraction images for habitat quality assessment in a heath- A selection of proposed RS-Enabled Essential Biodiversity
Ecosystem Ecosystem Species Species Community
land site in the Netherlands (see Figure II.7). This com- Variables (RS-EBVs) – Modified by E.Neinavaz from
structure function traits population composition
bined application of techniques on hyperspectral imagery Skidmore et al. (2015).
demonstrates the usefulness for mapping grass abun-
Ecosystem Fire
Species
dance (Molinia caerulea) in heathlands. It provides a better distribution occurrence Plant traits: interaction
basis to monitor large areas for processes such as grass Fragmentation Vegetation
and
encroachment that largely determine the conservation heterogeneity
phenology
Species
Specific leaf Phenology
occurrence
status of Natura 2000 heathland areas. Timely, accurate area
Leaf area
Land cover
and up-to-date spatial information on the encroachment index
of mosses, grasses, shrubs or trees (dominant species) can Vegetation Primary
Leaf nitrogen Functional
content diversity
help conservation managers to take better decisions and height productivity
to better evaluate the effect of taken measures.
c. Monitoring shrub encroachment
Regular mapping of vegetation structure is of importance for biodiversity monitoring (Mücher
et al., 2017a). In the Netherlands, vegetation structure mapping is in most cases still done in a
traditional way based on field surveys in combination with visual interpretation of aerial photo-
graphs. This procedure is time consuming and often limited in its consistency and efficiency to
cover large areas. Meanwhile space and airborne imagery are increasingly becoming available at
affordable costs and with a high spatial resolution of approximately 50cm (Mücher et al., 2017a).
Therefore, commonly shared Dutch open LiDAR-data such as AHN (LiDAR derived terrain models)
in combination with commercially available very high resolution satellite data were used to
develop methodologies that can help to increase the updating frequency of vegetation structure
maps, based on respectively vegetation height and vegetation cover. LiDAR-data from AHN2
(2008) and AHN3 (2014) was combined with very high resolution satellite imagery from the sim-
ilar time period in order to detect changes in vegetation structure at 1 metre spatial resolutionC O N T R I B U T I O N O F R E M O T E S E N S I N G T E C H N I Q U E S
53 F O R M O N I T O R I N G N A T U R A 2 0 0 0 S I T E S
(see Figure II.8). The existing habitat map was used to develop a Figure II.8 (right)
protocol to find Grey Dunes (H2130) that showed significant changes in Thematic fraction image for grass encroachment of
vegetation structure between 2008 and 2014 (see Figure II.9 as exam- heathlands concerning the Molinia dominated heathland
ple). The Remote Sensing method can also be used for other vegetation (Hgmd), obtained by spectral mixture analysis (SMA) on
structure – or habitat types but requires other specific decision rules an AHS hyperspectral image of October 2007. Red means
in relation to vegetation height and/or vegetation cover which have to almost 100% coverage with Molinia or other grasses, and
be agreed upon by the nature conservation community. Therefore, the blue means almost 0% coverage with Molinia, so it’s good
developed Remote Sensing monitoring method for vegetation structure quality Heathland.
is only a start to enable national wide operational monitoring of the
vegetation structure of all habitat types (Mücher et al., 2017a). Figure II.9 (left)
An example of the monitoring of changes in vegetation
structure for the Grey Dunes in the Netherlands, based on
changes in vegetation cover and vegetation height (Mücher
et al., 2017a).
II.2.2 Recent developments
New high resolution satellite sensors and drones
A lot of remote sensing data sources with much higher spatial and temporal resolu-
Three types of sensor platforms
tion have become available that can support Natura 2000 monitoring.
Remote sensing is the science of obtaining informa-
The observations from the different platforms are often integrated for upscaling and downscaling tion about an object, an area, or phenomenon
of the measurements and derived information (Figure II.10). In particular, the use of UAVs, better
1 spaceborne platforms, read satellites.
known as drones, is increasing rapidly for biodiversity monitoring, with spectral, spatial and tem-
poral resolution often adjustable flexibly, but with limited coverage compared to other platforms. 2 airborne platforms (including aircraft, helicopter,
balloon or Unmanned Airborne Vehicles (UAV), and
The spatial resolution of most current multispectral spaceborne sensors is insufficient (~2–
250m) to detect the presence of individual plants. However, most airborne sensors have a 3 Ground-based platforms, where the sensor is
sufficiently high spatial resolution (pixels of 0.5–5m) to register small-scale variation in the mounted on a mast or is held manually above the
vegetation. Spaceborne systems have the advantage of coming over at fixed intervals (ranging ground
from a few days to a few weeks). This means that a new recording can be made regularly, so
that the phenology can be visualized.C O N T R I B U T I O N O F R E M O T E S E N S I N G T E C H N I Q U E S
54 F O R M O N I T O R I N G N A T U R A 2 0 0 0 S I T E S
Satellites Figure II.10 (left)
Monitoring at 1–2 metre resolution for the Netherlands Overview of the vegetation structure monitoring system
Airplanes based on the exploitation of LiDAR data and very high
LiDAR (AHN-2) LiDAR (AHN-3) VHRS T1 VHRS T2
˜2008 ˜2014 22-06-2009 27-08-2014 resolution satellite imagery (VHRS) (Mücher et al., 2017a).
Drones Figure II.11 (right)
Up Multi-scale sensing approach with different remote sensing
Changes
Changes in Land sca In-situ platforms: spaceborne, airborne and ground-based (Source:
Vegetation Height
Cover lin
(cm) g&
do
wn
presentation Mucher).
sca
Translate from pixel into object information lin
g
e.g. shrub encroachment coastal grey dunes (H2130)
An even higher spatial and temporal resolution than with airborne or spaceborne systems can be
achieved with the use of UAVs. However, this also depends on the type of camera used. Different
types of UAVs exist like multicopters and fixed wing airplanes having different capacities (camera
load, flight time, easiness to maneuver) (Figure II.14). They can be equipped with different sen-
sors (passive and active). The use of unmanned airborne vehicles (UAVs) or so-called drones that
can carry a LiDAR camera is a recent development. Recently, the use and adoption of UAVs as a
flexible sensor platform for monitoring has evolved rapidly. Potential application domains are e.g.
agriculture (phenotyping of individual plants), coastal monitoring, archaeology, corridor mapping
(power lines, railway tracks, pipeline inspection), topography, geomorphology, and construction
site monitoring (surveying urban environments), next to forestry and vegetation monitoring. Until
recently it was not possible to have a LiDAR camera on a UAV since the cameras were too heavy
to be carried by a UAV.
Figure II.12
Multicopter with hyperspectral camera and a fixed wing
drone with RGB camera (source presentation Mucher).C O N T R I B U T I O N O F R E M O T E S E N S I N G T E C H N I Q U E S
55 F O R M O N I T O R I N G N A T U R A 2 0 0 0 S I T E S
The detail of the recorded images also depends on the height that is flown. Table II.2 gives an
overview of the possible pixel size and width of the recording at different heights. Another ad-
vantage of UAVs is that it can be flown completely autonomously.
Height (m) Pixel size hyperspectral camera (cm) Pixel size RGB camera (cm) Table II.2
20 5.3 0.52 Examples of varying pixel resolution and image width with
flight height for a hyperspectral and RGB camera.
40 11 1.0
60 16 1.6
80 21 2.1
100 27 2.6
120 32 3.1
Mapping and monitoring vegetation structure
Mapping and monitoring vegetation height can not only help to distinguish the different plant
lifeforms but can also help to identify processes such as shrub and tree encroachment (Mücher
et al., 2017b). Vegetation height is as such an important component of the structural aspect
of ecological complexity. Bunce et al. (2013) emphasises the importance of habitat/vegetation
structure in the development of biodiversity policies in their own right and also demonstrates
that there are strong links between vegetation structure and occurrence of species. Only a very
small part of all species can be monitored. Vegetation height is an important indicator as well in Sensor technologies for mapping and
the definition of an ecosystem or habitat type. To enable the measurement of vegetation height, monitoring vegetation structure
remote sensing can play a crucial role and can become an important information source. » Passive sensor technologies
New developments in remote sensing such as the use of very high resolution (VHR) satellite » Radar technology
imagery and LiDAR (Light Detection And Ranging) techniques, next to the use of UAV platforms,
» LiDAR technology
can help to speed up the process of vegetation mapping and monitoring. Nevertheless, some of
these methods are relatively new and require ecologists and remote sensing experts to collabo- → UAV LiDAR (drones)
rate closely and review the newest methods and technologies. Therefore this section discusses
the potential use of passive optical sensors, RADAR and LiDAR technology for measuring vegeta- → Airborne LiDAR
tion height to support the monitoring of vegetation structure or in other words the EBV ‘ecosys-
tem structure’ (Mücher et al., 2017b). → Spaceborne LiDAR
a. Passive sensor technology
Several studies have employed passive satellite sensor data to estimate vegetation height. A
wide variety of features have been extracted from passive sensors of spatial resolutions ranging
from several centimetres to some tens of metres. Donoghue and Watt (2006) approximated
mean vegetation height for plots of 0.02ha using directly the mean reflectance values from
spectral bands of Landsat Enhanced Thematic Mapper Plus (ETM+) and IKONOS images (Mücher
et al., 2017b).C O N T R I B U T I O N O F R E M O T E S E N S I N G T E C H N I Q U E S 56 F O R M O N I T O R I N G N A T U R A 2 0 0 0 S I T E S b. RADAR technology RADAR (Radio Detection And Ranging) is an important tool for detecting the structure and height of vegetation because of its ability to penetrate clouds, to provide a signal from the geometric properties of the vegetation and to generate images over large areas. The RADAR signal, back- scatter and interferometric phase, depends on the physical structure and dielectric properties allowing an indirect measurement of vegetation structure. Since the early 1990s several studies have demonstrated the relationship between RADAR backscatter and vegetation structure and height (e.g. Dobson et al., 1995, Joshi et al., 2015). Interferometric SAR (InSAR) allows a more direct estimation of height and the vertical distribution of vegetation (Florian et al., 2006, Papa- thanassiou et al., 2008, Treuhaft and Sinqueira, 2004). c. LiDAR technology The following subsections deal with LiDAR technology from different platforms that all have their own merits for surveying, they concern respectively airborne and spaceborne LiDAR scanning. Airborne LiDAR From the perspective of ecological research, LiDAR can be considered as a relatively new tech- nology (Carson et al., 2004). LiDAR was originally introduced to generate more accurate digital elevation models (DEMs) (Evans et al., 2006) but has recently become an effective tool for natural resources applications (Akay et al., 2008). Scopus presents very well the steep increase in publications per year between 2000 and 2015, respectively from around 10 in 2000 to 400 publications in 2015 (search “LiDAR AND vegetation”). Airborne LiDAR offers the possibility to collect structural information over larger spatial extents than could be obtained by field surveys (Bradbury et al., 2005). LiDAR, in contrast to optical re- mote sensing techniques, can be expected to bridge the gap in 3D structural information, includ- ing canopy shape, number of vegetation layers and individual tree identification at the landscape scale (Graf et al., 2009). UAV LiDAR (drones) Before, LiDAR measurements were made only from manned helicopters or airplanes. Attaching a LiDAR sensor to a moving UAV platform allows 3D mapping of larger surface areas (Mücher et al., 2017b). The big advantage of the use of a UAV is its flexibility to be used in space and time. The major limitation compared to manned airborne laser scanning is still limited in its areal coverage, not only due to the technological capabilities but also due to aviation regulations which does not allow in most cases to fly beyond line of sight. The use of unmanned LiDAR Scanning (ULS) cer- tainly has advantages compared to the more static terrestrial laser scanning (TLS) or large-scale systems using manned platforms (Mücher et al., 2017b): UAV is more flexible in its use, but LIDAR allows a larger area to be covered, and better timing of (repeated) data acquisition.
C O N T R I B U T I O N  O F   R E M O T E  S E N S I N G  T E C H N I Q U E S

  57                                     F O R   M O N I T O R I N G  N A T U R A  2 0 0 0   S I T E S

                                                                                                                 Figure II.13
                                                                                                                 Example of a line transect through a LiDAR point cloud,
                                                                                                                 visualized in 3D, as taken by an UAV LiDAR camera
                                                                                                                 (Acquired with VUX-SYS camera mounted on RiCopter).

However only a limited number of manufacturers can provide at the moment such integrated
UAV-LiDAR systems (Mücher et al., 2017b). See Figure II.13 as an example of ULS.

Spaceborne LiDAR
NASA’s GLAS instrument (Geoscience Laser Altimeter System) on the spaceborn ICESat platform
(Ice, Cloud, and land Elevation satellite), launched on 12 January 2003, is a good example of a
promising technique from space. Although the main objective of the GLAS instrument was to
C O N T R I B U T I O N O F R E M O T E S E N S I N G T E C H N I Q U E S
58 F O R M O N I T O R I N G N A T U R A 2 0 0 0 S I T E S
measure ice sheet elevations and changes in elevation through time, it was also very successful
in measuring forest height. Amongst others Hayashia et al. (2013) showed that ICESat/GLAS
data provides useful information on forest canopy height with an accuracy RMSE of 2.8m. New
advanced sensors to be launched in the next couple of years will provide increasingly accurate
information on traits such as vegetation height and plant-species characteristics. These include
the NASA Global Ecosystem Dynamics Investigation Lidar (GEDI), successfully launched in 2018
from Cape Canaveral.
Use of machine learning to map individual species
The exploitation of machine learning or artificial intelligence has improved with the increase in
computational power, and provides the basis for more complicated image classifications that
enables the recognition of objects such as human individuals but provides also opportunities to
map individual plant species (in case of larger plants with distinct features). In general, machine
learning explores patterns and regularities within the data in order to make predictions on new
data based on what is learnt by analysing available known data. Since the accuracy can be
improved with experience, machine learning performs the best when it can incorporate large
training datasets.
Below is an example of a deep learning approach to identifying marsh marigold (Caltha palustris)
from RGB drone imagery over the wetland forest Biesbosch National Park in the Netherlands
(Figure II.14). The study (Alkema, 2019) attempts for species recognition from UAV images, to
potentially assist or replace field inventories. The bright yellow flowers of marsh marigold and
reflective leaves allow for relatively easy recognition in the field, and as an indicator species its
presence or absence gives insight in the status of the surrounding swampy habitat.
Figure II.14
Examples of correct and false predictions of the grid
(3rd column) and single prediction models (4th column).
True positive (TP), true negative (TN), false positive (FP)
and false negative (FN) outputs are depicted next to the
corresponding UAV images and ground-truth masks, given a
threshold of 0.5 (Alkema, 2019).C O N T R I B U T I O N O F R E M O T E S E N S I N G T E C H N I Q U E S
59 F O R M O N I T O R I N G N A T U R A 2 0 0 0 S I T E S
II.3 Key findings and recommendations Key findings
» Remote Sensing holds promise as a supporting
The purpose of this report is the provision of services to advise the Commission, Member technique for Natura 2000 habitat monitoring
State authorities and other stakeholders on the better use of scientific knowledge and scien-
tific networks in support of the implementation of the nature directives with a specific focus » Remote sensing has a strong, yet underexploited
on evidence-based improvements in the Birds and Habitats Directives (BHD) implementation. potential to assist in the monitoring of protected
Evidence-based improvements can be supported to a large extent by remotely sensed observa- areas.
tions, and concerns this chapter. Remote Sensing holds promise as a supporting technique
» Remote sensing is generally most useful when
for Natura 2000 habitat monitoring (Mücher et al. 2013; Vanden Borre et al. 2011b), in many
combined with in situ observations and ecological
cases in terms of changes in habitat area and in some cases in terms of changes in habitat
knowledge
quality. But at the same time, the accuracy of remote sensing products vary a lot depending on
the habitat type and its size, making the RS products not always useful. RS definitely provides a » Remote sensing plays a major role in mapping and
powerful tool for detecting land use changes (Feranec et al. 2016; Hazeu et al. 2014; Hazeu et al. understanding (terrestrial) biodiversity
2002; Van der Zanden et al. 2013).
Remote sensing has a strong, yet underexploited potential to assist in the monitoring
of protected areas. However, the data generated need to be utilized more effectively to enable
better management of the condition of protected areas and their surroundings, prepare for
climate change, and assist planning for future landscape management (Nagendra et al. 2013).
More interaction between the remote sensing and conservation community is needed to fine-tune
the site managers needs in terms of remote sensing products. This interaction is also needed
because most RS products are not perfect and need to be exploited in the appropriate manner
by ecologists and terrain managers. The RS community needs to simplify access to the original
imagery and derived products to make the full potential of RS available for the TM community
(Geller et al. in Walters and Scholes, 2017).
Remote sensing is generally most useful when combined with in situ observations and
ecological knowledge. The in-situ observations are needed as ground-truth to enable training
of the classifications and for assessing RS accuracy. RS can provide excellent synoptic spatial and
temporal coverage, for example, though its usefulness may be limited by pixel size which may be
too coarse for some applications. On the other hand, in-situ measurements are made at very fine
spatial scales but tend to be sparse and infrequent, as well as difficult and relatively expensive to
collect. Combining RS and in-situ observations takes advantage of their complementary features
(Geller et al. in Walters and Scholes, 2017). Finally, remote sensing data can also be collected
from terrains where in-situ measurements are difficult.
Remote sensing plays a major role in mapping and understanding (terrestrial) biodi-
versity. It is the basis of most land cover/land use maps, provides much of the environmental
data used in species distribution modelling, can characterise ecosystem functioning, assists in
ecosystem service assessment, and is beginning to be used in genetic analyses. RS data are usu-
ally combined with physical data such as elevation or climate (which in fact may be derived from
RS data) and, increasingly, with socio-economic data (Geller et al. in Walters and Scholes, 2017).C O N T R I B U T I O N O F R E M O T E S E N S I N G T E C H N I Q U E S
60 F O R M O N I T O R I N G N A T U R A 2 0 0 0 S I T E S
Early applications pertained to the stereoscopic visual interpretation of aerial photography and
were a great step forward in vegetation monitoring. More recently, satellite imagery with a
large range of spatial and temporal resolutions is available and enables applications for entire
ecosystems. Traditional vegetation mapping methods that use visual interpretation of aerial
photography in combination with field surveys are, and have always been, working very well. But
they are often also labour intensive and temporal frequencies are low, while policies are current-
ly demanding higher temporal monitoring frequencies. Therefore, terrain and nature managers
are looking for alternatives that can support the mapping and monitoring of vegetation in more
efficient ways.
II.3.1 Current limitations
Current limitations
Mutual understanding and technical skills » Mutual understanding and technical skills
An important barrier for site or terrain managers (TM) to use RS products is dealing with the
“unknown” of RS products. A lot of people are still reluctant to use these tools (scepticism » Costs of remote sensing products
about technological innovation) which is slowing down their take-up for nature conservation
» Products mismatching expectations
management. For them RS techniques are mainly related to scientific purposes. For others, there
is just an over-expectation of their results. So overall, there is a lack of understanding on the
utility of these RS products/tools. Therefore it is needed to engage terrain managers in using RS
products so they understand the possibilities and limitations of the RS products and tools. Why
change your daily work routine if it works as you do now? It is often not (directly) clear what
it could mean in their daily work. A huge difference exists between what can be done versus
what is needed/expected by terrain managers (TM). Communication and mutual understanding
between TM and RS community is of utmost importance. In order to resolve misunderstand-
ings and perceived mismatches, increased cooperation and communication between producers
and final users is needed. On the one hand, this can be achieved by setting up facilities for an
enhanced sharing of ideas and results. On the other hand, end-users need to get involved in the
development of remote sensing products as early as possible (Vanden Borre et al., 2011b).
Next to these barriers of mutual understanding there are limitations of more technical na-
ture. The products are sometimes too complex and not easy to understand as the huge amount
of data make it not easy to analyse the data and recognize the patterns. Remote sensing, as
a science, is a very diverse field. For site managers mostly unfamiliar with the large variety of
imagery and methodologies that are available, it will be impossible for them to find the most
suitable method for their needs. Next to that, the specific requirements and applications in the
field of habitat monitoring are equally diverse. Standardised RS products will therefore rarely
suit the specific requirements (Vanden Borre et al., 2011b). Furthermore, the RS products need
to be interpreted for which specific skills (or training) are needed. Also the liability of image
availability is often questioned, and the necessity to work with and to buy new (complex) soft-
ware and hardware is also often seen as an obstacle.C O N T R I B U T I O N O F R E M O T E S E N S I N G T E C H N I Q U E S 61 F O R M O N I T O R I N G N A T U R A 2 0 0 0 S I T E S Costs RS needs to be combined with field visit to train your classification and/or verify your products. This is one of the reasons why it is difficult to say if RS products are cheaper than field visits. Detailed cost-effectiveness studies in this area were not found. RS cannot completely replace field visits. Also RS products can be used to fill the data gaps between specific moments in which field visits took place. The cost of RS products is nowadays mainly related to setting-up the IT infrastructure for stor- age and processing, the interpretation and calibration of the products. Next to the costs discussion, RS products sometimes cannot be replaced by field visits. RS prod- ucts can look back into time, i.e. show the historical situation if RS imagery is available, while field visits show only the current situation. Products mismatching expectations Operational RS products at the regional/national scale are often focused on land cover/land use. The mapping and monitoring of the extent and quality of habitats in N2000 sites is limited compared to land cover and land use classifications. Moreover, legal regulations can hamper the use of remote sensing. For example, in the Netherlands habitat maps have to be derived from conventional vegetation maps, meaning that remote sensing is not allowed to replace traditional field surveys. On the other hand, remote sensing is still able to make more frequent updates in between the traditional updates implemented approximately once in 12 years. At the site level more examples are available regarding the added value of RS in habitat mapping. However, at e.g. plant species level (rare species) RS products are insufficient. In general it can be stated that large scale (and dynamic) habitats are more suitable for mapping by RS. The spatial resolution of the RS product must meet a certain ‘intrinsic scale’ that characterizes a specific habitat. This ‘intrinsic scale’ is habitat dependent (Vanden Borre et al., 2011b). As there are no standards de- fining spatial reference sizes for habitat mapping this knowledge gap makes standardisation of monitoring methodologies difficult. Matching appropriate RS observations to ecological process- es or species distributions often requires a multi-scale approach where one spatial and temporal scale provides information on a portion of an ecological process or species’ life-history while other scales are required to observe another portion (Geller et al. in Walters and Scholes, 2017). Another source for a mismatch of expectations mentioned by Vanden Borre et al. (2011b) is that habitat typologies are not harmonised making data compatibility and integration difficult. A standard habitat typology with a biotic and abiotic description could be of help to interchange remote sensing methods and products.
You can also read