Controls on the rates and products of particle attrition by bed-load collisions
←
→
Page content transcription
If your browser does not render page correctly, please read the page content below
Earth Surf. Dynam., 9, 755–770, 2021
https://doi.org/10.5194/esurf-9-755-2021
© Author(s) 2021. This work is distributed under
the Creative Commons Attribution 4.0 License.

                           Controls on the rates and products of
                           particle attrition by bed-load collisions
                                     Kimberly Litwin Miller1,2 and Douglas Jerolmack2
       1 Division   of Geological and Planetary Sciences, California Institute of Technology, Pasadena, California, USA
                         2 Department of Earth and Environmental Science, University of Pennsylvania,

                                                Philadelphia, Pennsylvania, USA
                              Correspondence: Kimberly Litwin Miller (kmiller2@caltech.edu)

                                  Received: 19 October 2020 – Discussion started: 31 October 2020
                               Revised: 20 May 2021 – Accepted: 8 June 2021 – Published: 23 July 2021

       Abstract. River rocks round through the process of impact attrition, whereby energetic collisions during bed-
       load transport induce chipping of the grain surface. This process is also important for bedrock erosion. Although
       previous work has shown that impact energy, lithology, and shape are controlling factors for attrition rates, the
       functional dependence among these quantities is not settled. Here we examine these factors using a double-
       pendulum apparatus that generates controlled collisions between two grains under conditions relevant for bed-
       load transport. We also determine the grain size distributions (GSDs) of the attrition products. Two experimental
       results appear to support previous treatments of impact erosion as brittle fracture: (i) mass loss is proportional to
       kinetic energy, and this proportionality is a function of previously identified material properties; and (ii) attrition-
       product GSDs are well described by a Weibull distribution. Chipping results from the development of shallow
       and surface-parallel cracks, a process that is distinct from bulk fragmentation that occurs at higher energies. We
       suggest that Hertzian fracture is the dominant mechanism of impact attrition for bed-load transport. We also
       identify an initial phase of rapid mass loss in which attrition is independent of energy and material properties;
       this is a shape effect associated with removal of very sharp corners. The apparent universality of both mass
       loss curves and attrition-product GSDs requires further investigation. Nonetheless, these findings are useful for
       interpreting the contribution of in-stream attrition to downstream fining and the production of sand resulting
       from bed-load transport of river pebbles.

1   Introduction                                                     term is avoided here since abrasion has a mechanically dis-
                                                                     tinct meaning in the comminution literature (Novak-Szabo
Traveling downstream in a typical river, one observes river          et al., 2018). It is the process whereby river sediments are
sediments becoming rounder in shape (Sneed and Folk,                 worn away due to energetic collisions with other grains and
1958; Adams, 1978) and smaller in size (Sternberg, 1875;             the channel bed during transport (Kuenen, 1956; Kodama,
Ferguson et al., 1996). While there is a debate over whether         1994b). Although there has been a great deal of previous
mechanical breakdown by impact attrition or hydraulic sort-          work investigating the process (Kodama, 1994b; Lewin and
ing caused by relative transport rates is responsible for fin-       Brewer, 2002; Attal and Lave, 2009; Szabo et al., 2013;
ing patterns (Kodama, 1991; Ferguson et al., 1996; Gasparini         Litwin Miller et al., 2014; Szabó et al., 2015; Novak-Szabo
et al., 1999; Lewin and Brewer, 2002), it is generally agreed        et al., 2018), there is a lack of understanding of the fun-
that impact attrition is the chief mechanism producing the           damental physics involved in sediment impact attrition. Im-
rounding of sediments (Kuenen, 1956; Sneed and Folk, 1958;           pact attrition by saltating bed-load particles is also a signifi-
Schumm and Stevens, 1973; Litwin Miller et al., 2014; Sz-            cant, and in many cases dominant, contributor to the erosion
abó et al., 2015; Novak-Szabo et al., 2018). Attrition is of-        of bedrock river channels (Sklar and Dietrich, 1998, 2004).
ten called “abrasion” in the geological literature, but that

Published by Copernicus Publications on behalf of the European Geosciences Union.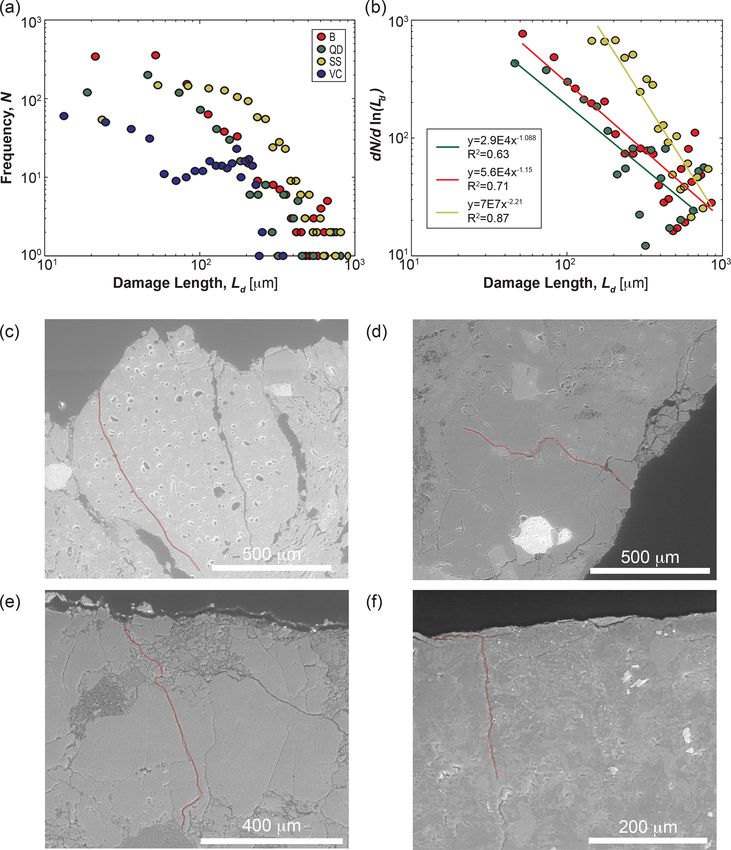
756                                                                         K. Litwin Miller and D. Jerolmack: Binary collision

Similar to pebbles themselves, bedrock channels are often          examined the relation between impact attrition rate and ten-
smoothed at small length scales by impact attrition (Wilson        sile strength, finding an inverse square dependence. Bed-load
et al., 2013; Beer et al., 2017).                                  transport experiments by Attal and Lave (2009) confirm that
   Sternberg (1875) attributed the downstream fining of grain      lithologies with low tensile strength, like weak sandstone,
size in rivers to impact attrition and quantitatively described    erode faster than those with higher values, like limestone and
it with the exponential function                                   quartzite. Because rocks are very brittle, there is a long lin-
                                                                   eage of modeling impact attrition due to elastic deformation
D(x) = D0 e−αx ,                                            (1)    (e.g., Shipway and Hutchings, 1993). For energies below the
                                                                   fragmentation threshold – the typical scenario for bed-load
where D(x) is the grain size at downstream distance x,
                                                                   transport of natural pebbles – it has classically been assumed
D0 is the initial grain size at x = 0, and α is the empiri-
                                                                   that elastic deformation slowly grows subsurface cracks un-
cally determined diminution coefficient. Despite the fact that
                                                                   til they merge to produce products (Bitter, 1963). Besides
this expression lacks a mechanistic framework, α values re-
                                                                   tensile strength, this mechanism would indicate that material
main the most commonly applied method describing attri-
                                                                   density and Young’s modulus are also important parameters
tion rates. Most previous work on impact attrition has been
                                                                   (Wang et al., 2011; Le Bouteiller and Naaim, 2011). While
through laboratory experiments (Krumbein, 1941; Kuenen,
                                                                   the sediment transport experiments mentioned offer tentative
1956; Kodama, 1994b; Lewin and Brewer, 2002; Attal and
                                                                   support for the brittle fracture approach, none of these stud-
Lave, 2009) because of the difficulty in directly observing
                                                                   ies examined individual collisions. Single-collision impact
attrition in the field (Sneed and Folk, 1958; Kodama, 1994a).
                                                                   studies on very brittle materials (like glass) at high speeds
These experiments utilize tumbling mills or circular flumes
                                                                   suggest that fragmentation by impact attrition is similar to
to simulate bed-load transport; results are extrapolated to the
                                                                   compression tests, though the peak stress must be modified
field using the duration of the experiment as a proxy for
                                                                   (Shipway and Hutchings, 1993). Impact studies at lower en-
downstream distance (Wentworth, 1919; Krumbein, 1941;
                                                                   ergies relevant for bed load, however, typically show neither
Kuenen, 1956; Kodama, 1994b; Lewin and Brewer, 2002;
                                                                   explosive nor fatigue–failure fragmentation. Rather, individ-
Attal and Lave, 2009). However, laboratory-derived values
                                                                   ual collisions produce a shower of small chips over a lim-
of α (Wentworth, 1919; Krumbein, 1941; Kuenen, 1956;
                                                                   ited skin depth of the material. For very brittle ceramics and
Kodama, 1994b; Lewin and Brewer, 2002; Attal and Lave,
                                                                   glasses, Hertzian fracture cones of shattered material form
2009) tend to be lower than those measured in the field
                                                                   where strain induced by the elastic shock wave from colli-
(Ferguson et al., 1996; Hoey and Bluck, 1999; Morris and
                                                                   sion exceeds yield (Wilshaw, 1971; Rhee, 2001; Mohajerani
Williams, 1999). It has been suggested that this is because
                                                                   and Spelt, 2010; Wang et al., 2017). This fracture process
impact energies in experiments are not as high as in the field
                                                                   has been implicated in bedrock erosion by aeolian impacts
(Kodama, 1994b), the assumption that experimental duration
                                                                   (Greeley and Iversen, 1987). For semi-brittle materials, some
as a proxy for travel distance does not account for attrition in
                                                                   ductile deformation occurs, resulting in detachment of finite-
place (Schumm and Stevens, 1973), or added effects of hy-
                                                                   size chips due to flow (Ghadiri and Zhang, 2002a; Antonyuk
draulic sorting on fining rates in the field are not accounted
                                                                   et al., 2006). Even brittle materials likely experience some
for (Ferguson et al., 1996; Paola et al., 1992). These reasons
                                                                   plastic deformation (Rhee, 2001; Momber, 2004b). Regard-
highlight the need for a more mechanistic approach to the
                                                                   less, chipping implies that the more relevant material prop-
impact attrition process. Various studies have established that
                                                                   erties are those associated with lateral crack formation at the
there is a linear relation between collision energy 1E and the
                                                                   surface rather than activation of cracks in the bulk (Greeley
mass removed 1M by the impact,
                                                                   and Iversen, 1987; Momber, 2004a, b).
1M = A1E,                                                   (2)       Most studies on impact attrition neglect the fine parti-
                                                                   cles, or attrition products, produced from the process – even
where A is a parameter that collects relevant material prop-       though it has been hypothesized that these products heavily
erties (Bitter, 1963; Anderson, 1986; Kafui and Thornton,          contribute to sand and silt populations found in rivers (Jerol-
1993; Ghadiri and Zhang, 2002a; Le Bouteiller and Naaim,           mack and Brzinski, 2010). Experiments and theory examin-
2011; Wang et al., 2011) that we will refer to as the attri-       ing the geometric evolution of pebbles during chipping pre-
tion number. Indeed, Sternberg’s law can be derived from this      dict that sediment can lose up to half of its original mass
linear relation (Szabó et al., 2015; Novak-Szabo et al., 2018).    just from rounding the edges of an initially angular pebble
There is less understanding and agreement, however, on what        (Domokos et al., 2014). With the large quantity of fines pro-
controls A. For commonly occurring rocks, different litholo-       duced from chipping, it is necessary to understand the size
gies can lead to a difference in attrition rates (amount of mass   distribution of these particles to understand their role in the
removed per unit impact energy) of 2 orders of magnitude for       river system. Kok (2011) found that the grain size distri-
the same collision energy (Attal and Lave, 2009). Based on         bution of dust aggregates follows a Weibull distribution, in
the premise that rocks fail in tension under impact (Johnson,      agreement with brittle fracture theory. The products of im-
1972), Sklar and Dietrich (Sklar and Dietrich, 2001, 2004)

Earth Surf. Dynam., 9, 755–770, 2021                                                 https://doi.org/10.5194/esurf-9-755-2021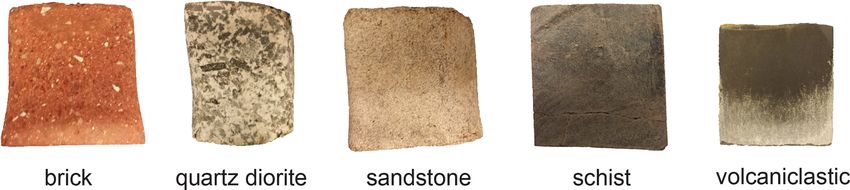
K. Litwin Miller and D. Jerolmack: Binary collision                                                                            757

pact attrition for natural rocks under collision energies rele-     elastic–plastic (or semi-brittle) deformation in natural rocks
vant for bed load have never been examined in this manner.          (Momber, 2004a). The utility of Ab and As for determining
   This paper explicitly isolates and investigates how lithol-      mass loss from attrition will be tested experimentally in this
ogy, shape, and collision energy influence rates of impact          study.
attrition for particles and energies representative of pebble          The second hypothesis that guides this work regards the
transport in rivers. First we determine how attrition rates         products of attrition. By the assumption from Griffith’s frac-
scale with energy by performing well-controlled binary col-         ture theory that pre-existing flaws are distributed indepen-
lision experiments. We conduct experiments on samples of            dently within a material and activate randomly during a frac-
different lithologies to determine which measured material          ture event, it is expected that fragments produced follow a
properties control the magnitude of attrition rates. Finally, we    Weibull distribution (Gilvarry, 1961):
characterize the grain size distribution of the products cre-
                                                                     dNf
ated during the attrition process to determine whether it fol-              ∝ Df−2 ,                                            (6)
lows the expected Weibull distribution. Building on previous        d ln Df
findings from bed-load attrition studies, this work considers       where Nf is the number of fragments of size Df . Kok (2011)
the mechanics of fracture and damage in solid materials to          discusses how this power-law relation follows from brittle
provide a better understanding of the underlying physics.           fracture theory and is a consequence of the manner in which
                                                                    cracks nucleate and propagate within the material as stress is
2     Methods                                                       applied. These principles describe the full fragmentation of
                                                                    materials, meaning that the aggregate completely breaks into
2.1    Hypothesis and experimental approach                         many small fragments with the largest of these fragments be-
                                                                    ing significantly smaller than the initial parent particle size.
We have two hypotheses that guide our experimental de-
                                                                    This is clearly not the case for chipping, in which the largest
sign. First, we hypothesize that kinetic energy and lithol-
                                                                    attrition product is much smaller than the intact parent parti-
ogy control attrition rates of river sediments. If we assume
                                                                    cle. We will test whether the products of our attrition exper-
that rocks are purely brittle, then from mechanical consid-
                                                                    iments follow the same power-law scaling for chipping. We
erations (Sklar and Dietrich, 2004; Attal and Lave, 2009;
                                                                    hypothesize that brittle fragmentation may still occur, though
Le Bouteiller and Naaim, 2011; Wang et al., 2011) we can
                                                                    over a small penetration depth near the impact site (Antonyuk
state that
                                                                    et al., 2006).
1M = f (1E, ρ, Y, σ ),                                       (3)
                                                                    2.2   Experimental design and methods
where 1M is the mass removed from an object after im-
                                                                    To simulate attrition between grains during saltation while
pact of energy 1E, and ρ, Y , and σ are the density of ma-
                                                                    isolating the effects of impact energy on mass attrition,
terial properties, Young’s modulus, and tensile strength, re-
                                                                    we examine the amount of mass lost due to collisions be-
spectively. Dimensional analysis yields two dimensionless
                                                                    tween two grains. Our experiment bears some similarity
groups, 51 = σρ1E1M
                     and 52 = Yσ . Rewriting to solve for mass
                                                                    to the Charpy impact test (Leis, 2013) – a standard tech-
                                         1M
loss per unit impact energy, we obtain   1E   = f (Ab ), where      nique for measuring the energy absorbed by a material (typi-
                                                                    cally metal) in producing fracture – but has modified bound-
       ρY                                                           ary conditions and geometry to better approximate binary
Ab ≡      ,                                                  (4)
       σ2                                                           bed-load collisions. Although collisions in water can be
which we will refer to as the brittle attrition number. An alter-   viscously damped, for sufficiently large grains (> 10−2 m)
native hypothesis is that impulsive collisions excite localized     these collisions are semi-elastic and independent of the fluid
plastic deformation at the surface, similar to what is often        (Schmeeckle et al., 2001). Therefore, since our main goals
observed in micro- and nano-indenter tests. In this case, ma-       are to determine the energy scaling of impact attrition and
terial properties related to semi-brittle deformation, such as      the sizes of attrition products, we conduct the experiments in
hardness (H ) and fracture toughness (Kc ), will determine at-      air instead of water for simplicity. The impact energies ap-
trition rates. Therefore, 1M                                        plied are comparable to those observed in nature (Kodama,
                          1E = f (As ), where
                                                                    1994b). Experiments are conducted using a double pendu-
       ρDH                                                          lum housed within a transparent tank to allow for the collec-
As ≡        .                                                (5)    tion of the products of attrition (Fig. 1). Rock samples are
        Kc2
                                                                    attached to threaded rods within the tank by gluing flat-faced
Here, D is the sample diameter, and the subscript “s” de-           nuts to the top of each sample. The rod with the impacting
notes semi-brittle (Ghadiri and Zhang, 2002b). We note that         grain is lifted by a motor and then released once it reaches a
the ratio H /Kc has been denoted the “brittleness index”            desired height, colliding with the stationary target grain. Af-
and shown to delineate the transition from purely elastic to        ter the collision, a braking system steadies the target grain

https://doi.org/10.5194/esurf-9-755-2021                                                 Earth Surf. Dynam., 9, 755–770, 2021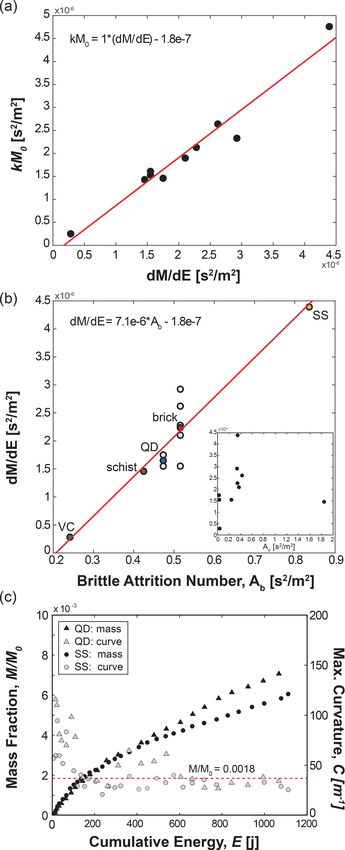
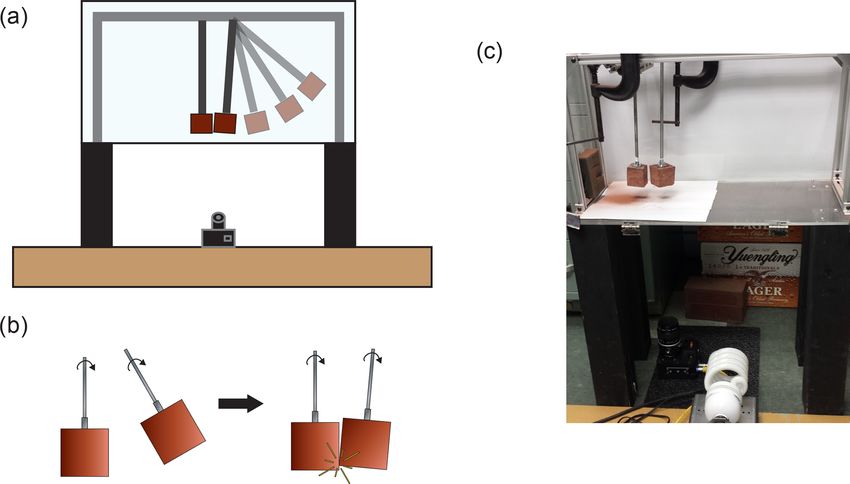
758                                                                          K. Litwin Miller and D. Jerolmack: Binary collision

while the motor lifts the impacting grain again for the next        lated as 1E = 21 m2iv , where mi is the mass of the impacting
collision. Both rods containing impacting and target grains         grain at the beginning of the set and v is the average velocity
are able to rotate freely in either direction, allowing attrition   measured from all videos in that particular set. Energies for
to occur evenly around the entire rock sample. To test the          experimental runs ranged from 0.035–0.220 J.
randomness of the grain rotation, we filmed approximately              We conducted binary collision experiments on the fol-
450 collisions between two test grains, recording the location      lowing different materials: brick, quartz diorite, sandstone,
of impact on both the impacting and target grains. The dis-         schist, and a volcaniclastic rock (Fig. 3). The brick was se-
tribution of impact locations indicates that the collisions oc-     lected as a test material for its homogeneous structure. We
cur preferentially on high-curvature regions of the protruding      used standard red clay builders bricks. Both the quartz dior-
corners, as expected from geometric chipping theory (Firey,         ite and volcaniclastic rocks were collected in the Luquillo
1974; Domokos et al., 2014) (Fig. 2), but are otherwise uni-        Mountains in northeastern Puerto Rico. The quartz diorite is
formly distributed around each grain. Grains are collided for       Tertiary in age and originates from a batholith on the south-
a set interval of impacts, which increases throughout the ex-       ern side of the Luquillo Mountains (Pike et al., 2010). The
periment from 50 to 10 000. After each set of collisions, the       volcaniclastic rock comprises most of the mountain and was
masses of both the impacting and target grains are measured         formed in the late Cretaceous from marine-deposited vol-
using a microbalance to determine the amount of mass lost           canic sediments (Pike et al., 2010). The sandstone is a Tri-
due to attrition.                                                   assic reddish arkose of the Stockton formation in southeast-
   A note of caution is in order regarding the geometry and         ern Pennsylvania (Olsen, 1980). The schist is Wissahickon
kinematics of our binary collisions compared to the situa-          schist from southeastern Pennsylvania and is highly de-
tion of bed-load transport. Fluvial pebbles impact the bed          formed due to regional metamorphism during the lower Pa-
at shallow angles, typically on the order of θ ∼ 10◦ . Such         leozoic (Weiss, 1949). The brick was tested multiple times
shallow angles reduce the bed-normal collision velocity by a        with different sizes of impacting samples to study the effect
factor sin θ (Sklar and Dietrich, 2004; Beladjine et al., 2007;     of increased impact energy on attrition rate. Table 1 lists the
Larimer et al., 2021) and proportionately reduce the mass lost      different rock types and sample sizes for each experimental
per impact (Larimer et al., 2021; Francioli et al., 2014). Bed-     run.
load particles may also rotate (Francis, 1973), adding an ad-          To control for shape effects on attrition rates, we ini-
ditional tangential velocity component to collisions. The ef-       tially cut all grains into cubes. For a subset of experiments
fect of this rotation on mass attrition, however, has not been      with particles composed of sandstone (n = 1), quartz dior-
studied. Moreover, it has been suggested that rotation is small     ite (n = 1), and bricks (n = 2), we tracked changes in the
compared to the magnitudes of horizontal and vertical ve-           shape of both impacting and target grains using a laser dis-
locities associated with saltation (Niño and García, 1998).         placement sensor to scan a single surface contour around the
The rounding of fluvial pebbles in nature indicates that bed-       grain. Scans are made at the beginning of each set of col-
normal chipping, rather than tangential (sliding) abrasion, is      lisions by holding the sensor in a fixed position while the
the dominant attrition mechanism under saltation (Novak-            grain is rotated at a constant rate of 3 rpm. A single contour
Szabo et al., 2018). The usual assumption in bed-load attri-        for each grain is made by averaging 1 kHz laser data from ap-
tion studies is that collision energy is determined by the bed-     proximately seven full rotations. The distance data are then
normal component of saltation velocity, which is roughly            smoothed using a high-pass filter at the noise floor, which
the terminal fall velocity of the particle (Sklar and Dietrich,     was determined from the time series of the entire dataset. The
2004). Despite the simplified collision scenario of our ex-         peak local curvature at each corner was calculated from the
periments, collision velocities are comparable in magnitude         second derivative of the measured contour. The peaks from
to computed terminal fall velocities for similar-sized parti-       all four corners were averaged to give a mean value of cor-
cles in water. We expect then that experiments can be used to       ner curvature. Shape data were only collected for two sets of
examine material and energy controls on mass loss but that          brick samples and a single set of quartz diorite and sandstone
observed trends will include an empirical prefactor that is re-     specimens.
lated to the specific details of our configuration.                    The relevant material properties needed to estimate Ab and
   In order to measure the impact energy, we recorded videos        As were measured for each lithology used in the experiment,
at the beginning of every set of collisions with a high-speed       although our characterization was not entirely successful (see
camera shooting at 1000 frames per second, mounted below            below). All measurements were made on 50 mm diameter
the transparent bottom of the tank. We captured 5–10 colli-         cores cut from ∼ 0.5 m rocks collected in the field (except
sions per set; in each video, we tracked the location of the        for the brick specimens). The density of each core was calcu-
impacting grain over approximately 40 frames (0.04 s) up to         lated by dividing measured mass by volume determined from
the time of collision. The impact velocity is measured as the       triplicate caliper measurements of the diameter and length of
slope of a linear fit to plots of travel distance versus time.      the cores. The average density of each lithology was deter-
The average velocity for all experiments was approximately          mined from 10–15 cores. Tensile strength was measured us-
1 m s−1 . The kinetic energy at impact (1E) is then calcu-          ing an indirect method called the Brazilian tensile test. This

Earth Surf. Dynam., 9, 755–770, 2021                                                  https://doi.org/10.5194/esurf-9-755-2021
K. Litwin Miller and D. Jerolmack: Binary collision                                                                                                             759

Figure 1. Schematic of experimental the setup. (a) Front view drawing depicting the binary collision double-pendulum apparatus. (b) Close-
up drawing illustrating how grains impact during collision. The impacting grain is raised then released, colliding with the stationary target
grain. Both grains are able to rotate freely. (c) Picture of the setup with brick clasts.

Table 1. Table listing measured material properties and experimental conditions for each set of samples.

  Sample       Lithology        Int. size     Density    Tensile str.   Young’s mod.   Hardness   Int. mass   Impact energy         Slope          Ab           As
                                  D [m]     ρ [kg/m3 ]     σ [MPa]          Y [GPa]    H [GPa]      M0 [g]            Ei [j]       k [j−1 ]   [s2 /m2 ]   [s2 /m2 ]
  B1           brick             0.0618          2072            7.5             14        567         490            0.159    3.88 × 10⁻⁶      0.516         NA
  B2           brick             0.0575          2072            7.5             14        567         394            0.148    5.40 × 10⁻⁶      0.516       0.370
  B4           brick             0.0562          2072            7.5             14        567         369            0.112    6.32 × 10⁻⁶      0.516       0.337
  B5           brick             0.0707          2072            7.5             14        567         734            0.213    3.60 × 10⁻⁶      0.516       0.424
  B6           brick             0.0400          2072            7.5             14        567         133            0.036    1.15 × 10⁻⁵      0.516       0.240
  QD1          quartz diorite    0.0395          2704           16.9          20–70        581         167            0.090    8.76 × 10⁻⁶      0.473       0.025
  QD2          quartz diorite    0.0488          2704           16.9          20–70        581         315            0.148    5.11 × 10⁻⁶      0.473       0.031
  SS1          sandstone         0.0649          2330           5.28             10        230         636            0.179    7.48 × 10⁻⁶      0.836       0.348
  S1           schist            0.0522          2667           6.63              7        649         381            0.091    3.76 × 10⁻⁶      0.425        1.85
  VC1          volcaniclastic    0.0441          2672           20.5           5–50        441         229            0.052    1.10 × 10⁻⁶      0.242       0.036
NA stands for not available.

test measures the peak load for each sample loaded in com-                             each rock type were made and averaged. Elastic modulus,
pression, at which point the sample fails in tension. A stress                         also known as Young’s modulus, is the proportionality fac-
was applied to each sample by placing it in a specially fab-                           tor between applied stress and elastic strain. We estimated
ricated metal fixture with a thin stick of bamboo between                              this quantity using an Olsen resonance tester (RT-1) and the
the sample and the fixture on each side of the loading plane.                          methods prescribed by the ASTM C215 standard. In sum-
The bamboo sticks ensured that the load was only applied to                            mary, an accelerometer is attached to the flat face of one end
the parallel radial axes at the top and bottom of each sam-                            of the core, while a force is applied to the other end by hitting
ple. The fixture was then placed between two metal plates of                           it with a small hammer. The applied force sends a vibrational
a Versa-loader, an apparatus used to apply a compressional                             wave through the core while the accelerometer records the
load at a constant strain rate to the sample. As the sample                            longitudinal fundamental frequency. The elastic modulus (Y )
fails, fractionation occurs parallel to the loading direction;                         is then calculated using the expression Y = βMf 2 , where β
the peak load at failure is recorded. The tensile strength of                          is a shape correction factor equal to 5.093 Dl 2 for cylindri-
each sample is computed using this value of peak load in ad-                           cal cores, M is the sample mass, and f is the recorded fun-
dition to the dimensions of the sample through the following                           damental frequency. As with the other material properties,
                   2F                                                                  10–15 measurements were taken and averaged to get a mean
expression: σ = πlDp , where Fp is the peak force applied to
the sample at failure, l is the length of the sample, and D is its                     value for each lithology. This test produced reliable values
diameter (Vutukuri, 1974). In order to reduce the uncertainty                          of elastic modulus for brick, schist, and sandstone, but we
of the value of the tensile strength, 10–15 measurements for                           were not able to perform this test on the quartz diorite or

https://doi.org/10.5194/esurf-9-755-2021                                                                        Earth Surf. Dynam., 9, 755–770, 2021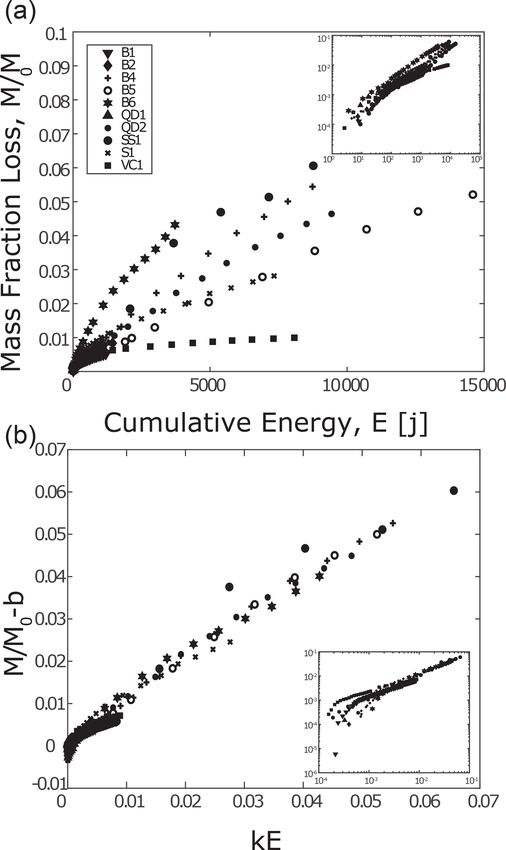
760                                                                             K. Litwin Miller and D. Jerolmack: Binary collision

                                                                       and from sample to sample, and it was sometimes unde-
                                                                       tectable. We can only then crudely assess fracture toughness
                                                                       based on scaling relations derived from simplifying assump-
                                                                       tions and empirical relations – though there is some back-
                                                                       ing from atomistic calculations (Emmerich, 2007). For brit-
                                                                       tle materials it is widely reported that fracture strength scales
                                                                       with Young’s modulus, σf ≈ Y /10 (Yuan and Xi, 2011),
                                                                       which relates to fracture toughness (with some assumptions)
                                                                                     √
                                                                       as Kc ≈ σf rc , where rc is the crack tip radius of curvature
                                                                       (Emmerich, 2007). This implies that we may estimate the
                                                                       semi-brittle attrition number as As = ρDH /(Y 2 rc ), neglect-
                                                                       ing prefactors. We have no method available to estimate rc
                                                                       in our experiments; in the absence of information we will as-
Figure 2. Randomness test for collision rotation. Plot showing the     sume its variation is negligible compared to H and Y . Table
histogram of impact locations for impacting and target grains. Peaks   1 lists all the values of material properties used in this study.
correspond to corners of the cuboid grains. The inset shows a plan        To better understand the modes of mechanical failure in
view of square rock with a labeled location of x = 0 at one of the     the colliding particles, we prepared polished thin sections
corners and subsequent corners at x = 40 mm, x = 80 mm, and x =        and examined them using a scanning electron microscope
120 mm.                                                                (SEM). The thin sections were parallel to planes that were
                                                                       perpendicular to the impact surface (Fig. 4a) and are im-
                                                                       aged between 200 and 6000 magnification using an FEI 600
volcaniclastic rocks because the sample specimens were not             Quanta FEG environmental scanning electron microscope.
long enough. Instead, ranges of elastic modulus values from            Images were taken progressively along the edge of the sam-
the literature were compiled, indicating that values for quartz        ples (Fig. 4b, c) and compared to images of the sample inte-
diorite span a range from 20 to 70 GPa (Hughes and Jones,              rior. We then quantified the length scale over which damage
1950; Merriam et al., 1970; Pratt et al., 1972; Fletcher et al.,       occurred by taking between 600 and 1000 measurements of
2006), and values for volcaniclastic rock span a range from 5          the length of the most interior crack that can be continuously
to 50 GPa (Carlson and Wilkens, 1983; Apuani et al., 2005;             tracked to the surface from different locations around each
Frolova, 2008; Rotonda et al., 2010).                                  grain.
   Hardness was calculated using a standard Vickers hard-                 Finally, following each set of collisions, the products of
ness test (ISO 6507-1:2005(E)); a Knoop micro-indentor                 the attrition process were collected from the bottom of the
with a pyramidal diamond tip was used, and a 1000 g load               tank. Although we attempted to collect all of the products,
was applied for 10 s. Samples were cut into 1 cm cubes, and            small dust particles (< 1 µm) were observed to settle outside
faces were polished with progressively finer grit down to              the tank, so we only reliably collected grains larger than that
9 µm; this polishing is necessary in order to visualize the            size. Fines produced throughout the entire experimental run
small indentations created by the test. Images at 50× mag-             for each pair of rocks were combined into one population for
nification allowed measurement of the diagonal lengths of              grain size analysis; i.e., we did not track the evolution of attri-
the indent (typically tens of microns). A minimum of 6 and             tion products through repeated collisions. Because the attri-
maximum of 15 indentations were measured for each sam-                 tion products span a wide range of sizes, to fully characterize
ple, depending on image quality and our ability to find in-            the grain size distribution (GSD) we employed two methods.
dents in the microscope; these values were averaged for each           First, to describe the coarse grains, we wet-sieve the attri-
sample. Fracture toughness is the energy absorbed by a ma-             tion products into three size fractions: < 0.5, 0.5 to 1.0 mm,
terial before cracking; it is often estimated in a standard uni-       and > 1.0 mm. The coarser two fractions are dried in an oven
axial stress test by integrating the area of the stress–strain         and subsequently weighed to determine their contribution to
curve. Our strength test only measured peak stress, how-               the entire size distribution. The grain size of the attrition
ever, so we could not employ this method. Moreover, such               products finer than 0.5 mm is measured using the Beckman
a bulk measure of fracture toughness is not necessarily in-            Coulter laser diffraction particle analyzer, which determines
dicative of shallow surface cracking associated with chip-             the volumetric GSD by deconstructing the diffraction pattern
ping (Ghadiri and Zhang, 2002b). It has been proposed that             produced by shining a laser through a liquid solution contain-
the length of cracks developed at the corners during a micro-          ing the fine-grained sample. Because of the large quantity
indenter test can be used to calculate fracture toughness; this        of fines produced in the experiments, we perform repeated
method, however, is not without controversy (Ghadiri and               subsampled measurements of grain size using the Coulter
Zhang, 2002b). We attempted to estimate fracture toughness             counter. We select five subsamples from a mixture of fine par-
using this method, but unfortunately our results were incon-           ticles and deionized water. To ensure consistent subsampling
clusive; crack development varied widely within a sample               of a homogenous mixture, we use a magnetic stirrer while se-

Earth Surf. Dynam., 9, 755–770, 2021                                                      https://doi.org/10.5194/esurf-9-755-2021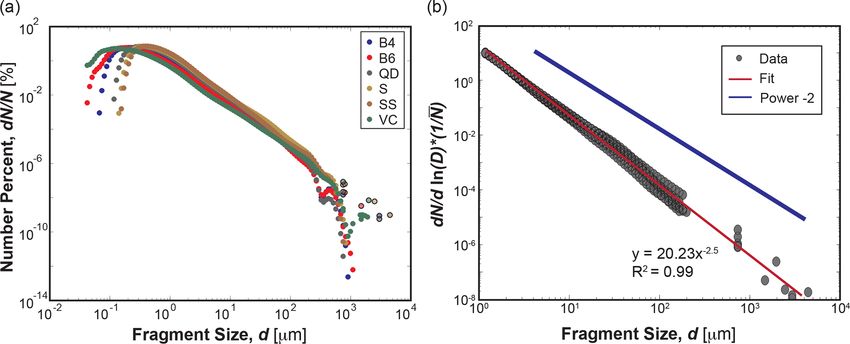
K. Litwin Miller and D. Jerolmack: Binary collision 761
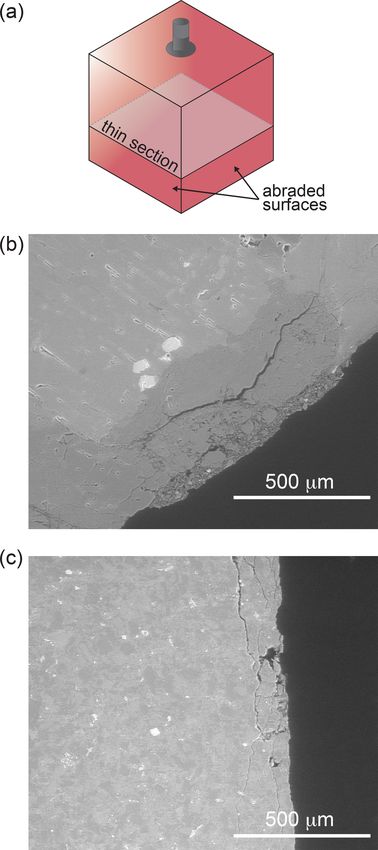
Figure 3. Images of samples of all rocks used in the experiments. The images were taken at the end of each experiment, so there is noticeable
rounding of the edges.
3 Results
We conducted the binary collision experiments on a total of
five sets of bricks, two sets of quartz diorite, and one set each
for the sandstone, schist, and volcaniclastic rock. Through-
out the course of each experimental run, the initially cuboid
rocks would quickly lose their sharp corners and then slowly
become rounder without any major fragmentation. There
were two exceptions to this case. First, for the sandstone at
around 20 000 collisions, a large piece roughly 2 cm long and
1 cm wide broke off one of the corners, exposing a reddish-
orange oxidized surface. Second, with the schist on three oc-
casions, the entire block more or less split in two, fracturing
at weathering planes. In both cases, fracturing occurred at a
pre-existing weak region of the rock that appeared to be asso-
ciated with chemically weathered surfaces. Furthermore, for
both sandstone and schist we observed that immediately fol-
lowing the large fracture events, the mass loss of the parent
grain would increase as the freshly exposed rough surface of
the grain smoothed.
We define cumulative mass loss as M = 6n=1...N 1M,
where N is the cumulative number of collisions, and equiv-
alently cumulative impact energy as E = 6n=1...N 1E. Plots
of cumulative mass loss against cumulative impact energy
for all rock types show two distinct patterns: an initial rapid
phase of mass loss that is similar for all lithologies and im-
pact energies, followed by a transition to a slower, linear
mass loss curve whose slope varies with rock type (Fig. 5a).
Figure 4. Thin section preparation and SEM images. (a) Schematic To verify the functional relationship between mass loss and
drawing showing the location in a grain where thin sections were
energy while controlling for material properties, we per-
made. (b) SEM image of quartz diorite. (c) SEM image of volcani-
formed experiments with three different masses of brick
clastic rock.
spanning a range of collision energies of 0.04–0.22 J. Mass
loss curves for all experiments are in good agreement with
lecting samples. We compared measured GSDs from all five each other and with a single linear trend (Fig. 6). Linear fits
subsamples to ensure that each was uniform and representa- were then made to the second slower phase of all mass loss
tive of the entire population. We then merge the grain size curves, resulting in the relation
data for the coarse grains from sieving with the fine grains
from the particle analyzer by normalizing the volume frac- M/M0 = kE + b. (7)
tion for each by the total volume lost during the experiment,
calculated from measured mass and density values. Follow- To test the robustness of the linear fit, we generated a plot
ing the method used by the particle analyzer, the distribution of M/M0 − b versus kE, where b would be dimensionless
is converted from volume fraction to number fraction by as- and k would have units of inverse energy. The quantity kE is
suming the grains are spheres. analogous to E/Es , where Es is hypothesized to be a critical
energy for chipping or fragmentation to occur. The collapse
https://doi.org/10.5194/esurf-9-755-2021 Earth Surf. Dynam., 9, 755–770, 2021
762                                                                                K. Litwin Miller and D. Jerolmack: Binary collision

                                                                         Figure 6. Attrition rate for bricks with different collision energies.
                                                                         Plot of total cumulative mass abraded versus cumulative impact en-
                                                                         ergy for three sets of brick with different masses. The inset displays
                                                                         a plot of average mass abraded per impact versus average energy
                                                                         per impact. Each data point corresponds to a separate set of bricks.

                                                                         attrition rates M/E for all samples (Fig. 7b) and demon-
                                                                         strates good correlation with some scatter, likely due to un-
                                                                         certainty in material property measurements, indicating that
                                                                         the brittle attrition number incorporates appropriate mate-
                                                                         rial properties to describe the long-term attrition of differ-
                                                                         ent lithologies. Although same order of magnitude as Ab , the
                                                                         semi-brittle attrition number As varies widely and does not
                                                                         correlate strongly with observed attrition rates M/E (Fig. 7b,
                                                                         inset); we do not consider this parameter further in our anal-
                                                                         ysis.
                                                                            We now turn to the intercept (Fig. 7a). We find that the
Figure 5. Attrition mass loss curves. (a) Plot of total cumulative       value b in Eq. (7) is related to the quantity of pebble mass that
mass loss versus cumulative impact energy for each set of rocks.         is lost before attrition reaches the slower, linear portion of the
(b) Plot of total cumulative mass loss minus y intercept, b (Eq. 7),     mass loss curve (Fig. 7c). In other words, it is the amount of
from linear fits to raw data in (a) versus cumulative impact energy      attrition that occurs in the rapid first portion. The parameter
multiplied by the value of fit slope. Insets for both (a) and (b) dis-   b is related to the initial mass loss of each particle, with an
play plots with log–log axes.                                            average value of b = M/M0 = 0.0018, and is approximately
                                                                         constant for all experiments (Fig. 7c). This result suggests
                                                                         that all particles transition to the slower, linear portion of
of data for all experiments shows that a linear relation is rea-         the mass loss curve when they have lost a certain fraction
sonable, but as anticipated it fails to fit the initially steep por-     of mass. Since collision energies and rock strengths are dif-
tion of the mass loss curve (Fig. 5b). We want to relate the             ferent, the only factor common to all experiments is particle
two parameters in the linear fit (Eq. 7) to physically mean-             shape; all particles were initially cuboids. To test whether b
ingful quantities. We turn first to the slope k, which controls          is related to shape, we plot the evolution of corner curvature
the long-term attrition rate (dM / dE) for a given energy and            and mass against cumulative energy (Fig. 7c) for the sub-
should be controlled by material properties – and hence be               set of samples for which shape was measured; results show
related to the attrition number A. We approximate the long-              that the former tracks the latter and becomes approximately
term attrition rate, dM / dE, using the total mass loss divided          constant when rock mass M/M0 ≥ 0.0018. This value is the
by the cumulative impact energy, M/E. Data indicate that                 same as b (Fig. 7a), meaning that curvature of corners be-
the fitting parameter k is directly proportional to the long-            comes constant when the fraction of mass lost is equal to
term attrition rate (Fig. 7a), with a slope of 1. This direct            b = M/M0 .
relationship indicates that the slope to the linear fit data, k,            By putting together the brittle attrition number and initial
reasonably characterizes the long-term attrition rates for all           mass corresponding to k and b, the attrition relation for mass
of the lithologies explored in this study.                               loss versus impact energy is
   We can then examine the relation between the attrition                               ρY
numbers and the long-term attrition rates for each lithology.            M/M0 = C1         E + C2 = C1 Ab E + C2 ,                         (8)
                                                                                        σ2
The brittle attrition number Ab is plotted against long-term

Earth Surf. Dynam., 9, 755–770, 2021                                                         https://doi.org/10.5194/esurf-9-755-2021
K. Litwin Miller and D. Jerolmack: Binary collision                                                                                   763

                                                                         where

                                                                         C1 = 7.1 × 10⁻⁶ and C2 = 0.0018.                              (9)

                                                                         The data collapse in Fig. 5b justifies this equation. For the
                                                                         case when M  0.0018M0 , the attrition relation reduces to
                                                                                                 M
                                                                         M/M0 = C1 Ab E →            = C1 Ab .                        (10)
                                                                                                M0 E
                                                                         This brittle attrition relation suggests that when the sharp
                                                                         edges are worn away, the attrition rate is directly proportional
                                                                         to the brittle attrition number multiplied by the constant C1 .
                                                                            The SEM images show a considerable amount of damage
                                                                         in the region near the edge of the grains (Fig. 4b, c). This
                                                                         damage is characterized by large cracks that span parallel to
                                                                         the collision surface with smaller cracks branching perpen-
                                                                         dicular to them. In some instances, these cracks produced
                                                                         from impact intersect inherent cracks or grain boundaries of
                                                                         the material, extending the damage zone further into the in-
                                                                         terior of the grain. The results of the damage zone length
                                                                         measurements are plotted in Fig. 8. Note that the measured
                                                                         distributions of crack lengths from the SEM images are un-
                                                                         reliable in the small length limit due to image resolution. On
                                                                         the other hand, the large length limit is an order of mag-
                                                                         nitude larger than the smallest resolvable length, so these
                                                                         measurements are dependable. Further, for the thin sections
                                                                         imaged, we were only examining a single two-dimensional
                                                                         plane of a three-dimensional object. Therefore, a measured
                                                                         crack length is a result of both the actual crack length and its
                                                                         orientation, as the length of the cracks running obliquely to
                                                                         the thin section plane will be underestimated. The tail of the
                                                                         distribution of lengths shows power-law scaling with expo-
                                                                         nents that range in value from −1 to −2.3. We observe con-
                                                                         vergence of all distributions for each lithology in the large
                                                                         length limit, where the cracks are easiest to discern and mea-
                                                                         sure. However, in the lower length limit, the distributions
                                                                         separate from one another as the length measurements be-
                                                                         come less reliable due to the resolution of the images.
                                                                            The results from the characterization of the GSD of attri-
                                                                         tion products are shown in Fig. 9. The plot combines the full
                                                                         measurements from the laser particle analyzer and sieving
Figure 7. Attrition numbers. (a) Plot of slope (k) from linear fits to   methods. Distributions from all lithologies and experimental
normalized mass curves multiplied by initial mass versus total mass      runs show the same functional form. However, the full distri-
loss over total energy for all samples. (b) Plot of dM / dE versus       butions display artifacts of the measuring techniques in both
brittle attrition number. Each data point represents a different sam-    the fine and coarse tails of the distributions. For the fine tail,
ple; VC is volcaniclastic, QD is quartz diorite, and SS is sandstone.
                                                                         the distributions drop off rapidly, presumably due to the com-
For lithologies with multiple samples, colored data points are the
average attrition rate, with grayed data points showing results for
                                                                         bined effects of the low-end measuring limit of the particle
individual samples. The inset is a plot of calculated semi-brittle at-   analyzer and the loss of material during the collection of attri-
trition number. (c) Plot showing change in mass fraction (left axis)     tion products. For the coarse end of the Coulter counter data,
and maximum curvature (right axis) versus cumulative impact en-          sieving produces artifacts in the grain size distributions as the
ergy for quartz diorite and sandstone samples. They both transition      particle size approaches the sieve diameter, as is evident by
from a high rate of change to a slower one at an average intercept       the erratic fluctuations in the grain size distributions on ap-
value of M/M0 = 0.0018.                                                  proach to d = 0.5 mm. Ignoring Coulter counter data over the
                                                                         range 0.2–1.0 mm, we observe consistent and smooth grain
                                                                         size distributions from 1 µm to the maximum observed size

https://doi.org/10.5194/esurf-9-755-2021                                                       Earth Surf. Dynam., 9, 755–770, 2021
764 K. Litwin Miller and D. Jerolmack: Binary collision
Figure 8. SEM results. (a) Plot of the distribution of the length of damage within abraded rocks from SEM images of thin sections. (b) Dam-
age lengths plotted in the form of Eq. (6) with corresponding power-law fits. (c–f) SEM images of the largest crack length for each rock type
outlined in red. (c) Brick. (d) Quartz diorite. (e) Sandstone. (f) Volcaniclastic rock.
from sieve analysis for all rock types. To determine the func- 4 Discussion
tional form of the grain size data, we remove the unreliable
data points that are biased by the measurement method; for
While a linear relation between mass loss and impact energy
the fine tail, this includes grain sizes less than 1 µm, and for
has been shown to reasonably model aeolian erosion (An-
the coarse tail this includes particle analyzer data greater than
derson, 1986) and has been inferred in models of bedrock
200 µm. We normalize each curve by its mean value, collaps-
erosion (Sklar and Dietrich, 1998, 2004), our experiments
ing all curves onto each other so that we may fit one function
definitively demonstrate that this linear relation is applicable
to the entire dataset for all lithologies. We then solve for the
for energies associated with fluvial bed-load transport over
best-fit power law to all data points (Eq. 6). The fit shows an
a wide range of rock strengths. There is an intriguing shape
exponent of −2.5, which is slightly higher than the expecta-
dependence of the initial attrition rate. Indeed, data seem to
tion of −2 for full fragmentation, but still follows a Weibull
indicate that these initially very angular cubes all erode at
distribution with very good agreement (Fig. 9).
the same rate regardless of energy or strength until the cor-
ners are suitably rounded such that energy and rock strength
Earth Surf. Dynam., 9, 755–770, 2021 https://doi.org/10.5194/esurf-9-755-2021K. Litwin Miller and D. Jerolmack: Binary collision 765
Figure 9. Grain size distributions of products of attrition. (a) Plot of the number distribution of grain size from the particle analyzer (solid
circles) and sieving (circles with black outlines) methods. (b) Number distribution of grain size plotted in the form of Eq. (6) and normalized
by the mean value. Data are combined for all lithologies. Data believed to be affected by the measuring technique are excluded from the plot
(< 1 and > 200 µm from the particle analyzer). Data are fit with a power-law function with exponent of −2.5. The solid blue line denotes the
expectation from brittle fragmentation: power law with exponent −2.
become important. We surmise that in this region the corners ing of C1 likely combines a few factors, certainly including
are so sharp that virtually any impact can remove mass be- the details of the collision itself, the impact angle, rotation
cause the yield stress will be locally exceeded in the limit speed of the impactor, and other aspects of the collision ge-
of infinite curvature (Ghadiri and Zhang, 2002a). However, ometry (Wang et al., 2011). The value of C1 may also be
as observed in this study, rocks achieve the secondary linear related to particle shape, although experiments by Domokos
mass loss curve quickly while their shapes are still very close et al. (2014) show that dM / dE is constant for a given par-
to cuboids. Thus, for natural streams it is likely a reasonable ticle over nearly the entire evolution from cuboid to sphere,
assumption that b may be neglected; therefore, the relation suggesting perhaps that C1 is independent of shape. Our data
M/(M0 E) ' k = C1 A is the applicable one to examine attri- tentatively suggest that C1 is independent of material prop-
tion in natural streams. erties, since it is (roughly) constant across a range of ma-
The slope k has units of 1/energy, and thus 1/k may be terial properties. Regardless, the brittle attrition number Ab
generically interpreted as a critical energy associated with appears to be a useful similarity criterion for comparing lab-
breakage for each material. How energy relates to breakage oratory and field attrition rates; however, rates determined
depends on the failure mechanism, in particular how elas- from our experiments may not yet be directly scalable to the
tic or plastic the deformation associated with collision is field due to uncertainty in the controls on C1 .
(Momber, 2004b). We examined two different formulations While the brittle attrition number appears to describe the
for the attrition number, A. It appears that our data are rea- scaling of mass loss by chipping reasonably well, this still
sonably well described by Ab = ρY σ2
and not by As = ρDH Kc2
, provides an incomplete picture. In particular, the actual value
indicating that material failure may be considered to be in of mass or volume removed per impact must be calibrated
the brittle regime. While previous work showed that bedrock with experiment. The SEM images of sectioned rocks show
erosion rate depends on the inverse square of the tensile a zone of damage accumulation in a shallow region below
strength (Sklar and Dietrich, 2004), our experiments eluci- the surface (Figs. 4, 8). Our measurements show some iso-
date clearly and simply which rock material properties need lated, surface-normal cracks that penetrate several hundred
to be taken into account through the development and verifi- microns below the surface (Fig. 8). More common, how-
cation of Ab . A similar attrition parameter was proposed by ever, are shattered regions of surface rock that are bounded
Wang et al. (2011) for the erosion of yardangs by windblown from below by surface-parallel cracks at depths of a few
sand, but the material control on attrition rate was not iso- hundred microns (Figs. 4, 8d, 8e). This is important be-
lated from collision energy in their work. Moreover, here we cause lateral cracks are known to produce chipping for nat-
verify the concept for energies relevant to fluvial transport. ural rocks (Momber, 2004a). Our examination of the dam-
Wang et al. (2011) noted that the parameter Ab can be con- aged rock took place after thousands of collisions, so we
sidered to be the elastic potential energy per unit volume at do not know what the damage zone from a single impact
the yield point. We note, however, the existence of the pref- looks like. Our observations could be explained, however,
actor C1 , which at present is an empirical parameter derived by the merger of Hertzian fracture cones that often form in
from our particular experimental setup. The physical mean- ceramics and glasses (Wilshaw, 1971; Greeley and Iversen,
1987; Rhee, 2001; Mohajerani and Spelt, 2010); it has also
https://doi.org/10.5194/esurf-9-755-2021 Earth Surf. Dynam., 9, 755–770, 2021766 K. Litwin Miller and D. Jerolmack: Binary collision been claimed that such fracture cones explain the surface tex- at the tips of these cracks is released as the crack propagates. ture of sediment grains (Greeley and Iversen, 1987; Johnson Growth and intersection of these cracks cause the ultimate et al., 1989). In this model, elastic wave propagation outward failure of the material. In the large energy limit of crush- from the impact site shatters rock in a small region in which ing, whereby complete disintegration of the parent particle a critical strain is exceeded (Wilshaw, 1971; Rhee, 2001). occurs, Gilvarry and Bergstrom (1961) showed that the Grif- While still a brittle response, this failure mode is distinct fith fracture model implies that the attrition products should from the cyclic fatigue mechanism that has been proposed have a GSD that follows the form of Eq. (5). More recent nu- to activate slow growth of cracks in fluvial bedrock erosion merical simulations and laboratory experiments have shown (Sklar and Dietrich, 1998, 2004). In high-resolution simula- that the value of the exponent depends on the mechanism tions of impacts on silica glass (Wang et al., 2017) – with of fracture (i.e., grinding, collision, or expansive explosion) energies and material properties comparable to our quartz and the impact energy (Kun and Herrmann, 1999; Astrom diorite collisions – formation of Hertzian cones produced et al., 2004; Kok, 2011). However, none of these studies ex- locally shattered near-surface regions that appear similar in amined the low-energy limit of chipping that is relevant for style and scale to our images (Fig. 8). Importantly, this pro- bed-load transport. The scaling exponent of −2.5 for the at- cess is known to generate small chips (Rhee, 2001; Moha- trition products of these binary collision experiments is sur- jerani and Spelt, 2010; Wang et al., 2017). We tentatively prisingly robust across a range of rock types, indicating a suggest that chipping in our experiments – and in pebble commonality in the failure modes of these different materials rounding and bedrock erosion generally – is dominated by under the energies examined. The exponent is also within the Hertzian fracture. We note that Hertzian fracture has already range of values reported from studies of brittle fracture frag- been proposed as the primary mechanism for rock erosion mentation. These observations support the notion that brittle by aeolian saltation impact (Greeley and Iversen, 1987) but fracture is the mechanism that creates the products of attri- was not examined in detail. Fatigue loading and associated tion in our experiments. The large size limit seems governed slow fracture growth likely contribute to fragmentation that by the depth of the damage zone. As for the lower size limit, produces larger particles. In our experiments such fragmen- an obvious candidate would be the size of constituent parti- tation was rare but did occasionally occur; it is likely to be cles in each rock type, i.e., sand grains for the sandstone and more common in weaker rocks that are highly weathered (see clay particles for the brick. Although we could not resolve below) or for higher collision energies. the finest particles owing to loss, it is clear that fragmenta- Maximum measured crack lengths and damage zone tion through constituent particles occurs. The determinant of depths are comparable to the maximum size of attrition prod- the lower size limit remains unknown. Nonetheless, chipping ucts in our experiments (Figs. 8, 9). Both crack-length and robustly produces sand- and silt-sized particles, supporting attrition-product size distributions are power laws, though the proposal that it is an important contributor of sediment to scaling of the former varies among materials and may not rivers and beaches (Jerolmack and Brzinski, 2010). be reliable due to measurement limitations. We surmise that In the limit where k = 0, the brittle attrition number, Ab , the attrition-product GSD is produced directly by localized does not likewise approach zero but is instead associated with (Hertzian) impact shattering, but we acknowledge that more Ab = 0.25 s2 /m2 (Fig. 7b). This non-vanishing value of Ab work is needed at the individual collision scale – in particu- implies that for the range of energies examined in this exper- lar, examining the shattered impact region of a rock in 3D. iment, there is a limiting rock strength at which little or no It is somewhat surprising that maximum crack and attrition- attrition occurs. This is similar to the proposed lower limit product sizes vary little across all lithologies. Hertzian frac- for collision energy, below which chipping does not occur ture cone size should depend on material properties such as (Ghadiri and Zhang, 2002a; Novak-Szabo et al., 2018). This fracture toughness and Young’s modulus, and also on the result would suggest that some materials should not erode applied load (Wilshaw, 1971; Rhee, 2001; Mohajerani and significantly under impact energies representative of bed- Spelt, 2010; Wang et al., 2017). We speculate that more dy- load transport. For our experiments, the volcaniclastic rocks namic range is needed in terms of both material properties are close to this limit. Observations of downstream evolu- and impact energies to see the effects of these factors. We tion of pebble shape for volcaniclastic rocks in the Mameyes also acknowledge our limited measurements due to the ex- River in Puerto Rico have shown that significant attrition oc- perimental challenges, which make our estimated maximum curs (Litwin Miller et al., 2014). However, the pebbles from sizes unreliable. Nonetheless, the GSDs of attrition products the field were all at least 4 times larger than those used in are well resolved, covering 4 orders of magnitude in size, and the laboratory, while estimated collision velocities were com- their similar form across lithologies demands a generic ex- parable. The combined observations of volcaniclastic rocks planation. A classic model for understanding GSDs resulting from experiments and the field suggest the possibility that, as from wear is the brittle fracture theory developed by Grif- particles lose mass downstream due to chipping, there is a po- fith (1921), who hypothesized that all materials contain pre- tential lower limit in size that is controlled by rock strength. existing flaws or cracks. The theory states that when an ap- This idea needs to be explored in more detail. plied stress exceeds a critical value, the concentrated stress Earth Surf. Dynam., 9, 755–770, 2021 https://doi.org/10.5194/esurf-9-755-2021
K. Litwin Miller and D. Jerolmack: Binary collision                                                                                767

   Although results from these experiments display a steady         ture cones. More theoretical and single-impact experimen-
linear mass loss with impact energy, as evident in the large        tal work is necessary, however, to understand the underlying
fracture events with the sandstone and schist, chemical             mechanics of fracture and damage. More pointedly, measure-
weathering can play an important role in the breakdown of           ments of fracture toughness for rock surfaces due to impact
river sediment (Jones and Humphrey, 1997). Howard (1998)            – rather than the usual estimates from bulk fracture under
observed higher rates of bedrock erosion in regions with            static loads – are needed; Hertzian fracture tests could be a
more chemical weathering and thereby showed that chemi-             useful technique for this (Wilshaw, 1971). In addition, we
cal weathering weakens rocks and reduces material strength.         have identified a possible shape control on attrition rate in
While we find that material properties control attrition rates,     the initial stage at which particles are very angular. This is
chemical weathering can cause a weakening of these material         intriguing from a mechanics point of view, but it is likely
properties. We observe fragmentation events along weather-          negligible in nature as the effect is only manifest when cor-
ing planes similar to those observed in experiments of Ko-          ners are exceedingly sharp.
dama (1994b). In these instances, new angular and rough                Our experiments have shown that material properties can
surfaces produced from the fragmentation process have high          be accounted for reasonably simply; however, results can-
attrition rates. On the one hand, chemical weathering ap-           not be scaled directly to the field until the constant C1 is
peared to create internal planes of weakness that facilitated       understood. We hypothesize that this coefficient is primar-
failure of large chunks under low-energy attrition. Indeed,         ily controlled by the details of the collision process, which
these events caused fluctuations in the mass loss curves that       determine how much impact energy contributes to damage
were not observed in more structurally sound (stronger) ma-         as opposed to friction or rebound of the target. Once C1 is
terials. However, when observed over thousands of collisions        resolved, one may use a mechanistic model of bed-load col-
(i.e., many fracture and/or failure events), the sandstone and      lision energy and frequency to estimate attrition rates in nat-
schist rocks collapsed onto the same linear curve as other          ural rivers. If the grain size distributions of attrition products
lithologies after accounting for material strength. It appears      are indeed universal, they could also be used to estimate the
that mechanical weakening from chemical weathering may              quantities of sand, silt, and dust that result from attrition by
be reasonably described with the measured material proper-          bed-load transport. If the results of Domokos et al. (2014)
ties that constitute Ab , so long as tested rock cores are rep-     and Litwin Miller et al. (2014) are correct that up to 50% of
resentative of the rocks in question. In a natural setting, we      a pebble’s mass is lost during transport downstream, signif-
expect that the effects of chemical weathering will be more         icant quantities of these fine grains are produced in natural
dominant in transport-limited environments where chemical           rivers.
weathering rates outpace mechanical attrition. On the con-
trary, where sediment is transported frequently, mechanical
wear is actively maintaining fresh unweathered surfaces on          Data availability. All data used for plots in this paper are de-
rocks, and therefore weathering features are not able to per-       posited on figshare, a publicly available and open repository:
sist. Finally, we note that impact attrition experiments show       https://doi.org/10.6084/m9.figshare.13169498.v1 (Litwin Miller,
that water may reduce the strength of silicate materials by         2020).
half compared to measurements in air (Johnson et al., 1973).
This is expected to influence the rate but not the style of at-
                                                                    Author contributions. KLM led the research, performed data
trition and serves as another caveat to applying our measured
                                                                    analysis, and wrote the paper. DJJ supervised the research, assisted
results to the field.
                                                                    in data interpretation, and edited the paper.

5   Conclusions                                                     Competing interests. The authors declare that they have no con-
                                                                    flict of interest.
The results of this laboratory investigation suggest that the
main consequences of fluvial attrition are encapsulated in
two “universal” relations. First, we verified a linear mass–        Disclaimer. Publisher’s note: Copernicus Publications remains
loss relation for energies and particle sizes associated with       neutral with regard to jurisdictional claims in published maps and
fluvial transport. In doing so, we have shown which mate-           institutional affiliations.
rial properties control the amount of mass loss per unit en-
ergy, providing a mechanistic underpinning to attrition “sus-
ceptibility” (Anderson, 1986) and helping guide researchers         Acknowledgements. We thank Gerard Salter and Raleigh Martin
regarding how to characterize lithology’s control on attri-         for their assistance in the laboratory. Thank you to Leonard Sklar
tion. Second, the grain size distributions for attrition products   for allowing use of equipment and lab space for material property
suggest that brittle fracture creates fragmentation over a re-      measurements and Sirui Ma for hardness measurements. We thank
                                                                    the editor, Francois Metivier, and reviewers, namely Stephanie De-
stricted skin depth that may be associated with Hertzian frac-

https://doi.org/10.5194/esurf-9-755-2021                                                  Earth Surf. Dynam., 9, 755–770, 2021
You can also read