Converging to Convergence - National Bureau of Economic Research
←
→
Page content transcription
If your browser does not render page correctly, please read the page content below
Converging to Convergence

            Michael Kremer                  Jack Willis                        Yang You∗
          University of Chicago         Columbia University          The University of Hong Kong

                                                 June 2021

                                                  Abstract

          Empirical tests in the 1990s found little evidence of poor countries catching up with rich -
      unconditional convergence - since the 1960s, and divergence over longer periods. This stylized
      fact spurred several developments in growth theory, including AK models, poverty trap mod-
      els, and the concept of convergence conditional on determinants of steady-state income. We
      revisit these findings, using the subsequent 25 years as an out-of-sample test, and document
      a trend towards unconditional convergence since 1990 and convergence since 2000, driven by
      both faster catch-up growth and slower growth of the frontier. During the same period, many
      of the correlates of growth - human capital, policies, institutions, and culture - also converged
      substantially and moved in the direction associated with higher income. Were these changes
      related? Using the omitted variable bias formula, we decompose the gap between unconditional
      and conditional convergence as the product of two cross-sectional slopes. First, correlate-income
      slopes, which remained largely stable since 1990. Second, growth-correlate slopes controlling
      for income - the coefficients of growth regressions - which remained stable for fundamentals
      of the Solow model (investment rate, population growth, and human capital) but which flat-
      tened substantially for other correlates, leading unconditional convergence to converge towards
      conditional convergence.

    JEL Code: E02, E13, O43, O47
    Keywords: Convergence, Institutions, Growth regressions

   ∗
     Kremer: Department of Economics, University of Chicago (e-mail: kremerassistant@uchicago.edu) and NBER.
Jack Willis: Department of Economics, Columbia University (e-mail: jack.willis@columbia.edu.) and NBER. Yang
You: Department of Finance, The University of Hong Kong (e-mail: yangyou@hku.hk). William Goffredo Felice
Labasi-Sammartino, Stephen Nyarko, and especially Malavika Mani provided excellent research assistance. We thank
the two discussants, Daron Acemoglu and Rohini Pande, as well as Robert Barro, Brad DeLong, Steven Durlauf,
Suresh Naidu, Tommaso Porzio, and seminar audiences at the Portuguese Economics Association, NEUDC, HKUST,
the IMF, and Berkeley.

                                                       1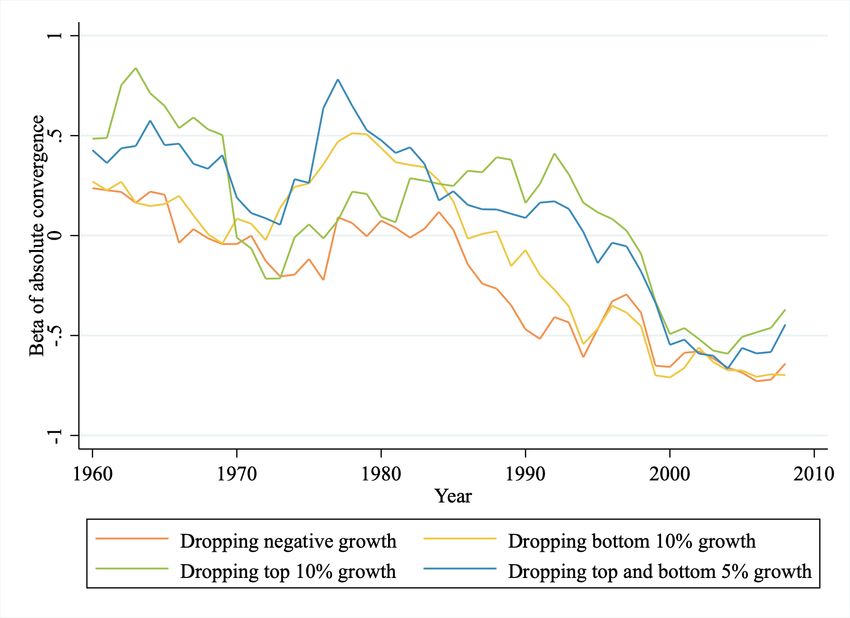
1 Introduction
Studies of convergence in the 1990s found no tendency for poor countries to catch up with rich
ones. If anything, there was divergence: rich countries growing faster than poor. National accounts
data showed weak divergence across a large set of countries since the 1960s (Barro 1991), while
historical data, for a smaller set of countries, showed stronger divergence starting as early as the
16th century, with the ratio of per capita incomes between the richest and the poorest countries
increasing by a factor of five from 1870 to 1990 (Pritchett 1997). The lack of convergence was a
major challenge to models where growth is based on accumulation of capital subject to decreasing
returns or where copying technology is easier than developing new technologies. It led to two
responses: first, a rejection of the neoclassical growth models and the development of poverty
trap models and AK endogenous growth models, some of which predict divergence (Romer 1986);
second, an emphasis on underlying determinants of steady-state income, such as human capital,
policies and institutions, leading to growth regressions and tests of convergence conditional on
them (Barro and Sala-i Martin 1992; Durlauf et al. 2005).
To update the stylized facts of convergence, we revisit these empirical exercises with twenty-
five years of additional data. We consider global trends in income and growth, as well as factors
that might determine them – which we term the correlates of growth - such as human capital,
policies, institutions, and culture. We find substantial changes since the late 1980s, in growth, in
its correlates, and in the cross-country relationship between them. While we do not provide a full
analysis of the reasons, or causal determinants, we think this is still useful, as any understanding
of development should match the cross-country patterns.
We begin with absolute convergence – poor countries growing faster than rich, unconditionally
– and document convergence in income per capita in the last two decades. To study the trend in
convergence, we regress ten-year growth in income per capita on income per capita and consider
the evolution of the relationship since 1960. Doing so shows a steady trend towards convergence
since the late 1980s, leading to absolute convergence since 2000, precisely when empirical tests of
convergence fell out of fashion. In terms of magnitude, from 1985-1995 there was divergence in
income per capita at a rate of 0.5% annually, while from 2005-2015 there was convergence at a rate
of 0.7%.1 While lower than the 2% “iron law of [conditional] convergence” (Barro 2012), this still
represents a substantial change. Looking further back to 1960, when the widespread collection of
national income data began, the trend in convergence was initially flat, with neither convergence
nor divergence, followed by a decade of a trend towards divergence in the late 1970s and early
1980s.
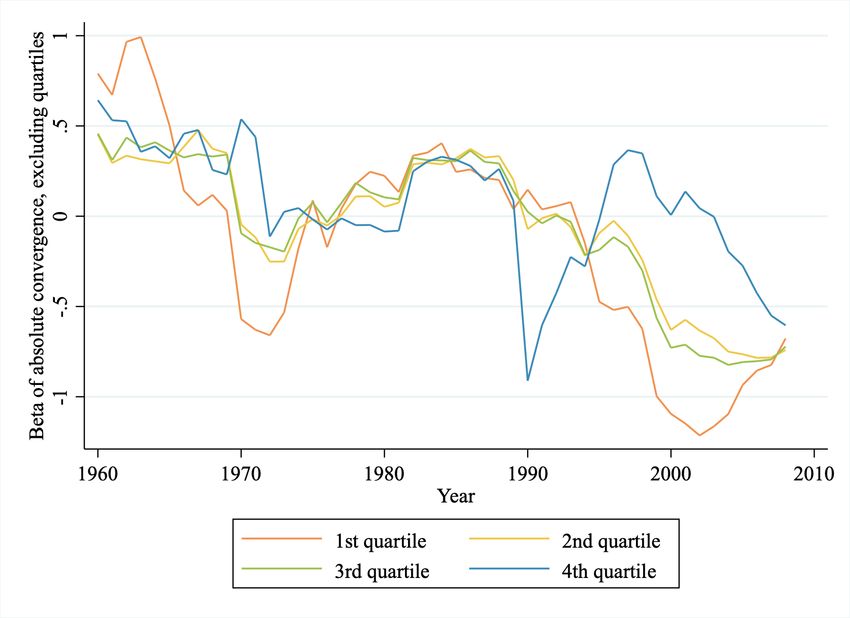
Breaking down the trend towards absolute convergence since 1990, by subsets of countries,
provides a fuller picture of the change. There has been both faster catch-up growth and a slow-
down of the frontier. The richest quartile of countries had the fastest growth in the 1980s but
1
Our base specification uses income per capita adjusted for Purchasing Power Parity, from the Penn World tables
v10.0, but a similar trend is found using income per capita from the World Development Indicators, measured in
constant 2010 USD, and also when using income per worker.
2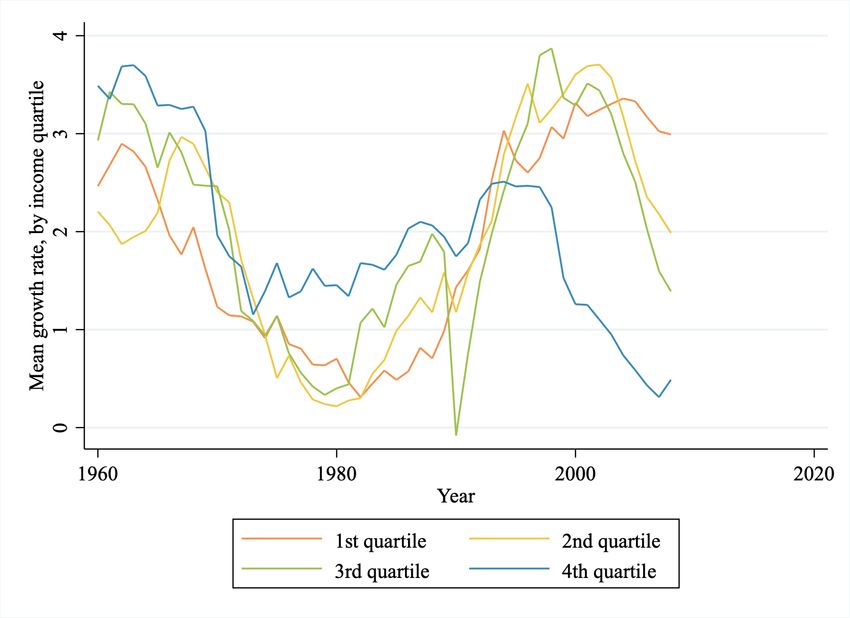
the slowest growth since, being flat in the 1990s and then declining since 2000. In contrast,
the three other quartiles all experienced substantially accelerating growth through the 1990s and
early 2000s, inconsistent with certain poverty trap explanations for the change in convergence, in
which countries catch up once above a certain income threshold. Fewer lower-income countries
have had growth disasters since the mid-1990s – but removing them has little effect on the recent
trend towards convergence; instead, it removes the divergence in the late 1970s and early 1980s.
The trend is also not driven by any one specific region, and convergence becomes stronger upon
removing Sub-Saharan Africa or the bottom quartile of the income distribution from the date set.
   Is convergence in the last twenty years just a blip, or does it represent a turning point in world
history? It certainly could be a blip, as other have argued (Johnson and Papageorgiou 2020), for
example due to high commodity prices. Yet, the trend has lasted for 25 years and is robust to
removing resource rich countries, so we entertain the idea that it represents a turning point and
consider its potential causes.
   Within the framework of conditional convergence, we classify possible causes into two broad
groups. First, those which lead to faster convergence conditional on growth correlates, which could
include faster spread of technologies due to globalization, as well as greater capital and labor mo-
bility. Second, our main focus, convergence in the growth correlates themselves - human capital,
policies, institutions, culture - which may close the gap between unconditional and conditional
convergence. While recent literature on economic growth and institutions emphasizes the stabil-
ity and persistence of such correlates, using their historical determinants to identify their causal
effects on economic outcomes (Acemoglu et al. 2001; Nunn 2008; Dell 2010; Michalopoulos and
Papaioannou 2013), the finding that certain determinants of growth are highly persistent is not
inconsistent with others changing, potentially rapidly, and being subject to global influences on
policies and culture, for example.
   To study whether growth correlates have changed, we classify them into four groups: enhanced
Solow fundamentals – investment rate, population growth rate, and human capital – variables
which are fundamental determinants of steady state income in the enhanced Solow model (Mankiw
et al. 1992); short-run correlates, variables considered by the 1990’s growth literature which may
change in a relatively short time scale, typically policies; long-run correlates, those which change
slowly if at all, and for which we will not have time variation, typically historical determinants
of institutions and geography; and culture. Far from being static, even among highly persistent
correlates we find that many have undergone large changes and themselves converged substantially
across countries, towards those of rich countries.
   For the Solow fundamentals and short-run correlates, we examine 35 variables in six categories:
Solow fundamentals, labor force, political institutions, governance quality, fiscal policy, financial
institutions. To tie our hands over which variables we include, we started from a list of variables
commonly used in growth regressions, from the Handbook of Economic Growth chapter on “Growth
econometrics” (Durlauf et al. 2005). We then constrained ourselves to those variables which were
available for at least 50 countries by 1996, and we chose to focus on the period 1985-2015 as a

                                                 3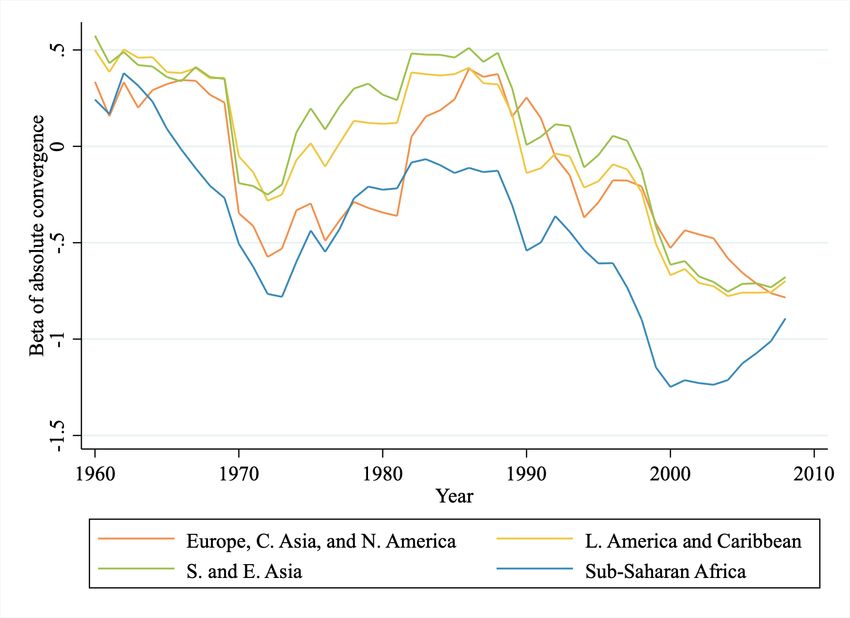
compromise between the number of countries and the number of time periods. Among the 20
variables which are comparable across time, we find significant beta-convergence (a negative slope
of growth regressed on level) in 17. Only credit to the private sector diverged. Moreover, of the
18 variables which were correlated with income in 1985, 15 “improved” on average, meaning they
converged towards those associated with higher income. For a subset of correlates, we are also
able to look further back, and we find similar, albeit slower, trends in 1960-1985.
       Using different rounds of the World Value Survey, we also find evidence of convergence in
culture. While culture does show persistence, eight out of the ten cultural variables we consider
have been converging since 1990. For example, views on inequality, political participation, the
importance of family, traditions, and work ethic have all been converging. While limited, the
results of the exercise are consistent with papers in sociology and psychology studying cultural
convergence (Inglehart and Baker 2000 and Santos et al. (2017)). In contrast, convergence was
unlikely or impossible for long-run correlates, and we do not time variation to test for it.
       Are these two changes since the late 1980s related: the trend towards convergence in income
and the convergence of many of the correlates of growth? We are naturally unable to do a full
causal analysis and causality can run both ways. On the one hand, an extensive empirical liter-
ature argues that such correlates are important for economic development (Glaeser et al. 2004;
Acemoglu et al. 2005), and the convergence literature itself turned towards convergence conditional
on correlates (determinants of the steady state). On the other hand, modernization theory sug-
gests that causation may run the other way, with converging incomes causing policies, institutions,
and culture to converge. While recent literature uses instrumental variables to provide evidence
on both directions of causation (Acemoglu et al. 2001; Michalopoulos and Papaioannou 2013; Dell
2010; Acemoglu et al. 2019, 2008), these studies build on earlier analysis which focused on stylized
facts from empirical cross-country relationships (Barro 1996; Sala-i Martin 1997; Durlauf et al.
2005; Rodrik 2012), facts which any theory of growth should fit and which we revisit and update.2
       To link the trends in growth and its correlates, we develop a simple empirical framework,
revisiting two central cross-country relationships and documenting how they have changed since the
1980s. First, regressing correlates on income; a cross-sectional representation of the modernization
hypothesis. Second, regressing growth on correlates, controlling for income; the basic specification
for both growth regressions and for tests of conditional convergence. By the omitted variable
bias formula, the gap between absolute convergence and conditional convergence is then given by
the product of the slopes of these two relationships (correlate-income slopes and growth-correlate
slopes), allowing us to break down the trend in absolute convergence into trends in these slopes,
together with any trend in conditional convergence. In the main exercise, we do so comparing
1985 to the present, as that is when we have the best data and can run a balanced panel exercise.
In supplementary analysis we also present trends since 1960, which is important as we want to
   2
    Obviously we need to wait another twenty years to perform similar out-of-sample tests of the recent literature.
Maseland (2021), in a related paper, studies long-run trends in the relationships between long-run correlates and
income, using the trends to distinguish different models of growth.

                                                        4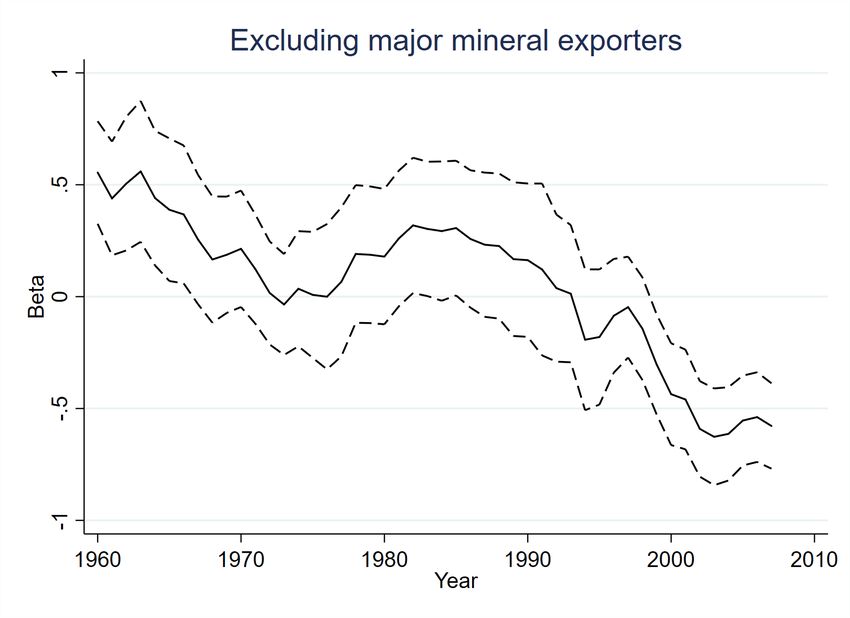
understand why there was a change in income convergence in the late 1980s.
   While the cross-sectional relationships between income and the correlates have changed in
levels, their slopes have mostly remained stable, despite large changes in both income and the
short-run correlates. Among 32 Solow and short-run correlates, regressing the cross-sectional
correlate-GDP slope of 2015 on that of 1985 gives coefficients of 0.90 and 0.89, respectively, and
R-squareds of 0.90 and 0.70. Moreover, while there is substantial prediction error by individual
correlate, on average Solow and short-run correlates themselves have changed as much as would
have been predicted by the changes in income, given the baseline cross-country relationship between
the two.
   In contrast, growth regression coefficients have shrunk substantially across the period and
show relatively little autocorrelation. The coefficients of the Solow fundamentals have remained
the most stable, with a slope of 0.86 and an R-squared of 0.95 when regressing coefficients in
2005 on those in 1985. The coefficients of short-run correlates have shrunk the most, such that
there is almost no correlation in coefficients between the periods (slope 0.18, R-squared 0.06). For
example, in 1985, a one standard deviation higher Freedom House Political Rights score predicted
0.6% higher annual GDP growth for the subsequent decade, yet the predictive power is negligible
in the decade 2005-2015. Long-run correlates and culture fall somewhere between the two, with
coefficients which are somewhat stable across the periods, although on average they also shrank.
   As a result of the flattening of the growth-correlate relationships, absolute convergence con-
verged towards conditional convergence, by the omitted variable bias formula. This helps to explain
the trend towards absolute convergence, but has conditional convergence itself also become faster?
While conditional convergence regressions typically condition on multiple correlates, our baseline
specification conditions on one variable at a time, because of the difficulty in forming a balanced
panel with multiple correlates and to tie our hand in terms of specification search. In our mul-
tivariate analysis, while not our main focus, we find no obvious trend in conditional convergence
itself, which held throughout the period.
   These results suggest an interpretation that is consistent with neoclassical growth models.
Conditional convergence has held throughout the period. Absolute convergence did not hold
initially, but, as human capital, policies, and institutions, have improved in poorer countries, the
difference in institutions across countries has shrunk, and their explanatory power with respect to
growth and convergence has declined. As a result, the world has converged to absolute convergence
because absolute convergence has converged to conditional convergence.
   However, this narrative leaves a key question unanswered: why did the growth regression
coefficients shrink? One interpretation, consistent with a Fukiyama end of history view, is that
policies and institutions used to matter, but now that they have converged, they matter less - their
effects are non-linear. For example, perhaps terrible institutions are bad for growth, but so long
as institutions are not disastrous, they matter much less, and there is convergence. However, our
results could also be viewed as demonstrating the limits of our collective understanding: many of
the policies which were significant in growth regressions in the 1990s no longer significantly predict

                                                  5
growth today, and basic patterns of divergence which held for centuries have not held for the past
20 years. Consistent with this, perhaps earlier growth-regression specifications suffered from an
overfitting problem and are now failing an out-of-sample test using subsequent data? Relatedly,
it is natural to think that there a very large number of factors determine steady state income,
some observable, many unobservable. The correlation between the observable and unobservable
determinants may have shrunk. While these alternatives would also explain the shrinking of the
gap between absolute and conditional convergence, they cannot explain the trend towards absolute
convergence, although that could result from faster conditional convergence. The multitude of
possible interpretations acts as a reminder of the difficulty of projecting the current trends we
document forward, and the dangers of extrapolating from trends over the past quarter century,
especially considering rising authoritarian populism, climate change, and pandemic threats, a
theme we return to in the conclusion.
This paper describes trends in major macro-economic variables and the relationships between
them, some of which have changed substantially in the last twenty years. The goal is descriptive,
not causal. The first literature we contribute to is that regarding convergence, which flowered
in the 1990s. Despite absolute convergence being a central prediction of foundational growth
models, multiple papers found no evidence for absolute convergence in incomes across countries
(Barro 1991; Pritchett 1997), but evidence of convergence within countries and across countries
conditional on similar institutions (Barro and Sala-i Martin 1992). While we identify off cross-
country variation, Caselli et al. (1996) and Acemoglu and Molina (2021) argue that countries
should have fixed effects in convergence regressions, corresponding to their individual steady-
state incomes. The tradeoffs are discussed at length in Durlauf et al. (2005) and we discuss our
specification choice in Section 2. In short, we think that the country fixed effects absorb exactly
the variation relevant for studying convergence. Consistent with this, if we allow country fixed
effects to vary by decade, then they themselves have converged since the 1990s, so that our results
do still appear in that framework, just absorbed into the “nuisance” parameters. More recently
there have been several important additions to the classic convergence findings. Rodrik (2012)
looks specifically at manufacturing and shows that within manufacturing, there has been absolute
convergence. Grier and Grier (2007), a paper closely related to ours, also considers convergence in
both income and in policies and institutions from 1961-1999. They contrast convergence in policies
and institutions with divergence in incomes, arguing that this difference is hard to reconcile with
neoclassical growth models. We agree with their conclusion for the period 1960-1990, but benefit
from twenty years of additional data, and argue that convergence changed around 1990, and is
since consistent with models of neoclassical growth and inconsistent with a class of endogenous
growth theory models which predict divergence, such as AK models (Romer 1986) or some poverty
trap models.
This is not the only paper to revisit the question of convergence with updated data. Roy
et al. (2016), in particular, make the point that there has been absolute convergence in the last 20
years and, in concurrent work to ours, Patel et al. (2021) emphasize how this is in contrast to the
6previous stylized facts about convergence. Johnson and Papageorgiou (2020), in contrast, also uses
the latest data and concludes that there is still no absolute convergence. The difference results in
part from Johnson and Papageorgiou (2020) considering convergence from a fixed base date (1960),
while we consider the trend in convergence over a moving time interval, and in part because we are
willing to speculate that the trend in the last twenty-five years represents a fundamental change.
Indeed, while we find a sustained trend towards convergence, we only find actual convergence for a
relatively short period, whilst historically divergence has been the norm for several hundred years
Pritchett (1997).
The paper also adds to the literature on the effects of culture and institutions. Recent papers
use historical variation to identify the effect of institutions and culture on income, using either
instruments (Acemoglu et al. 2001; Algan and Cahuc 2010) or spatial discontinuities (Dell 2010),
and generally find that both play a central role. That empirical strategy requires focusing on long-
run, persistent components of steady-state determinants, which can easily slide into a pessimistic
view: the things that matter for growth can only change very slowly. However, while some, such
as legal systems and trust, have deep historical roots and may change very slowly (Michalopoulos
and Papaioannou 2013), many change rapidly, and there is no contradiction in culture both having
a long-run effect and being subject to recent change. For example, gender roles have deep and
important historical determinants (Alesina et al. 2013), but they have also changed substantially in
the last 50 years, differentially across countries. While historical determinants continue to persist,
we should also remain open to asking how recent changes in policies and institutions have affected
growth, especially when considering policy changes.
Our growth regressions exercise also provides an out-of-sample test of sorts for the predictive
power of policies and institutions: with a limited sample size and many potential covariates, the
growth regressions literature is vulnerable to overfitting; events since the publication of earlier
papers provides a (limited) out-of-sample dataset (Hastie et al. 2009).
Finally, in studying changes to, and convergence in, policies, institutions, and culture, the paper
adds to expansive literatures in political science, sociology, and psychology whereby the diffusion
and convergence of numerous policies, institutions and cultural traits have been documented and
studied (Dobbin et al. 2007).3 Some of the changes in correlates have been gradual, possibly
consistent with modernization theory (Acemoglu et al. 2008; Inglehart and Baker 2000), and
indeed we do find that on average changes in correlates are consistent with predictions from income
growth, based upon the cross-country relationship. However, many recent changes in policies and
institutions are dramatic, such as global trends in the adoption of VATs, or marriage equality, or the
Me Too movement, which may be better thought of as technology adoption through information
diffusion. This technology diffusion may be passive or may, for example, result from the work
of international organizations, who provide norms and information on perceived best practices
(Clemens and Kremer 2016), and sometimes directly incentivize the adoption of different policies
3
The social science literature on the diffusion of policies has proposed four theories for policy diffusion: social
construction, coercion, competition, or learning. See Dobbin et al. (2007) for a review.
7through conditionality. For example, the “Washington Consensus” encouraged lowers tariffs, lower
inflation, and (word) of state-owned firms, all of which have been broadly adopted since. The end
of the cold war ushered in a period of growth in democracy. In a closely related paper, Easterly
(2019) argues that such “Washington Consensus” reforms may have been better for growth than
previously believed, as growth has been higher recently in countries which adopted them. Finally,
convergence and diffusion of culture are central topics in sociology and psychology. Two recent
examples studying them using the World Value Surveys (among other data sources) as we do, are
Inglehart and Baker (2000) and Santos et al. (2017).
The paper proceeds as follows. In section 2, we present the results on absolute convergence
in income per capita and document a trend towards convergence since the 1990s. In section 3,
we consider global trends in the correlates of growth - policies, institutions, human capital, and
culture - and document considerable convergence across multiple dimensions. In section 4, we
relate the trend towards convergence in income to the convergence in the correlates of growth, first
considering the cross-country relationships between income and correlates (modernization theory),
which have remained stable, then turning to the cross-country relationships between correlates
and growth (growth regressions), which have flattened, and finally turning to the gap between
unconditional and conditional convergence, which has shrunk. Section 5 concludes.
2 Convergence in income
Neoclassical growth models predict convergence towards steady-state income: poor countries
should catch up with rich countries, at least among countries with similar underlying determinants
of steady-state income. Empirical tests in the 1990s of absolute convergence - convergence across
countries without conditioning on determinants of steady state income - found little evidence for
it: if anything, rich countries were growing faster than poor (Barro 1991). We begin by revisiting
these tests of absolute convergence, with 25 additional years of data. We use the same data sources
and focus mainly on β-convergence, defined below.4
2.1 Empirical setup: measuring convergence
The convergence literature in the 1990s used three different datasets. First, standard cross-
country sources such as the World Development Indicators and the Penn World Tables, which
covered a sizeable span of countries from the 1960s onwards. Second, the Maddison dataset, which
collected many sources of data to derive income per capita going back much further in time, for a
smaller set of countries, which showed that divergence had been the norm for several hundred years
(Pritchett 1997. Third, within-country panel datasets, to look at convergence within countries.
For example, Barro and Sala-i Martin (1992) examined convergence within the US.
4
Parallel results for σ-convergence are in Figure 1 Panel (b) and Appendix Figure A.5 Panel (b) with a fixed
country sample
8Our goal is to document what has happened to global cross-country convergence since the
heyday of the literature in the 1990s. As such, we use the standard cross-country data sources,
which cover 1960-present. In the main specification, we use the GDP per capita, adjusted for
Purchasing Power Parity (PPP) from the Penn World Tables v10.0.5 It is an unbalanced panel,
as for many countries GDP per capita data only becomes available part way through the period.
Nevertheless, we use the unbalanced panel for our main specification so as not to drop many of
the poorer countries which become available later in the period (we also show robustness to using
balanced panels, which make little difference to our results). We also drop very small countries and
those which are extremely reliant on natural resource rents, as is common in studies of convergence.
Specifically, we drop countries whose maximum population during the period was < 200, 000, and
those for whom natural resources accounted for at least 75% of GDP (as reported in the World
Development Indicators) at some time during the period. 6
We examine both β-convergence and σ-convergence. β-convergence is when poor countries
grow faster on average than rich, while σ-convergence is when the cross-sectional variance of (log)
income per capita is falling over time. The relationship between the two notions of convergence is
well documented (Barro and Sala-i Martin 1992; Young et al. 2008). We focus on β-convergence
for most of the analysis, with equivalent results for σ-convergence reported in the Appendix.
β-convergence β-convergence is when poorer countries grow faster on average than richer coun-
tries. Specifically, at a given time period t, it is when the country-level regression
log(GDPi,t+∆t ) − log(GDPi,t ) = α + βlog(GDPi,t ) + i,t
has a negative β coefficient, where log(GDPi,t ) is Log GDP of country i at time t. To show how β-
convergence has changed over time, we plot βt vs. t, where βt comes for the following country-year
level regression, clustered at the country level (µt is a year fixed effect on growth):
log(GDP pci,t+∆t ) − log(GDP pci,t ) = βt log(GDP pci,t ) + µt + i,t (1)
Much of the existing empirical convergence literature plots how β varies when holding the
starting point t fixed (often at 1960) and varying the end point, t + ∆t. Since we are interested in
how the process of convergence may itself have changed over time, we instead hold ∆t fixed and
vary t. In the main specification we use 10-year averages, i.e. ∆t = 10.7
5
Specifically, for growth rates we use the variable “rdgpna”, real GDP at constant 2017 national prices (2017
USD), and for growth levels we use “rdgpo”, output-side real GDP at chained PPPs (2017 USD), as recommended
by the PWT user guide.
6
Figure A.1 shows the β-convergence after excluding small population countries and major mineral exporters.
7
The dependent variable is the annualized growth — the geometric average growth rate in the next decade.
92.2 Results: converging to convergence
Figure 1 shows the scatter plot and regression of equation 1 for each decade since 1960. Con-
vergence corresponds to a negative slope, and the shift to convergence since 2000 can clearly be
seen in the raw data. Figure A.2 presents summary boxplots of these basic scatter plots, plotting
the average growth by income quintile for each decade.
Figures 2a and 2b show the β- and σ-convergence coefficients from these regressions over the
whole period 1960-2007. The first striking result is that there has been absolute convergence since
the late 1990s, precisely when the best-known empirical tests of convergence were published. The
point estimate for β-convergence becomes negative in the early 1990s, becoming significant in the
late 1990s and staying significant since. Table 1 shows a point estimate of -0.65 in the 2000s, and -
0.76 in the ten years after 2007, the most recent period we can consider. σ-convergence, represented
by a negative slope in Figure 2, started slightly later, with the standard deviation in GDP per
capita falling since the early 2000s. The difference in timing is consistent with β-convergence being
a function of subsequent 10-year average growth.
The second result is that there has been a trend towards β-convergence - converging to conver-
gence – since 1990. The coefficient started at around 0.5 in 1990 and has trended down towards
-1 today. Looking further back to 1960, initially there is no clear trend, and then there is a
trend towards divergence in the 1980s.8 Table 1, Column (2), reports the results of our basic
absolute convergence regression, Equation 1, with the addition of a linear year variable interacted
with log(GDPi,t ). The interaction terms, representing the “convergence towards convergence”, is
negative and significant, with a point estimate of -0.025. The trend towards convergence is also
apparent in the σ-convergence figure, where it is represented by a gradual decrease in slope, i.e.
concavity of the plot.
This trend towards convergence is consistent with models of growth in which capital is subject
to diminishing marginal returns, or where catch-up growth is easier than growth at the frontier.
It is inconsistent with models of growth which predict long-run divergence, such as AK models, or
some poverty trap models.
2.3 Econometric considerations and robustness to alternative specifications
There is an extensive literature on the tradeoffs of different econometric specifications to test
for convergence, summarized in Durlauf et al. (2005). We follow the most standard approach,
testing for β convergence using OLS with fixed effects for year, clustered at the country level. This
approach is not without limitations, which we discuss below, but it is transparent and captures
the cross-country variation which is our main focus.
We begin by replying to the three main critiques of the specification noted in the comment
of Acemoglu and Molina (2021): unobserved country fixed effects, cross-country heterogeneity in
8
In subsequent robustness exercises, not using PPP adjustments, the trend looks more like a steady trend towards
convergence since 1960, except for a major reversal in the 1980s
10convergence rates, and using 10-year growth rather than annual growth. We then discuss several
additional considerations and robustness questions, such as whether measurement error may drive
towards convergence through mean reversion, whether results are driven by panel imbalance, in
particular the larger number of poor countries entering the panel over time, and whether results
depend on the macroeconomic dataset used.
Specification, country fixed effects, and heterogeneity Our regression specification as-
sumes homogeneous rates of convergence across countries and does not account for potential dif-
ferences in steady state income, as discussed in Acemoglu and Molina (2021). We agree with the
empirical finding of the authors and Caselli et al. (1996): the coefficients on current income change
substantially when incorporating heterogeneity and country fixed effects, with strong convergence
towards countries individual steady state income levels throughout, at a rate of at least 10%.
However, we disagree that their specification is more economically meaningful for the question of
convergence (or, in particular, that the coefficient on income in these specifications can be inter-
preted as causal). It is a different exercise, and one which is not without its own econometric issues
(Durlauf et al. 2005).
We are interested in what has been happening across countries, over time; by definition, country
fixed effects absorb cross-country differences and treat them as nuisance parameters. We agree
that there are likely to be cross-country differences in steady-state income, but we wish to know
how these differences have evolved. A priori, we do not know whether convergence to a fixed
steady state, or evolution of country-level ”steady state” income itself, is likely to be a more
important determinant of growth, so we do not want to assume away the latter. Investigating
the evolution of the country-level steady state is precisely our exercise below, when we turn to
conditional convergence, and to whether the potential determinants of steady-state income have
converged. We view doing so with variation which we can explain – changes in correlates – as
providing additional insights, but we can also do so with a fixed effects approach, which can be
interpreted as another form of conditional convergence. To do so, however, we need to allow for
the possibility that country ”fixed effects” vary over time. Specifically, we modify the framework
of Acemoglu and Molina (2021) to allow country fixed effects to vary by decade:
log(GDPi,t+∆t ) − log(GDPi,t ) = βd log(GDPi,t ) + µt + γi,d + i,t (2)
γi, d being a country-decade fixed effect.
Table A.1 reports the βd estimated with average decade growth in Panel A and annual growth
in Panel B, confirming the results of Acemoglu and Molina (2021). The coefficient stays strongly
negative since 1960. The magnitude is quite stable and does not exhibit any declining pattern over
time. We also find that using annual growth gives stronger convergence and we speculate below
that annual GDP measurement errors might bias upwards a short-term reversal pattern.
In this paragraph in an earlier version of this paper, in analysis undertaken to respond to
Acemoglu and Molina’s discussion at the NBER Annual Conference on Macroeconomics, we in-
11correctly claimed that the fixed effects in this model show little stability over time. Our error
was pointed out in Acemoglu and Molina (2021), their subsequent discussion paper. We thank
the authors for this correction and have updated this paragraph accordingly (and removed the
appendix figure which it referred to). As shown in Acemoglu and Molina (2021) the country fixed
effects in this model are stable over time and have a high F-test statistic. This persistence of the
fixed effects is primarily from the persistence of country income levels; country growth rates show
little autocorrelation from decade to decade.
In this specification, country-decade fixed effects have converged across countries since 1990s,
suggesting that much of the action for studying the global income distribution may be being
absorbed by these fixed effects. Figure A.3 plots standard deviations of fixed effects over time
with a rolling time window of ten years. We see a fall in the standard deviation of the country
fixed effects since 1990, the period in which we see a trend towards unconditional convergence in
our preferred specification. This encourages us to study whether unconditional convergence has
converged towards conditional convergence, the question we turn to below.
Moreover, the country fixed effects approach has its own econometric limitations, discussed
further in Durlauf et al. (2005). The convergence coefficient in the country fixed effects model, βd
in Equation 2, is identified from time-series variation for all years in decade d, while the convergence
coefficient in our main specification, βt in Equation 1, is identified from cross-sectional variation
in year t. Bernard and Durlauf 1996 shows that the two specifications may give very different
answers and argues that the time-series βd is a good estimate of convergence only if the sample
distribution is a good approximation of the true underlying growth process; if historical growth is
not stable, then the time-series model can be substantially biased. Our analysis includes uses a
large set of countries, most of which experienced substantial changes in growth correlates during
the period, potentially perturbing them far away from their steady states.
Averaging period Many of the original convergence studies used a fixed baseline year, consid-
ering how convergence in income per capita changed when varying the endline year. We argue
that to consider trends in convergence itself, rather than use a fixed baseline year, it is better to
consider convergence over a fixed interval of time, and how it changes when varying the baseline
year. This raises a natural question of what the fixed interval of time should be and whether
that interval matters. In the main results, we used a 10-year interval, considering 10 years a good
trade-off between allowing us to see medium-frequency trends, without overloading the trend with
annual noise. Acemoglu and Molina (2021) suggest we should use annual data. We think that
annual data gets at high frequency phenomenon (e.g. weather streaks, business cycles), while ten
year data gets at lower frequency phenomenon, such as long-run growth. Annual data is likely to
introduce substantial noise. If this noise is measurement error in GDP, then growth regressions
will be biased towards convergence and this bias will be larger over shorter periods, via mean re-
version. Figure A.4 shows how the convergence coefficient varies when using 1-, 2-, 5- and 10-year
averages. 10-year averages show the clearest trend towards convergence. Once we get to 1-year
12averages, the year-to-year variation dominates, and the trend which is apparent in 5- and 10- year
averages is much less apparent.
Balanced panel Since the number of countries in the dataset is growing over time, our results
could reflect the inclusion of the new countries over time, rather than global trends. To investigate
this, we show, by decade, what convergence looks like from that decade until present day, among
the balanced panel of countries whose data is available from the start of that decade. So, for
example, for the 1970s, we plot the 10-year average convergence coefficient, from 1970 to present,
for the set of countries who are in the dataset since 1970.
Figure A.5 displays the results of these investigations which hold the set of countries fixed over
time. It shows that the change in convergence has little to do with the expansion of the set of
countries over the time period - results are remarkably robust to different balanced panels, showing
that the original results do indeed reflect a trend towards convergence since 1990.
While the trend towards convergence began around the time of the dissolution of the Soviet
Union, the repercussions of which may have been an important driver of the change in convergence,
the robustness of the trend to countries which existed before 1990 shows that the change was not
mechanical from the addition of the former Soviet countries.
Measure of income Figure A.6 shows that our finding of a trend towards convergence is not
specific to looking at income per capita (as opposed to per worker), nor to using income per capita
in Purchasing Power Parity (PPP) adjusted terms from the Penn World Tables v10.0. Namely, we
find a broadly similar pattern using income per worker instead of income per capita, using different
measures of income from the PWT, and using the World Development Indicators data with income
measured in constant 2010 US dollars. Indeed, in the later, the trend is more apparent, and seems
to start from 1960, again with a decade of regression in the 1980s.
2.4 Which countries have driven the change?
To provide more details on the trend to absolute convergence, and to take a first step towards
understanding its causes, we consider which countries have driven the change. We do so mainly
by showing how the trend in convergence changes when removing different groups of countries.
Faster catch-up growth and a slow-down of the frontier Two very different and popular
narratives could each lead to the observed trend to convergence: stagnation of the frontier – a
drop in the growth rate of richer countries; or faster catch-up growth – a rise in the growth rate
of poorer countries.
Figure 3 shows average 10-year growth rate by income quartile, where income quartile is re-
calculated each year. The richest quartile of countries had the highest growth rate of all quartiles
in the 1980s and then switched position entirely to have the lowest growth rate since 2000. The
shift was driven both by a slow-down of growth at the frontier - the richest quartile of countries
experienced flat growth in the 1990s and then a growth slowdown since 2000 – and faster catch-up
13growth - the other three quartiles experienced a substantial acceleration in growth in the 1990s.
Removing one quartile at a time from our standard test for convergence, Figure A.7, it does appear
that in the last decade the trend towards convergence is driven by the richest quartile versus the
other quartiles, and that the poorest quartile has if anything been a drag on the trend towards
convergence within the other quartiles.
Fewer growth disasters and more growth miracles Figure A.8 presents the trend in coef-
ficients from Equation 1 when excluding countries which experienced disasters or growth miracles.
The trend towards convergence remains robust, whether we drop episodes of especially low or
episodes of especially high growth. Interestingly, the reversion in the 1980s disappears when ex-
cluding countries which had a negative 10-year growth rate.
Which regions are driving the change? Figure A.9 presents the trend in coefficients from
Equation 1 when excluding countries from different regions. Again the trend remains robust,
although the trend towards convergence in the last twenty years becomes stronger upon excluding
Sub-Saharan Africa.
2.5 Club convergence
Convergence has been documented among OECD countries (or rich countries) as a group of
relatively homogeneous countries (Barro and Sala-i Martin 1992), as evidence for club convergence
– convergence among groups of countries which have similar institutions and culture. We revisit
this result and show convergence among the rich countries has slowed and shifted towards the
general global convergence pattern.
Figure A.10 plots the convergence coefficients in the country sub-sample with income above
the Xth percentile.9 Three decades from 1965 to 1995 yield a similar pattern - strong convergence
among high-income countries (above the 60 percentile) while overall there was little absolute
convergence. This pattern has changed in the period from 1995 to 2005, and in the most recent
decade, convergence holds across a sample containing all countries, while convergence among the
top 40% of countries by income has stopped.
These results, together with the above finding that growth has increased across the bottom three
quartiles, are inconsistent with certain poverty trap explanations for the trend towards absolute
income convergence. Namely, we see no evidence of there being an income threshold above which
there is convergence, with more countries crossing the threshold over time.
3 Convergence in correlates of income and growth
We next consider global trends in factors that might be determinants of growth - policies,
institutions, human capital, and culture - using the same empirical approach as above. While
9
X = 0 corresponds to absolute convergence. X stops by 80, corresponding to the top 20% high-income countries.
The sample size would be too small to obtain stable β if X rises above 80.
14much recent literature emphasizes the persistence of institutions over time (Acemoglu et al. 2001;
Michalopoulos and Papaioannou 2013; Dell 2010), we find substantial change and convergence.
Overall, 17 out of the 32 Solow fundamentals and short-run correlates for which we have temporal
variation exhibit β-convergence from 1985 to 2015, and the correlates have generally converged in
the direction of those of more advanced economies, towards what we term development-favored
institutions. Moreover, culture has also convergence, with 8 out of 10 measures of culture we
consider displaying β-convergence in the World Value Surveys data.
3.1 Policies, institutions, measures of human capital, and cultural traits con-
sidered
We divide such potential correlates of income and growth into four groups: enhanced Solow
fundamentals – investment rate, population growth rate, and human capital – variables which are
fundamental determinants of steady state income in the enhanced Solow model (Mankiw et al.
1992); short-run correlates, other policy and institution variables considered by the 1990’s growth
literature which may vary at relatively high frequency; long-run correlates, institutions and their
historical determinants which do not change or which only change slowly, which have been the
focus of the recent institutions literature, and geographic correlates of growth; and culture.
To tie our hands, we started from a list of variables commonly used in growth regressions,
from the Handbook of Economic Growth chapter on “Growth econometrics” (Durlauf et al. 2005),
constraining ourselves to those variables which covered at least 40 countries from 1996. We then
added to this list numerous cultural variables and historical determinants of institutions which
have played a central role in the empirical growth literature since Durlauf et al. (2005). While we
obviously cannot consider convergence for historical or geographic variables – they are however
included in the empirical exercises in the next section – we are able to study convergence of mul-
tiple cultural variables, albeit with a smaller country sample than for the policy and institutional
variables.
Table 2 summarizes the data sources and sample period of the resulting correlates. There are 5
enhanced Solow fundamentals and 27 short-run correlates divided into four broad categories: po-
litical institutions, governance, fiscal policy, financial institutions. Not all the short-term correlates
are comparable over time, for example the World Governance Indicators and Heritage Freedom
Scores are standardized each year. We obviously cannot study convergence nor average changes
for such variables, but we include them in the table as we do use them for our analysis of the
gap between unconditional and conditional convergence, in Section 4 of the paper. For certain
figures in the paper, we pick one representative variable from each category, displayed in bold in
the table: Polity 2 score, the WGI rule of law, government spending (% GDP), credit provided
by the financial sector (% GDP). Equivalent figures with the other variables can be found in the
Appendix.
To help interpret the direction of change of correlates, Table 3 Column (3) shows which cor-
15relates were ”development-favored” in 1985 (or the earliest available year), defined by their cor-
relation with log GDP in 1985. Correlates are defined as high (or low) development-favored if
the coefficient from regressing the correlate on log GDP is positive (or negative), with statistical
significance at a 10% level. A high-income country tends to have a higher Polity 2 score, higher
rule of law score, higher government spending (as a % of GDP), more financial credit, and higher
education attainment. Five correlates cannot be signed: taxes on goods and services, tax burden
score, military expenditure, inflation, and central bank independence.
We first supplement Solow fundamentals with two measures about the labor force: gender
inequality in education (male minus female in educational attainment) and labor force participa-
tion rate. High-income countries enjoy more gender equality in education and lower labor force
participation.
Then, we use five variables to measure political institutions: the Polity 2 score from the Center
of Systematic Peace (1960-2018), the Freedom House political rights score (1973-2018), the Free-
dom House civil liberty score (1973-2015), the Press Freedom score (1979-2018),10 and the political
stability score (1996-2018) from Worldwide Governance Indicators (WGI).
Governance variables - distinct from political institutions - measure whether the public system
functions well. We use four variables (1996-2018) from the WGI Project: government effectiveness,
regulatory quality, the rule of law, control of corruption; and five variables (1995-2019) from
the Index of Economic Freedom by the Heritage Foundation: Overall economic freedom index,
government integrity, business freedom, investment freedom, and property rights. The sample size
of countries in the Economic Freedom database rises from 97 in 1995 to 145 in 2005, and then
159 in 2015. Variables under the governance and political institutions categories are all positively
correlated with economic development.
The fiscal policy category mainly captures the following three dimensions: taxation, tariffs, and
government interventions / expenditures. Taxation measurements include taxes on income and
capital gains (percentage of total tax revenue), taxes on goods and services (percentage of total tax
revenue), and a tax burden score. Equal-weighted and value-weighted tariffs are measures of the
policy-induced barriers to trade. A state with strong government interventions and expenditures
tends to have a lower private investment (% total investment), more government spending (%
spending), and higher military expenditure. In general, high-income countries are more likely to
adopt free trade and low government intervention, but there is not clear pattern in our data on
taxation.
The financial institutions category includes six variables: a central bank independence index
constructed by Garriga 2016; inflation, credit to the private sector (% GDP), and credit provided
by the financial sector (% GDP), all from the WDI; and financial freedom and investment freedom
scores from the Index of Economic Freedom. Higher financial development is positively associated
with economic development, while central bank independence (CBI) and inflation are ambiguous
10
The press freedom score ranges from 0 to 100. A high score represents less press freedom in the original data.
We transform the data as 100 minus the original data so that high score translates into more press freedom
16according to our approach. The high inflation of 1990 was not constrained to developing countries,
but a global issue. Central bank independence adoption rose over time and inflation was brought
under control (Rogoff 1985; Alesina and Gatti 1995; Fischer 1995; Alesina and Summers 1993;
Grilli et al. 1991; Alesina 1988).
The following sections examine average changes in correlates from 1985 to 2015 as well as their
rate of convergence, βInst , estimated from the following equation:11
∆1985−→2015 Insti = βInst Insti,1985 + α + i
The country sample is time-varying (mostly increasing) as datasets add new countries into the
sample. In the Appendix, we also plot the standard deviations of the correlate metrics as the
σ-convergence for correlates (Figures A.11 - A.13).
Before presenting results for individual correlates, we test the convergence of all of our short-
run correlates jointly in table A.2, which presents the joint significance of each category using
seemingly unrelated regressions. All variables are available since 1996. Thus we report results for
1996-2006 in Panel A and 2006-2016 in Panel B. For both decades, we confidently the hypothesis
that convergence in correlates does not exist.
3.2 Enhanced Solow fundamentals
Human capital Human capital is a robust predictor of income growth, as emphasized in the
seminal literature Lucas Jr (1988), Barro (1991), Mankiw et al. (1992), Sala-I-Martin (1997), Barro
and Lee (1994).12 Education augments labor productivity (Lucas Jr (1988)), facilitates techno-
logical progress (Romer (1990)), and can help promote structural transformation into industry
(Squicciarini and Voigtländer (2015)).13
We measure time-varying human capital with the Barro-Lee average schooling years of popula-
tion, age 20-60. Figure A.14 Panel C reports the β-convergence. The convergence in human capital
starts from 1975. Since 1975, poor countries start to gain faster growth in educational attainment
and gradually catch up with rich countries. In addition, education levels in some well-educated
populations have stagnated, and the data implies that 13 average years of education appears to be
a soft cap for many countries.14 We also observe a meaningful shrinking in education attainment
inequality across gender. The education gender gap reduced by 8.1% per decade on average.
11
If data were not available in 1985, we use the earliest available year for the analysis. For example, the rule of law
score from WGI start in 1996. Table 3 Column (4) reports the 1996 average and the baseline year for the correlate
convergence βInst in Column (7) is 1996 as well.
12
While human capital is not something which can be directly manipulated by policy, many policies can signif-
icantly influence educational attainment, such as budgetary decisions, school-building campaigns, curriculum, and
minimum school leaving age.
13
See Krueger and Lindahl (2001) for extensive reviews on micro and macro empirical evidence on schooling and
growth.
14
In 2010, only nine countries - Switzerland, Denmark, United Kingdom, Iceland, Japan, South Korea, Poland,
Singapore, United States - have population with more than 13 years of education. South Korea and Singapore are
the only two nations pushed the number above 14.
17Investment Investment is development-favored, according to our definition, and we observe
a moderate growth from 22.07% in 1985 to 24.18% in 2015, which translates to 0.23 standard
deviations in 1985. Figure A.14 Panel B indicates that convergence in investment has been stable
(around -6) since 1985. Figure 4 Panel B exhibits strong mean-reversion, with one percent higher
investment in 1985 corresponds to a negative growth of 2.98% per decade. With most countries
slowly decreasing their investment, certain developing countries like Mozambique, Ethiopia, and
Angola, increased investment.
Population growth Developed economies feature lower population growth. Population growth
slow down from 1.99% in 1985 to 1.42% in 2015, translating to -0.43 standard deviations in 1985.
Figure A.14 Panel A reports the beta convergence which fluctuates between -4 and -2 before 2000,
after which we witness a sharp decline towards -6. After 2000, population growth has fallen for
poor countries, while it has stagnated for most of the rich countries. Figure 4 Panel A reports that
most countries in our sample witnessed a decrease in population growth from 1985 to 2010.
3.3 Short-run correlates
Labor Force Education attainment became more gender-balanced from 1985 to 2015. Male
education was 0.97 years more than women in 1985, and the number reduces to only a 0.33-
year advantage. Not surprisingly, countries with larger gender differences experienced more gap
reduction. The labor force participation rates remain stable around 62.5% in the recent three
decades, but β-convergence also holds — one percent higher labor participation rate correlates
with a 0.66 percent reduction in 1985-2015.
Political Institutions Political institutions exhibit pervasive β-convergence and σ-convergence,
with particularly strong convergence in the 1990s. We use the polity 2 score form the Polity IV
project as our primary democracy measure, which ranges from -10 to 10. -10 represents dictatorship
and 10 represents perfect democracy. Figure A.15 shows that the average polity 2 score hits its
low point in 1978, at below -2, then the score gradually climbed back to zero in 1990. Then, the
average democracy score jumped up to 2 after the dissolution of the Soviet Union, and persistently
improved to above 4 in the next 25 years.
Figure A.11 shows the plot of coefficients for β-convergence in political institutions. Polity 2
score, political rights, and civil liberty yield similar results, including in the rate of convergence.
The long-run average of coefficients is around -0.2. The deep institutional reforms in the 1990s
lead the coefficients to drop below -0.3 in that decade and then gradually move back the historical
average of -0.2. The institutional convergence is statistically significant in any single year’s cross-
sectional regression. β-convergence in media freedom and political stability also holds since 1995
and the convergence pattern is very stable in the recent two decades.
Panel B reports the standard derivation of the four political institutions.15 The σ-convergence
15
WGI political stability scores are re-scaled year by year. Thus, β and σ convergences are not well-redefined.
18You can also read