Coronavirus (COVID-19): Analysis
←
→
Page content transcription
If your browser does not render page correctly, please read the page content below
Coronavirus (COVID-19): Analysis

    Coronavirus (COVID-19): modelling the epidemic in Scotland
    (Issue No. 89)

    Background

    This is a report on the Scottish Government modelling of the spread and
    level of Covid-19 in Scotland. This updates the previous publication on
    modelling of Covid-19 in Scotland published on 3rd February 2022. The
    estimates in this document help the Scottish Government, the health
    service and the wider public sector plan and put into place what is
    needed to keep us safe and treat people who have the virus.

    This edition of the research findings focuses on the epidemic as a whole,
    looking at estimates of R, growth rate and incidence as well as local
    measures of change in the epidemic.

    Key Points

    • The reproduction rate R in Scotland is currently estimated as being
      between 0.8 and 1.0, as of 25th January 2022. The lower and upper
      limits have increased since last week.
    • The daily growth rate for Scotland is currently estimated as between
      -5 and -1% as at 25th January. The lower limit has increased since
      last week.
    • The number of new daily infections for Scotland is estimated as being
      between 168 and 292 as at 25th January, per 100,000 people.
    • Average contacts from the most recent Panel B cohort of the Scottish
      Contact Survey (week ending 2nd February) indicate an average of
      5.1 contacts. Last week’s average contacts of 4.7 contacts was based
      on Panel A, for the week ending 26th January.
    • Mean contacts have increased within the work setting by 43%.
      Contacts within the home and other setting (contacts outside home,
      school and work) have remained at a similar level over the same
      period.
    • The youngest (18-29) and oldest age groups (60+) have reported an
      increase in contacts in the last two weeks. Increases were largely

                                                                            1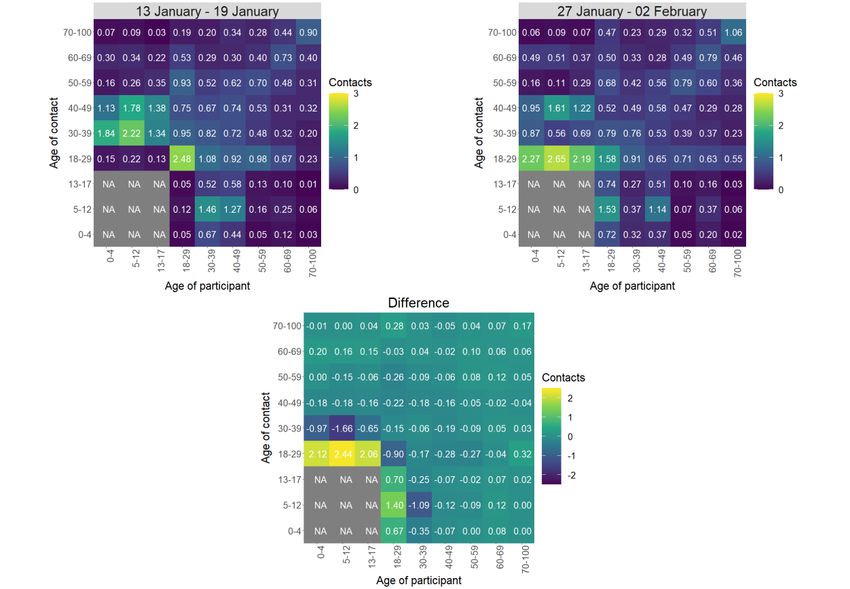
driven by contacts within the work setting for those in the youngest
    age group, with individuals 60 and over reporting a rise in contacts
    within the other setting. All remaining age groups reported a decrease
    in contacts.
•   The biggest increase in interactions between age groups is between
    those aged 18-29 with individuals under 18.
•   Visits to a pub or restaurant have shown the biggest increase,
    increasing from approximately 32% to 40% while visits to a health
    facility have shown the biggest decrease, decreasing from 21% to
    19% in the last two weeks.
•   The number of people wearing a face covering where they have at
    least one contact outside of the home has increased in the last two
    weeks from 81% to 83%.
•   Approximately 74% of individuals had taken at least one lateral flow
    test within the last 7 days for the survey pertaining to the 27th
    January - 2nd February, decreasing from 76% two weeks prior. Of
    those individuals who had taken a lateral flow within the last 7 days,
    33% did not report their results.
•   The future trajectory of infections, hospitalisations, hospital
    occupancy and deaths is highly uncertain; some Delta infections may
    also continue. We estimate that daily infections may be between
    2,000 and 37,000 in early March. This includes the impact of the
    interventions announced on 14th and 21st December; those
    announced as being lifted from 17th, 24th and 31st January; and
    booster take up.
•   Modelled rates of positive tests per 100K using data to 7th February
    indicate that, for the week commencing 20th February 2022, 28 local
    authorities are expected to exceed 100 cases per 100K, with at least
    75% probability. The exceptions are South Ayrshire, Na h-Eileanan
    Siar, Orkney Islands and Shetland Islands.
•   Four local authorities are expected to exceed 300 cases per 100K,
    with at least 75% probability. These are Aberdeen, Edinburgh,
    Dundee and Midlothian. Only one local authority, Dundee, is
    expected to exceed 500 cases per 100K, with at least 75%
    probability.
•   Analysis by the Edinburgh University Roslin Institute indicates that
    there remains a substantial variation in risk of infection by age.
    Deprivation in the period analysed is not a substantial factor.
    Whereas the distribution of lateral flow/LFD tests being reported
    varies substantially by both age and deprivation status, with many
    fewer tests reported in younger adults across all deciles of
    deprivation, and for children in more deprived deciles. The high level

                                                                         2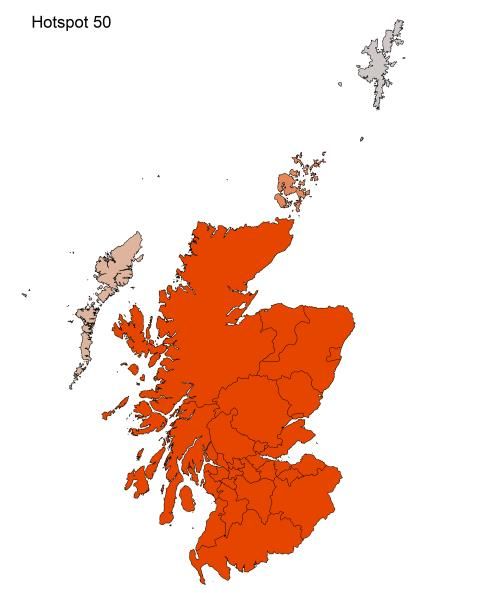
of LFD positivity in the latter category is marked, and when compared
  to the high number of positives amongst the least deprived, suggests
  this may reflect under ascertainment.
• The R value remains low for both S-gene positive and negative
  cases, though there has been a marked increase in R for S-gene
  positives in the past week, possibly reflecting increased spread of the
  BA.2 variant. This estimate of R for the last few days of the analysis
  should be viewed with caution, due to the effect of uncertain impact of
  partially observed infections caused for the most recent cases.
• Nationwide, wastewater (WW) Covid-19 levels remained at their
  previous levels, with the week ending on 7th February recording
  levels of 52 million gene copies per person per day (Mgc/p/d),
  essentially the same as 53 Mgc/p/d the previous week (ending 31st
  January). There is some slight variability between locations, but it is
  not yet clear if this forms any systematic pattern.
• Modelling of long Covid estimates that on 27th February 2022
  between 1.1% and 2.9% of the population are projected to self-
  classify with long Covid for 12 weeks or more after their first
  confirmed (or suspected) Covid infection in Scotland. The limits of the
  projection of the proportion of the population with long Covid are
  lower than last week.

                                                                        3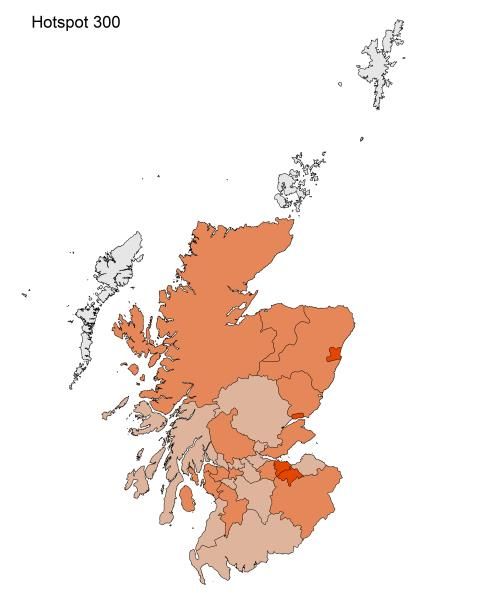
Recent cases

Figure 1 shows the number of Covid-19 cases (from either PCR or LFD1)
in Scotland over January 2022. The vertical dashed lines indicate the cut
off points for each of the modelling inputs; after these dates, the number
of cases is not incorporated into the outputs.

Figure 1: PCR and LFD positive daily and weekly case numbers by
reporting date2

R, growth rate and incidence are as of 25th January 2022 (dashed line
1). The Scottish Contact Survey uses data to 2nd February 2022 (dashed
line 2). The Scottish Government modelling of infections, the long Covid
analysis and the modelled rates of positive tests per 100K use data to
7th February (dashed line 3). The wastewater analysis uses data to 8th
February 2022 (dashed line 4).

Overview of Scottish Government Modelling

Modelling outputs are provided here on the current epidemic in Scotland
as a whole, based on a range of methods. Because it takes a little over
three weeks on average for a person who catches Covid-19 to show

1
 These figures are produced by Public Health Scotland as “experimental statistics” and may be
subject to future revision as the new method for counting combined PCR and LFD tests evolves.
2
    https://www.gov.scot/publications/coronavirus-covid-19-daily-data-for-scotland/

                                                                                                4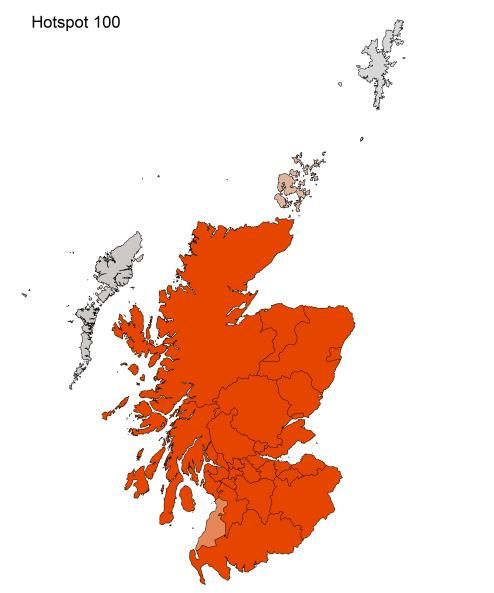
symptoms, become sick, and either die or recover, there is a time lag in
what our model can tell us about any change in the epidemic.

This week the Scottish Government presented one output to EMRG.
This used modelled infection figures provided by the Covid Infection
Survey. This output is included in Figures 2 and 3.

The R value and growth rates are estimated by several independent
modelling groups based in universities and the UKHSA. Estimates are
considered, discussed and combined at the Epidemiology Modelling
Review Group (EMRG), which sits within the UKHSA. These are based
on data to 7th February.

UKHSA’s consensus view across these methods was that the value of
R in Scotland3 is between 0.8 and 1.0, as of 25th January 20224
(Figure 2). R is an indicator that lags by two to three weeks.

Figure 2. Estimates of Rt for Scotland, as of 25th January, including 90%
confidence intervals, produced by EMRG5.
      1.6

      1.4

      1.2

      1.0

    R 0.8

      0.6

      0.4

      0.2

      0.0

Source: EMRG

3
  Using data to 7th February.
4
  Particular care should be taken when interpreting this estimate as it is based on low numbers of
cases, hospitalisations, or deaths and / or dominated by clustered outbreaks. It should not be treated
as robust enough to inform policy decisions alone.
5
  The cyan bars use Covid-19 test data and purple bars use multiple sources of data. The estimate
produced by the Scottish Government is on the left (yellow). The UKHSA consensus range is the
right-most (red). Data to 7th February 2022. R, incidence and growth rate as of 25th January.

                                                                                                     5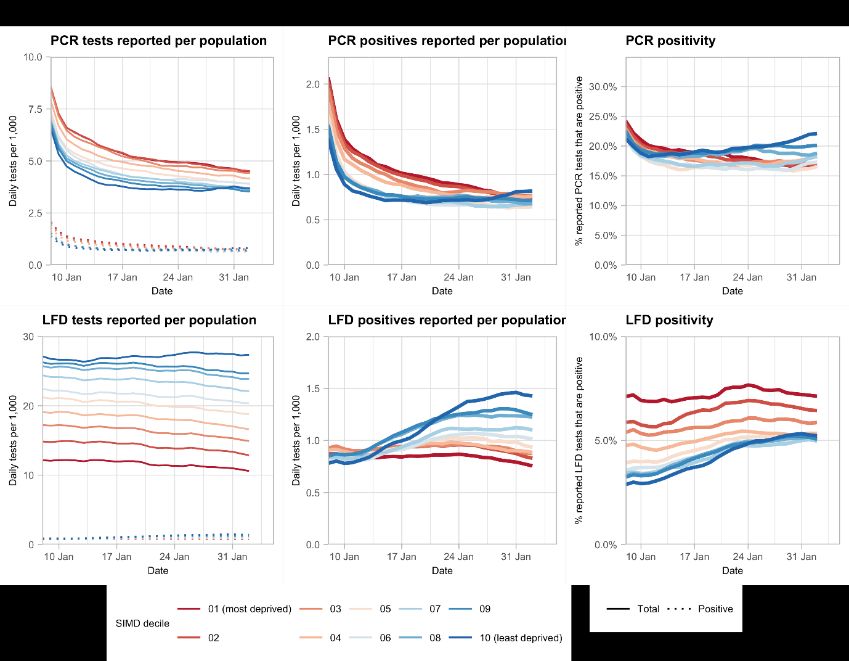
The various groups which report to the EMRG use different sources of
data in their models to produce estimates of incidence (Figure 3).
UKHSA’s consensus view across these methods, as at 25th January,
was that the incidence of new daily infections in Scotland was between
168 and 292 new infections per 100,000. This equates to between 9,200
and 16,000 people becoming infected each day in Scotland.

Figure 3. Estimates of incidence for Scotland, as at 25th January,
including 90% confidence intervals, produced by EMRG.

Source: EMRG

The consensus from UKHSA for this week is that the growth rate in
Scotland is between -5% and -1% per day as at 25th January. The
upper limit has increased since last week.

What we know about how people’s contact patterns have changed

Average contacts from the most recent Panel B cohort of the Scottish
Contact Survey (week ending 2nd February) indicate an average of 5.1
contacts. This has remained at a similar level compared to the previous
Panel B of the survey (week ending 19th January), as seen in Figure 4.
Mean contacts have increased within the work setting by 43%. Contacts
within the home and other setting (contacts outside home, school and
work) have remained at a similar level over the same period.

                                                                          6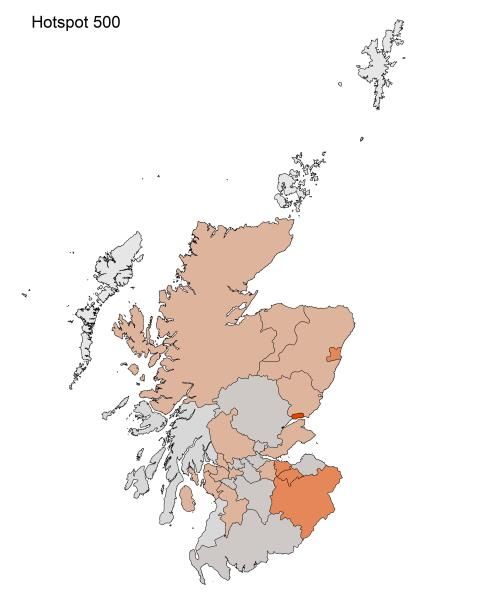
Figure 4: Mean Adult Contacts (truncated at 100) from SCS.

Figure 5 shows how contacts change across age group and setting. The
youngest (18-29) and oldest age groups (60+) have reported an
increase in contacts in the last two weeks. Increases were largely driven
by contacts within the work setting for those in the youngest age group,
with individuals 60 and over reporting a rise in contacts within the other
setting. All remaining age groups reported a decrease in contacts.

Figure 5: Average (mean) contacts for each panel per day by setting for
adults in Scotland, truncated to 100 contacts per participant (from SCS).

                                                                         7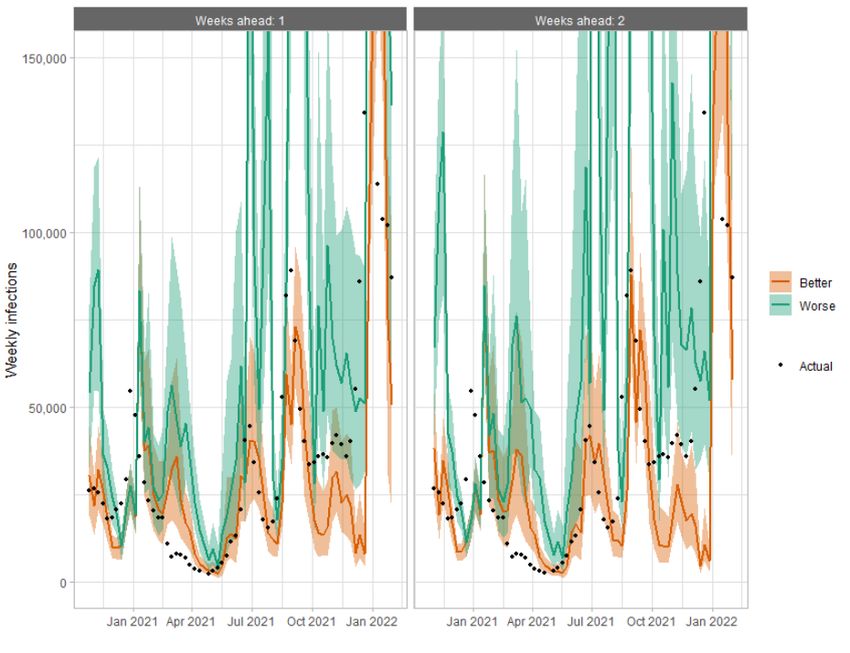
The heatmaps in Figure 6 show the mean overall contacts between age
groups for the weeks relating to 13th January - 19th January and 27th
January - 2nd February and the difference between these periods. The
biggest increase in interactions between age groups is between those
aged 18-29 with individuals under 18.

Figure 6: Overall mean contacts by age group for the weeks relating to
13th January - 19th January and 27th January - 2nd February.

The biggest changes in the proportion of participants visiting different
locations is seen in those visiting a pub or restaurant and individuals
visiting a healthcare facility. Visits to a pub or restaurant have shown the
biggest increase, increasing from approximately 32% to 40% while visits
to a health facility have shown the biggest decrease, decreasing from
21% to 19% in the last two weeks as shown in Figure 7.

                                                                           8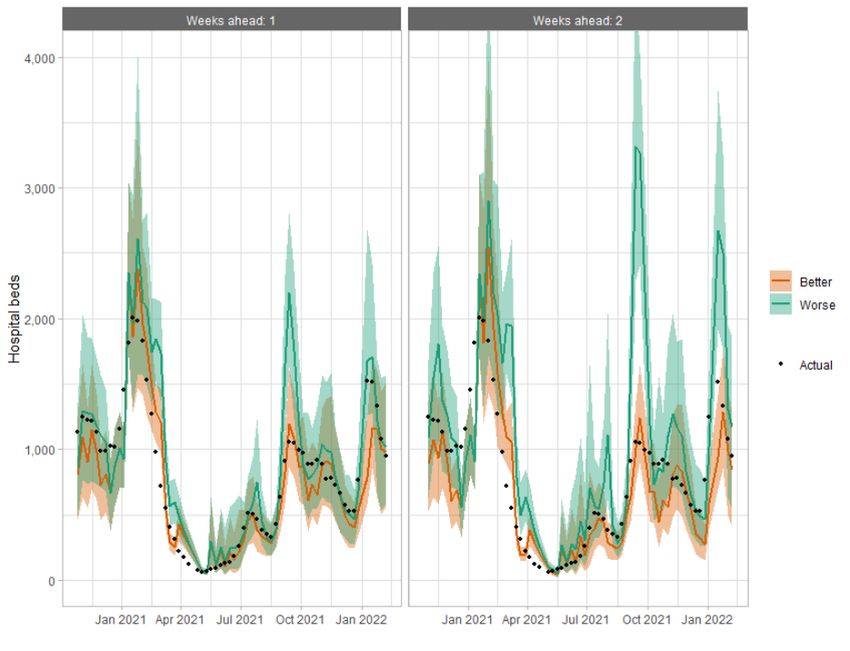
Figure 7: Locations visited by participants at least once for panel A and
B (from SCS).

Figure 8 shows the number of people wearing a face covering where
they have at least one contact outside of the home. This has increased
in the last two weeks from 81% to 83%.

Figure 8: Proportion of adults wearing a face covering over time (with at
least one contact outside of the home).

Approximately 74% of individuals had taken at least one lateral flow test
within the last 7 days for the survey pertaining to the 27th January - 2nd
February, decreasing from 76% two weeks prior as shown in Figure 9.

                                                                             9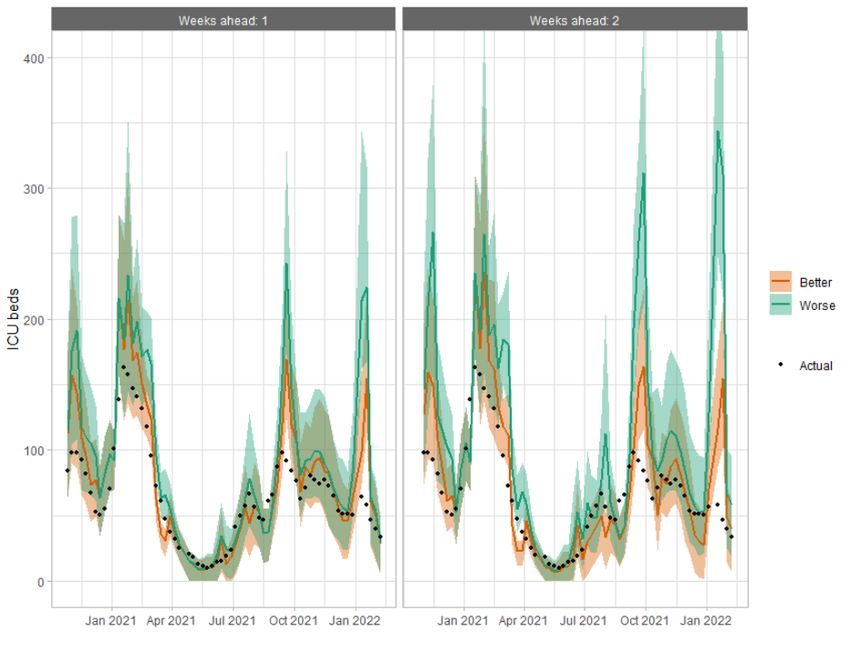
Figure 9: Number of days participants taken a lateral flow in last 7 days.

Of those individuals who had taken a lateral flow within the last 7 days,
33% did not report their results as shown in Figure 10.

Figure 10: Reporting rates of respondents, who have taken at least one
lateral flow test within the last 7 days

                                                                            10
What the modelling tells us about estimated infections
The Scottish Government assesses the impact of Covid-19 on the NHS
in the next few weeks. Figures 11 - 13 show projections over four weeks
for combined Delta and Omicron infections.
These projections include the effect of the interventions announced on
14th and 21st December 2021; those announced as being lifted from
17th, 24th and 31st January 2022; and booster take up. ‘Central’
assumes that infections broadly plateau at current levels. ‘Worse’
assumes a higher transmissibility for Covid-19 whereas ‘Better’ assumes
a lower transmissibility. All projections also assume a lower vaccine
effectiveness for Omicron than for Delta6.
The future trajectory of infections is uncertain.
Following the announcement removing the need for a confirmatory PCR
test in some cases we have used combined PCR and LFD reported date
data from 6th January.
6
All projections are based on current vaccine roll-out plans and efficacy assumptions. Data to 7th
February 2022.
11Figure 11. Medium term projections of modelled total new combined
daily infections in Scotland, adjusting positive tests7 to account for
asymptomatic and undetected infections, from Scottish Government
modelling, based on positive test data reported up to 7th February 2022.
We estimate that daily infections may be between 2,000 and 37,000 in
early March.
Figure 12 shows the impact of the projections on the number of people
in hospital. The modelling includes all hospital stays, whereas the
actuals only include stays up to 28 days duration that are linked to
Covid-19.
There continues to be uncertainty over hospital occupancy and intensive
care in the next four weeks.
7
The actual positive tests are adjusted to coincide with the estimated day of infection.
12Figure 12. Medium term projections of modelled hospital bed demand,
from Scottish Government modelling, based on positive test data
reported up to 7th February.
Figure 13 shows the impact of the projection on ICU bed demand.
Figure 13. Medium term projections of modelled ICU bed demand, from
Scottish Government modelling8, based on positive test data reported up
to 7th February.
8
Actual data does not include full numbers of CPAP. ICU bed actuals include all ICU patients being
treated for Covid-19 including those over 28 days.
13What the modelling tells us about projections of hospitalisations,
occupancy and deaths in the medium term
SPI-M-O produces projections of the epidemic (Figures 14 - 16),
combining estimates from several independent models. These
projections are not forecasts or predictions. They represent a scenario in
which the trajectory of the epidemic continues to follow the trends that
were seen in the data available to 7th February and do not include the
effects of any future policy or behavioural changes.
The delay between infection, developing symptoms, the need for
hospital care, and death means they cannot fully reflect the impact of
behaviour changes in the two to three weeks prior to 7th February.
The projections include the potential impact of vaccinations over the next
few weeks. Modelling groups have used their expert judgement and
evidence from UKHSA, Scottish Universities & Public Health Scotland,
and other published efficacy studies when making assumptions about
vaccine effectiveness.
Figure 14. SPI-M-O medium-term projection of daily hospitalisations in
Scotland, at 50% and 90% credible intervals.
Figure 15 shows the SPI-M-O consensus on hospital occupancy.
Hospital occupancy is determined by the combination of admissions and
length of stay (LoS), the latter of which is difficult to model with
confidence.
14Figure 15. SPI-M-O medium-term projection of hospital occupancy in
Scotland, at 50% and 90% credible intervals
Figure 16 shows the SPI-M-O consensus on daily Covid-19 deaths.
Figure 16. SPI-M-O medium-term projection of daily Covid-19 deaths in
Scotland, at 50% and 90% credible intervals.
What we know about which local authorities are likely to experience
high levels of Covid-19 in two weeks’ time
We continue to use modelling based on Covid-19 cases and deaths
using data to 7th February 2022 from several academic groups to give
us an indication of whether a local authority is likely to experience
elevated levels of Covid-19 in the future. This has not been compiled via
15UKHSA into a consensus this week and is based on one modelling
group due to issues with some of the models converging. In this an area
is defined as a hotspot if the two-week prediction of cases (positive
tests) per 100K population is predicted to exceed a threshold, e.g., 500
cases.
Some of the models contributing to this analysis are informed by both
PCR and LFD positive tests whilst others are currently informed by PCR
only.
Modelled rates of positive tests per 100K using data to 7th February
(Figure 17) indicate that, for the week commencing 20th February 2022,
29 of the 32 local authorities are expected to exceed 50 cases per 100K
with at least 75% probability. The exceptions are Na h-Eileanan Siar,
Orkney Islands and Shetland Islands.
28 local authorities are expected to exceed 100 cases per 100K, with at
least 75% probability. The exceptions are South Ayrshire, Na h-Eileanan
Siar, Orkney Islands and Shetland Islands.
Four local authorities are expected to exceed 300 cases per 100K, with
at least 75% probability. These are Aberdeen, Edinburgh, Dundee and
Midlothian.
Only one local authority, Dundee, is expected to exceed 500 cases per
100K, with at least 75% probability.
16Figure 17. Probability of local authority areas exceeding thresholds of
cases per 100K (20th February to 26th February 2022), data to 7th
February.
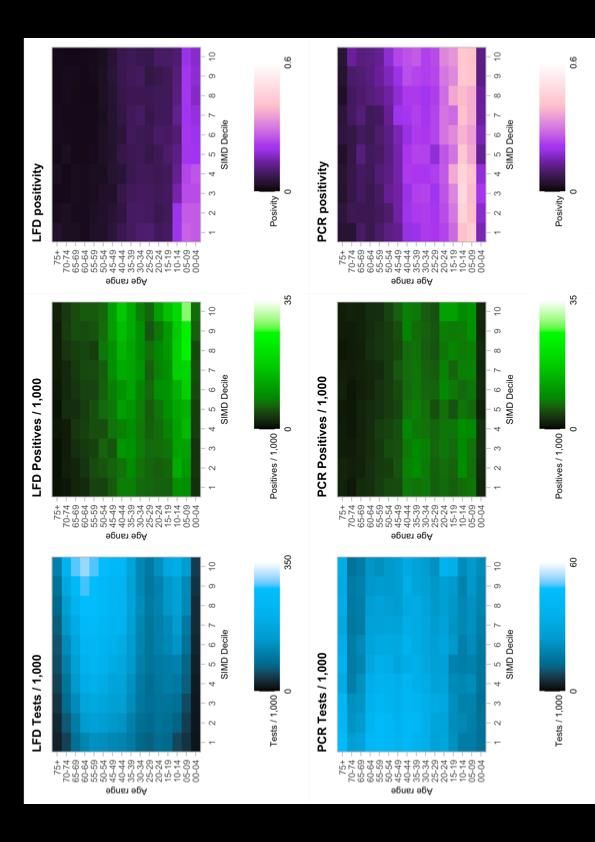
Summary of spatial analysis of COVID-19 spread in Scotland
Researchers at the Edinburgh Roslin Institute have conducted spatial
analysis of COVID-19 spread in Scotland. A summary of findings from
the week from 29th Jan to 5th Feb 2022 is included here.
In the period 29th January to 5th February, an S Gene Target Failure
(SGTF) PCR result is assumed to be due to Omicron variant BA.1. In
Scotland a test which is S-gene positive is taken to be a signature of
Omicron variant BA.2, while acknowledging there may be some residual
Delta variant cases contributing. To obtain estimates of the total spread
17of the two variants, the variant type is assigned in proportion to the
observed SGTF results per day at the Local Authority level. Figure 18
shows the outcome of modelling9 of risk factors by data zone, comparing
a model including the average age of census recorded residents to one
with no age information. Vaccine uptake is as recorded on 15th
November 2021, i.e. just before Omicron was observed in Scotland.
Data10 was taken on 7th February, covering the period 29th January to 5th
February.
The modelling shows that there remains a substantial variation in risk of
infection by age. Deprivation in this period is not a substantial factor.
Whereas the distribution of lateral flow/LFD tests being reported varies
substantially by both age and deprivation status, with many fewer tests
reported in younger adults across all deciles of deprivation 11, and for
children in more deprived deciles. The high level of LFD positivity in the
latter category is marked, and when compared to the high number of
positives amongst the least deprived, suggests this may reflect under
ascertainment.
The R value remains low for both S-gene positive and negative cases,
though there has been a marked increase in R for S-gene positives in
the past week, possibly reflecting increased spread of the BA.2 variant.
This estimate of R for the last few days of the analysis should be viewed
with caution, due to the effect of uncertain impact of partially observed
infections caused for the most recent cases.
9
The technique uses a negative binomial model.
10
electronic Data Research and Innovation Service: ISD Services | Electronic Data Research and
Innovation Service (eDRIS) | ISD Scotland.
11
For more detail on SIMD deciles refer to: Scottish Index of Multiple Deprivation 2020 - gov.scot
(www.gov.scot).
18Figure 18. Variation in testing outcomes comparing Lateral Flow and
PCR testing (based on data to 5th February).
19What can analysis of wastewater samples tell us about local
outbreaks of Covid-19 infection?
Levels of Covid-19 in wastewater (WW) collected at a number of sites
around Scotland are adjusted for population and local changes in intake
flow rate (or ammonia levels where flow is not available). See Technical
Annex in Issue 34 of these Research Findings for the methodology.
Nationwide, wastewater Covid-19 levels remained at their previous
levels, with the week ending on 7th February recording levels of 52
million gene copies per person per day (Mgc/p/d), essentially the same
as 53 Mgc/p/d the previous week. There is some slight variability
between locations, but it is not yet clear if this forms any systematic
pattern.
Compared to before December 2021, WW Covid-19 levels appear much
lower than anticipated given the known levels of Covid-19 activity, as
expressed by the ONS’s Coronavirus Infection Survey. This effect may
be due to the switchover from Delta variants to the new Omicron variant.
Thus, Figure 19 shows only data from after the end of 2021, at which
point the Omicron variant already represents almost all cases in
Scotland. In this we see that national WW viral levels have been stable
since late January.
Figure 19. National running average trends in wastewater Covid-19 from
31st December 2021 to 7th February 2022. For this graph, a wastewater
Covid-19 average using the last 7 days of data is computed at every
sampling date.
20What estimates do we have of the number of people experiencing
long Covid symptoms?
The Scottish Government is modelling the number of people likely to
experience long Covid symptoms. This gives a projection of estimated
self-reported long Covid rates in the future, based on Scottish
Government medium term projection modelling, as set out in Figure 20.
This modelling estimates that at 27th February 2022 between 60,000
(1.1% of the population) and 158,000 (2.9%) people are projected to
self-classify with long Covid for 12 weeks or more after their first
suspected Covid infection in Scotland.
These are preliminary results, further data on rates of long Covid and
associated syndromes as research emerges are required.
Figure 20. Estimates of self-classified long Covid prevalence at 12
weeks from 16th February 2020 to 27th February 2022 (showing 90%
confidence interval). ONS estimates of self-reported long Covid with
range also shown.
See the Technical Annex in issue 73 for information about the
methodology.
What next?
Modelling will continue to look at the impact of Omicron, particularly the
variant BA.2. The UKHSA Risk Assessment for BA.2 (26 Jan 2021)
stated that there is moderate confidence that BA.2 has a growth
advantage compared to BA.1, from data reported by multiple countries.
As the year progresses we will incorporate different models as and when
it is appropriate to do so.
21Technical Annex
Epidemiology is the study of how diseases spread within populations.
One way we do this is using our best understanding of the way the
infection is passed on and how it affects people who catch it to create
mathematical simulations. Because people who catch Covid-19 have a
relatively long period in which they can pass it on to others before they
begin to have symptoms, and the majority of people infected with the
virus will experience mild symptoms, this “epidemiological modelling”
provides insights into the epidemic that cannot easily be measured
through testing e.g. of those with symptoms, as it estimates the total
number of new daily infections and infectious people, including those
who are asymptomatic or have mild symptoms.
Modelling also allows us to make short-term forecasts of what may
happen with a degree of uncertainty. These can be used in health care
and other planning. The modelling in this research findings is undertaken
using different types of data which going forward aims to both model the
progress of the epidemic in Scotland and provide early indications of
where any changes are taking place.
The delivery of the vaccination programme will offer protection against
severe disease and death. The modelling includes assumptions about
compliance with restrictions and vaccine take-up. Work is still ongoing to
understand how many vaccinated people might still spread the virus if
infected. As Covid-19 is a new disease there remain uncertainties
associated with vaccine effectiveness. Furthermore, there is a risk that
new variants emerge for which immunisation is less effective.
How the modelling compares to the real data as it emerges
The following charts show the history of our modelling projections in
comparison to estimates of the actual data. The infections projections
were largely accurate from mid-January 2021 until mid-December 2021,
from which point the projections have underestimated the number of
infections, due to the unforeseen effects of the Omicron variant. The
same is true for the hospital beds projections, however the ICU beds
22projections have overestimated the actual figures since mid-December
2021, due to the lower severity of Omicron.
Figure 21. Infections projections versus actuals, for historical projections
published between one and two weeks before the actual data came in.
Hospital bed projections have generally been more precise than
infections estimates due to being partially based on already known
information about numbers of current infections, and number of people
already in hospital. The projections are for number of people in hospital
due to Covid-19, which is slightly different to the actuals, which are
number of people in hospital within 28 days of a positive Covid-19 test.
23Figure 22. Hospital bed projections versus actuals, for historical
projections published between one and two weeks before the actual
data came in.
As with hospital beds, ICU bed projections have generally been more
precise than infections. The projections are for number of people in ICU
due to Covid-19. The actuals are number of people in ICU within 28
days of a positive Covid-19 test up to 20 January 2021, after which they
include people in ICU over the 28 day limit.
24Figure 23. ICU bed projections versus actuals, for historical projections
published between one and two weeks before the actual data came in.
25Which local authorities are likely to experience high levels of
Covid-19 in two weeks’ time
Table 1. Probability of local authority areas exceeding thresholds of
cases per 100K (20th February to 26th February 2022).
Data to 7th February.
Probability of exceeding (cases per 100K)
Local Authority (LA) 50 100 300 500
Aberdeen City 75-100% 75-100% 75-100% 50-75%
Aberdeenshire 75-100% 75-100% 50-75% 25-50%
Angus 75-100% 75-100% 50-75% 25-50%
Argyll and Bute 75-100% 75-100% 25-50% 5-15%
City of Edinburgh 75-100% 75-100% 75-100% 50-75%
Clackmannanshire 75-100% 75-100% 25-50% 15-25%
Dumfries & Galloway 75-100% 75-100% 25-50% 15-25%
Dundee City 75-100% 75-100% 75-100% 75-100%
East Ayrshire 75-100% 75-100% 50-75% 25-50%
East Dunbartonshire 75-100% 75-100% 25-50% 15-25%
East Lothian 75-100% 75-100% 25-50% 15-25%
East Renfrewshire 75-100% 75-100% 25-50% 15-25%
Falkirk 75-100% 75-100% 25-50% 15-25%
Fife 75-100% 75-100% 50-75% 25-50%
Glasgow City 75-100% 75-100% 50-75% 25-50%
Highland 75-100% 75-100% 50-75% 25-50%
Inverclyde 75-100% 75-100% 50-75% 25-50%
Midlothian 75-100% 75-100% 75-100% 50-75%
Moray 75-100% 75-100% 50-75% 25-50%
Na h-Eileanan Siar 25-50% 15-25% 0-5% 0-5%
North Ayrshire 75-100% 75-100% 50-75% 25-50%
North Lanarkshire 75-100% 75-100% 25-50% 15-25%
Orkney Islands 50-75% 25-50% 0-5% 0-5%
Perth and Kinross 75-100% 75-100% 25-50% 15-25%
Renfrewshire 75-100% 75-100% 50-75% 25-50%
Scottish Borders 75-100% 75-100% 50-75% 50-75%
Shetland Islands 15-25% 5-15% 0-5% 0-5%
South Ayrshire 75-100% 50-75% 25-50% 5-15%
South Lanarkshire 75-100% 75-100% 25-50% 15-25%
Stirling 75-100% 75-100% 50-75% 25-50%
West Dunbartonshire 75-100% 75-100% 25-50% 25-50%
West Lothian 75-100% 75-100% 50-75% 25-50%
26What levels of Covid-19 are indicated by wastewater data?
Table 2 provides population weighted daily averages for normalised WW
Covid-19 levels in the weeks ending 31st January and 7th February
2022, with no estimate for error. This is given in Million gene copies per
person per day. Coverage is given as percentage of LA inhabitants
covered by a wastewater Covid-19 sampling site delivering data during
this period12.
Table 2. Average Covid-19 wastewater levels (Mgc/p/d)13.
w/e 31st w/e 7th
Local authority (LA) Coverage
January February
Aberdeen City 62 105 99%
Aberdeenshire 54 61 38%
Angus 61 88 68%
Argyll and Bute 20 32 23%
City of Edinburgh 70 47 98%
Clackmannanshire 18 68 81%
Dumfries & Galloway 51 39 39%
Dundee City 74 117 100%
East Ayrshire 28 26 72%
East Dunbartonshire 61 28 99%
East Lothian 70 45 65%
East Renfrewshire 51 41 95%
Falkirk 52 42 96%
Fife 42 53 84%
Glasgow City 57 32 98%
Highland 39 26 35%
Inverclyde 28 29 98%
Midlothian 70 46 88%
Moray – 23 42%
Na h-Eileanan Siar – – 0%
North Ayrshire 28 17 93%
North Lanarkshire 54 77 83%
Orkney Islands 40 35 34%
Perth and Kinross 22 109 38%
Renfrewshire 47 36 97%
Scottish Borders 29 34 55%
Shetland Islands – – 0%
South Ayrshire 28 30 88%
South Lanarkshire 58 55 59%
Stirling 12 12 63%
West Dunbartonshire 48 41 98%
West Lothian 45 68 95%
12
Advancements in detection and interpretation practices allow us to identify when outlying results
are anomalous rather than indicators of spikes in Covid-19 levels. Table 3 provides population
weighted daily averages for normalised WW Covid-19 levels with the outliers removed. See Technical
Annex in Issue 60 of these Research Findings for further details.
13
Coverage as for week ending 7th February 2022.
27This publication will be available in accessible HTML on the gov.scot website © Crown copyright 2022 You may re-use this information (excluding logos and images) free of charge in any format or medium, under the terms of the Open Government Licence. To view this licence, visit http://www.nationalarchives.gov.uk/doc/open- government-licence/ or e-mail: psi@nationalarchives.gsi.gov.uk. Where we have identified any third party copyright information you will need to obtain permission from the copyright holders concerned. The views expressed in this report are those of the researchers and do not necessarily represent those of the Scottish Government or Scottish Ministers. This document is also available from our website at www.gov.scot. ISBN: 978-1-80435-051-5 The Scottish Government St Andrew’s House Edinburgh EH1 3DG Produced for the Scottish Government by APS Group Scotland PPDAS1027059 (02/22) Published by the Scottish Government, February 2022 ISBN 978-1-80435-051-5 Web Publication PPDAS1027059 (02/22)
You can also read