Covid Inflation: Evidence from Real-Time Data - Webinar
←
→
Page content transcription
If your browser does not render page correctly, please read the page content below
Webinar                       Hosted from PRINCETON
                                       For EVERYONE, WORLDWIDE

                Covid Inflation:
                Evidence from
                Real-Time Data
Alberto Cavallo
Harvard Business School

17. June 2021    Markus Brunnermeier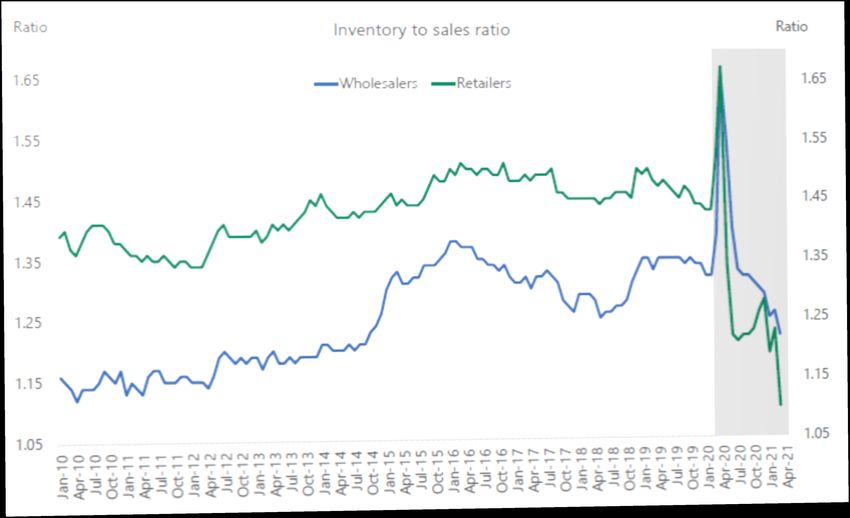
Inflation whipsaw
Bond trader’s expectations
Households
Bondtraders
Inflation Scenarios
Relative Price Changes Inflation is not about relative price changes Signal of scarcity – Hayek … but also signal about spike/permanent?
Simply “undoing Covid lowflation”
No food, no energy
+ Changing consumption basket
Francisco Fed (2021San)
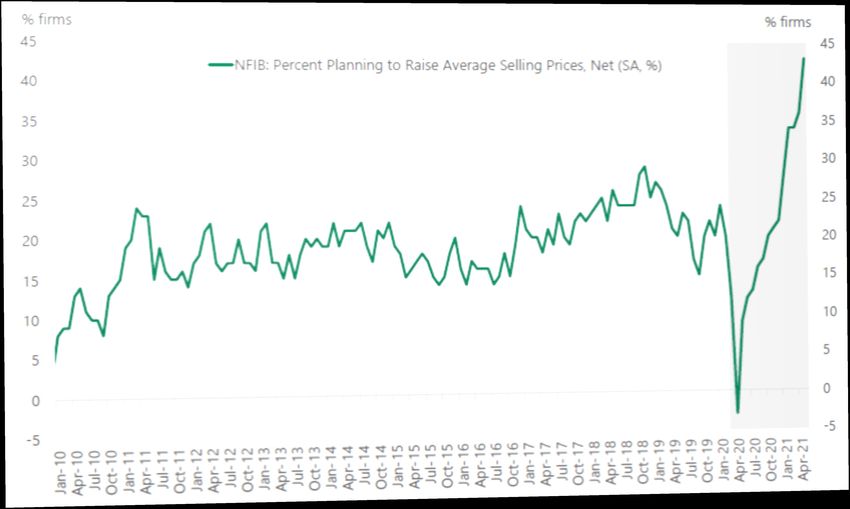
Temporary one-off spike or permanent?
Fraction of Firms Planning to Raise Price

 Source: Torsten Slok
Inventory to Sales Ratio in US

 Source: Census Bureau, Torsten Slok
Poll
1. What is the main advantage of having private
   sector data for economic statistics?
  a.   speed,                   c. details
  b.   high-frequency,          d. other
2. During Covid, did you personally experience
   …. inflation to the one measured by the CPI?
  a.   Higher than measured     c. similar
  b.   Lower
3. Were you surprised with the rapid increase in US inflation?
  a.   Yes
  b.   No
4. Do you believe that the increase in
   inflation is mostly temporary?
  a.   Yes
  b.   No
Covid Inflation: Evidence from Real-Time Data

Alberto Cavallo
Harvard Business School, NBER

Markus’ Academy – June 17th 2021
US Price Index

                                                Online

        Source: PriceStas - State Street, BLS

2
Roadmap for today
• Online Price Indices
– Main characteristics
– Current inflation trends
• What is driving US Inflation?
– Measurement distortions (Basket Weights)
– Supply disruptions (Stockouts)
– Pent-up Demand (Sales Behavior)
3Inflation Measurement with Online Data
• History:
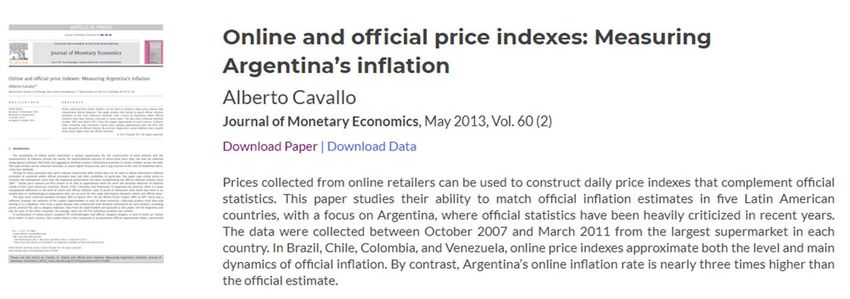
– 2007: Argentina Lies – “Inflacion Verdadera”
“Web Scraping”
Leche Condensada
Nestlé
$1.199 Uni
4Inflation Measurement with Online Data
• History:
– 2007: Argentina Lies – “Inflacion Verdadera”
5Inflation Measurement with Online Data
• History:
– 2007: Argentina Lies – “Inflacion Verdadera”
– 2008: The Billion Prices Project
6Inflation Measurement with Online Data
• History:
– 2007: Argentina Lies – “Inflacion Verdadera”
– 2008: The Billion Prices Project
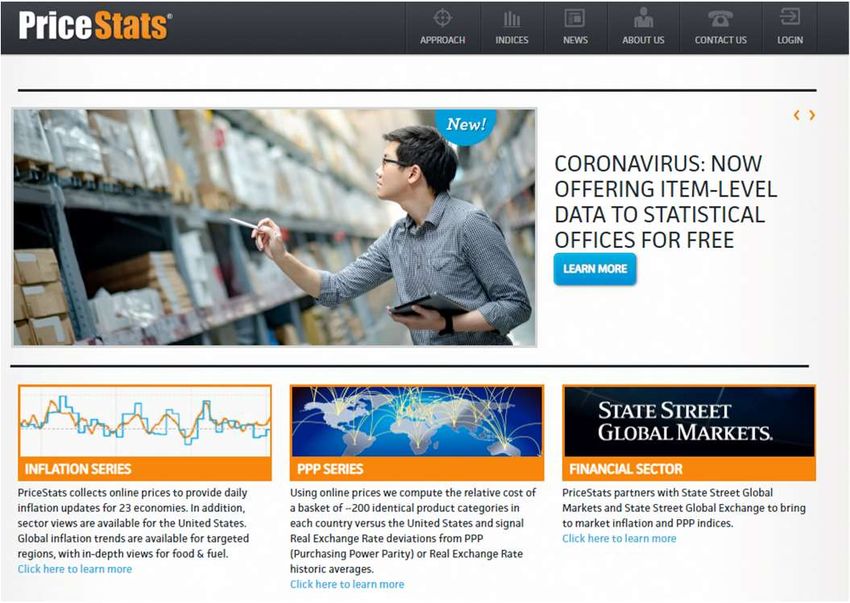
– 2010: PriceStats (www.pricestats.com)
– Real-time inflation in 22 countries
– Daily data collected online
– Over 1000 large retailers
– PPP indicators in 8 countries
– Data shared with Central Banks,
policymakers, NSOs, and researchers
7Online Data vs CPI
• Speed – Real-time (3-day lag)
• High frequency – Daily
• Low cost per observation (vs traditional survey method)
• Full price history for all goods in each retailer (micro analysis)
• Same methodology in every country & over time (comparisons)
• Official basket weights and main CPI methods
• But no hedonics, seasonal adjustments, or other special index methods
• Limited Coverage
– Retailers: multi-channel (online and offline)
– Sectors: Most goods, but few services and no housing
8What are online price indices useful for? • Cannot match the CPI inflation rates every month 9
What are online price indices useful for?
• Cannot match the CPI inflation rates every month

10
What are online price indices useful for?
• Anticipating changes in inflation trends

11
                      Source: Cavallo & Rigobon (2016) “The Billion Prices Project”, Journal of Economic Perspectives, Spring 2016, Vol 30(2):151-78.
What are online price indices useful for?
• Anticipating changes in inflation trends
12
Source: PriceStats – State Street , BLSCovid “Turning Points” 13
Nearly all countries are now at the highest inflation level in 13 years

14
What explains the rise of US inflation?

15
What explains the rise of US inflation?

Three factor that are frequently mentioned:

1)   Measurement Distortions

2)   Supply Disruptions

3)   Pent-up Demand

Can we use real-time data to estimate their impact on current inflation numbers?

16
Measurement Distortions: CPI Weights
Cavallo (2020) “Inflation with Covid Consumption Baskets” NBER WP 27352
• The US CPI weights are adjusted every December with 2-year lagged expenditure data
• But the Pandemic dramatically changed consumption patterns more food, less transportation
17
Source: Cavallo (2020) "Inflation with COVID Consumption Baskets." NBER WP, No. 27352. More up-to-date results at https://projects.iq.harvard.edu/covid-cpiMeasurement Distortions: CPI Weights
Cavallo (2020) “Inflation with Covid Consumption Baskets” NBER WP 27352
• The US CPI weights are adjusted every December with 2-year lagged expenditure data
• But the Pandemic dramatically changed consumption patterns more food, less transportation
18
Source: Cavallo (2020) "Inflation with COVID Consumption Baskets." NBER WP, No. 27352. More up-to-date results at https://projects.iq.harvard.edu/covid-cpiIn 2020, the CPI was under-estimating the annual inflation rate 19
In 2021, the CPI is over-estimating the annual inflation rate
Source: Cavallo (2020) "Inflation with COVID Consumption Baskets." NBER WP, No. 27352. More up-to-date results at https://projects.iq.harvard.edu/covid-cpi
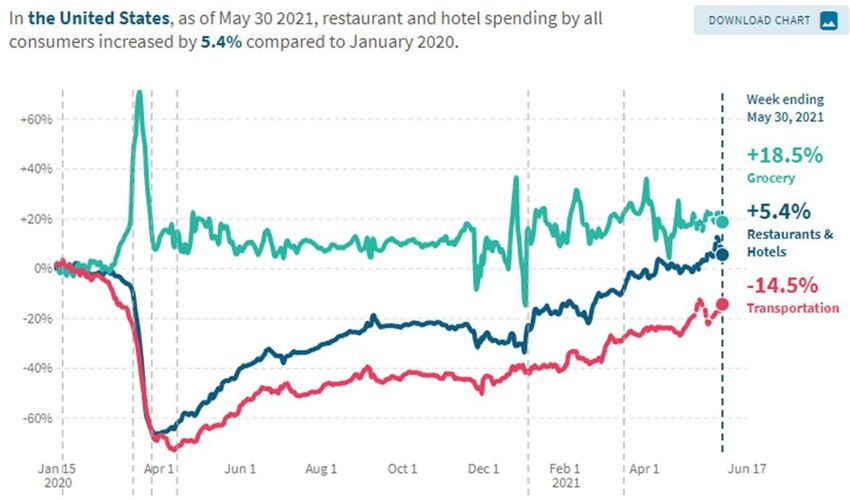
20In 2021, the CPI is over-estimating the annual inflation rate
• Too much weight to
transportation, even though
Fuel & Used Cars
spending is still ~25% below pre-
Covid levels (Opportunity
Insights)
Source: Cavallo (2020) "Inflation with COVID Consumption Baskets." NBER WP, No. 27352. More up-to-date results at https://projects.iq.harvard.edu/covid-cpi
21In 2021, the CPI is over-estimating the annual inflation rate
• Too much weight to
transportation, even though
spending is still ~25% below pre-
Covid levels
• The fixed-basket exacerbated the
temporary “base effects” in the 4.2%
annual inflation rate, because the
CPI “fell too much” in 2020
5.1%
Source: Cavallo (2020) "Inflation with COVID Consumption Baskets." NBER WP, No. 27352. More up-to-date results at https://projects.iq.harvard.edu/covid-cpi
22Measurement Distortions: CPI Weights • Also affecting core (non-energy transportation) • Some inflation inequality (low-income HHs consume more food, less transport) • Similar bias in countries with divergence in sectoral inflation rates • Temporary because spending patterns are normalizing (before the CPI weights) 23
But this not just about temporary measurement problems…
• The US online index appears to be on a new trajectory since late November (~5% annualized rate)

                                                                     +2.5% in 6 months

              Source: State Street Global Markets, PriceStats, BLS
24
But this not just about temporary measurement problems…
• Above-average inflation in 8 of the last 9 months (even without “used cars and trucks”)
*
Note: * June 2021 numbers based on 10 days of data.
25 Source: PriceStats.Are supply disruptions pushing prices up?
Cavallo & Kryvtsov (2021) “Stockouts, Supply Disruptions and Inflation: Evidence from Online Micro Data”
Disclaimer: The views expressed here are ours, and they do not necessarily reflect the views of the Bank of Canada.
• Covid Disruptions:
– Operational shut-downs, hoarding, sudden change in distribution channels, costs of operating with
social distancing, global supply-chain bottlenecks
– Can we detect them at the retail level? Can we estimate the impact on prices?
• We measure stockouts in 17 large US retailers selling 700K products in 5 major good categories
26Measuring Retail Stockouts
$ $ $ $
Note: This image illustrates the out of stock information, but this specific retailer may not be in the dataset
27Temporary Stockouts 28
Measuring Retail Stockouts

                             $           $                                          $           $

         Note: This image illustrates the out of stock information, but this specific retailer may not be in the dataset

29
From Temporary to “Permanent Stockouts” (discontinued goods)
20% below
Pre-Covid levels
30Total stockouts are still about 20% higher than pre-Covid levels
Source: Cavallo & Kryvtsov (2021) “Stockouts, Supply Disruptions and Inflation: Evidence from Online Micro Data” (Preliminary Results)
Disclaimer: The views expressed here are ours, and they do not necessarily reflect the views of the Bank of Canada.
31Stockouts have already fallen in some sectors
Healthcare Goods Furnishing & Household Goods
32But they are persistent in Food and Electronics
Food and Beverages Recreation and Electronics
34Stockouts in L2 Categories
Category Max Temp OOS Max All OOS Latest All OOS
Food 15 53 11
Goods and services for routine household maintenance 11 42 10
Non-alcoholic beverages 10 40 27
Other major durables for recreation and culture 10 79 78
Personal care 8 35 1
Audio-visual, photographic and information processing equipment 6 36 27
Other recreational items and equipment, gardens and pets 6 45 34
Medical products, appliances and equipment 6 25 -13
Glassware, tableware and household utensils 6 36 -5
Furniture and furnishings, carpets and other floor coverings 6 31 5
Household appliances 5 32 22
Tools and equipment for house and garden 5 59 58
Household textiles 3 21 -5
Personal effects n.e.c. 0 29 -16
35Stockouts are correlated with sectoral inflation rates
Source: Cavallo & Kryvtsov (2021) “Stockouts, Supply Disruptions and Inflation: Evidence from Online Micro Data” (Preliminary Results)
Disclaimer: The views expressed here are ours, and they do not necessarily reflect the views of the Bank of Canada.
36Stockouts are correlated with sectoral inflation rates
Source: Cavallo & Kryvtsov (2021) “Stockouts, Supply Disruptions and Inflation: Evidence from Online Micro Data” (Preliminary Results)
Disclaimer: The views expressed here are ours, and they do not necessarily reflect the views of the Bank of Canada.
37Stockouts are correlated with sectoral inflation rates • More impact on electronics and food, where the stockouts are more persistent • A 20 percentage point increase in OOS 0.46% increase in annual inflation for these goods 38
The impact on inflation is significant
• Roughly 1/2 of the additional annual inflation in some of these sectors

39
The impact on inflation is gradual and peaks at 6 weeks

40          Note: Impulse response using Jorda (2005) linear projection method. OOS shock computed as the residual of AR(1) process
            with weekly data. Dependent variable is the change in MoM regressed on lags of OOS shock and MoM, with sector fixed effects.
Looking ahead: should we worry about these supply disruptions?
• No…
– Stockouts are starting to fall in many sectors, consistent with the idea that these are
temporary shocks
– Price impact is limited to sectors where the disruption was more persistent (Cavallo,
Gopinath, Neiman & Tang (2020) “Tariffs Passthrough at the Border and at the Store:
Evidence from US Trade Policy” AER Insights)
• Yes…
– Price effects will remain for a while, potentially contributing to higher inflation
expectations (Cavallo, Cruces, Perez-Truglia (2017) "Inflation Expectations, Learning,
and Supermarket Prices: Evidence from Survey Experiments." AEJ: Macro)
– Covid moved transactions online, where prices react faster to shocks (Cavallo (2018)
“More Amazon Effects: Online Competition and Pricing Behaviors”, Jackson Hole
Symposium)
41Pent-Up Demand: US Sales Behavior
• Preliminary Results (truly “real time”)
• Some recent papers have shown that sales tend to be counter-cyclical
Kryvtsov & Vincent (2021) “The Cyclicality of Sales and Aggregate Price
Flexibility”, Review of Economic Studies
• Can we look at “sales” behaviors across sectors to say something about
current demand dynamics?
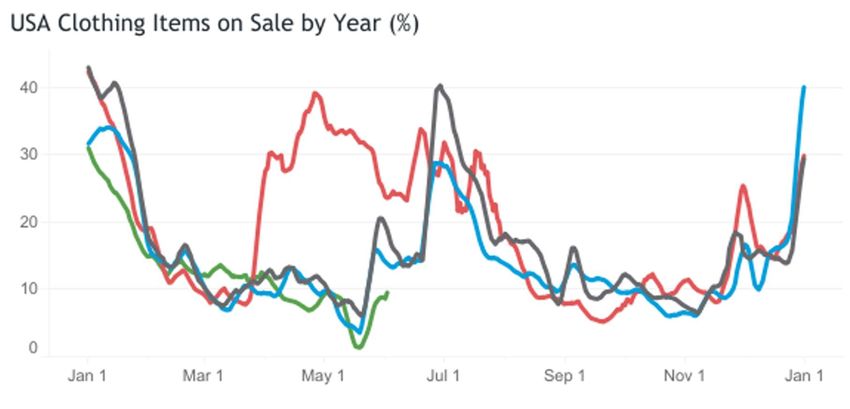
• Using online micro data, we can measure the share of sales (discounts) every
day using a “sales flag” and/or a price-drop algorithmClothing: Back to Normal
Furniture: Sales are still abnormally low high demand
Electronics: Low sales, but normalizing
Summary of Results
• Measurement distortions are adding ~0.9% to the US annual inflation rate (CPI, May)
– Consumption basket over-estimating impact of fuel and used cars, exacerbating
“base effects”
• Supply disruptions putting significant pressure on inflation (Consumer Goods, April)
– Stockouts remain high at 20% above pre-Covid levels for a weighted-basket of
CPI goods
– The price impact is concentrated in electronics and food, where the disruption has
been more persistent
– Many sectors are already “back to normal” (health products, household goods,
personal care and others)
• Pent-up Demand
– US sales behavior consistent with unusually high demand in furniture, but normalizing
for apparel and electronicsUS Inflation
Alberto Cavallo
     HBS, NBER
www.albertocavallo.com
Additional Slides 49
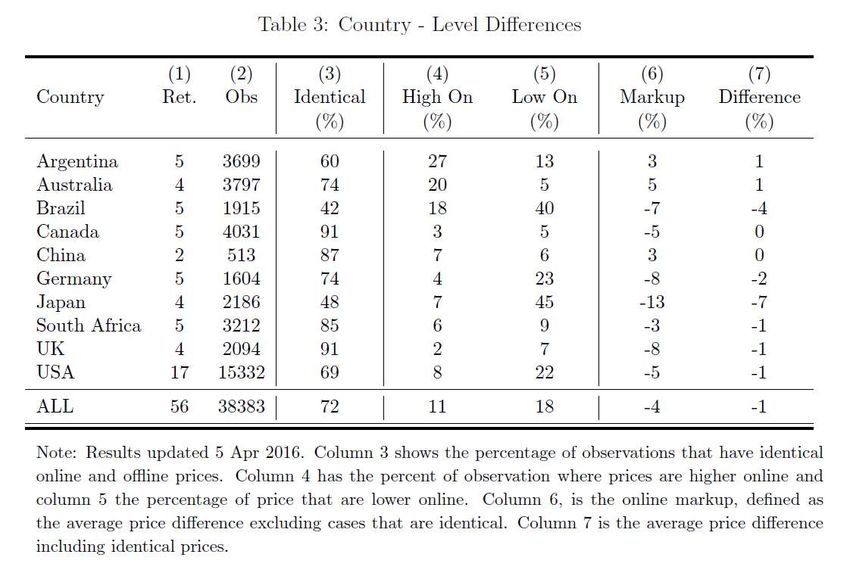
Are Online and Offline Prices Similar?

   Cavallo (2017) “Are Online and Offline Prices Similar: Evidence from Large Multi-
   Channel retailers”, AER

   Large-scale comparison of online and offline prices collected simultaneously in ~50
   retailers in 10 countries.

   Crowdsourced workers scan random barcodes, enter prices, send emails with data
   files.

   We then scraped the online price for the same good-retailer (within 7 days).
Prices are identical ~70% of the time

            Source: Cavallo (2017) “Are Online and Offline Prices Similar? Evidence from Large Multi-Channel Retailers”, American Economic Review Vol 107(1)
Exchange-Rate Passthrough inflationary in Brazil
“PPP” indices created as a weighted basket of
thousands of product-level RERs for identical
products matched across countries (in 3
categories: food, fuel, electronics)
Brazil
Depreciation lowered the relative cost of
tradable goods
Some passthrough into relative prices, but
still the basket cost is too low relative to
historical standards (~20% “undervalued”)
Pressure for relative prices to increase
(exchange rate passthrough) or the
currency to appreciate (less likely in Brazil)
Source: State Street , PriceStats
53You can also read


