Deep Learning Approach Using Diffusion-Weighted Imaging to Estimate the Severity of Aphasia in Stroke Patients
←
→
Page content transcription
If your browser does not render page correctly, please read the page content below
Journal of Stroke 2022;24(1):108-117
                                                                                                                                       https://doi.org/10.5853/jos.2021.02061

                                                                                                                                                      Original Article

Deep Learning Approach Using Diffusion-Weighted
Imaging to Estimate the Severity of Aphasia in
Stroke Patients
Soo Jeong,a,* Eun-Jae Lee,a,* Yong-Hwan Kim,b Jin Cheol Woo,c On-Wha Ryu,a Miseon Kwon,a
Sun U Kwon,a Jong S. Kim,a Dong-Wha Kanga
a
  Department of Neurology, Asan Medical Center, University of Ulsan College of Medicine, Seoul, Korea
b
  Nunaps Inc., Seoul, Korea
c
 Asan Institute for Life Sciences, Asan Medical Center, University of Ulsan College of Medicine, Seoul, Korea

Background and Purpose This study aimed to investigate the applicability of deep learning (DL)                                        Correspondence: Dong-Wha Kang
                                                                                                                                      Department of Neurology, Asan Medical
model using diffusion-weighted imaging (DWI) data to predict the severity of aphasia at an early                                      Center, University of Ulsan College of
stage in acute stroke patients.                                                                                                       Medicine, 88 Olympic-ro 43-gil, Songpa-
                                                                                                                                      gu, Seoul 05505, Korea
Methods We retrospectively analyzed consecutive patients with aphasia caused by acute ischemic                                        Tel: +82-2-3010-3440
stroke in the left middle cerebral artery territory, who visited Asan Medical Center between 2011                                     Fax: +82-2-474-4691
                                                                                                                                      E-mail: dwkang@amc.seoul.kr
and 2013. To implement the DL model to predict the severity of post-stroke aphasia, we designed
                                                                                                                                      https://orcid.org/0000-0002-2999-485X
a deep feed-forward network and utilized the lesion occupying ratio from DWI data and estab-
lished clinical variables to estimate the aphasia quotient (AQ) score (range, 0 to 100) of the Korean                                 Received: June 8, 2021
                                                                                                                                      Revised: September 16, 2021
version of the Western Aphasia Battery. To evaluate the performance of the DL model, we analyzed                                      Accepted: October 5, 2021
Cohen’s weighted kappa with linear weights for the categorized AQ score (0–25, very severe; 26–
                                                                                                                                      *These authors contributed equally to
50, severe; 51–75, moderate; ≥76, mild) and Pearson’s correlation coefficient for continuous val-                                     the manuscript as first author.
ues.
Results We identified 225 post-stroke aphasia patients, of whom 176 were included and analyzed.
For the categorized AQ score, Cohen’s weighted kappa coefficient was 0.59 (95% confidence in-
terval [CI], 0.42 to 0.76; P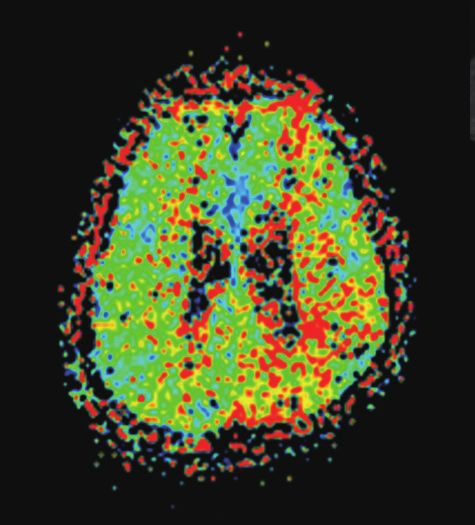
Vol. 24 / No. 1 / January 2022

score value) have yet to be estimated from stroke imaging          unstable or uncooperative.
analysis.                                                            We included patients who had ischemic lesions in the left
   Deep learning (DL) techniques, which are applications of ar-    middle cerebral artery (MCA) territory and those who under-
tificial intelligence, have recently emerged and are now rigor-    went K-WAB within 14 days of symptom onset. Patients with
ously applied in the medical field, especially in outcome pre-     multiple lesions in multiple vascular territories were also in-
diction studies using imaging data.10,11 Because DL techniques     cluded if they had aphasia and stroke lesions in the left MCA
may use multiple features that are invisible to humans,12,13 we    territory. Only patients who used Korean as their first language
hypothesized that DL methods may be helpful in estimating          were included. We excluded patients who did not undergo DWI
the severity of aphasia at an acute stage after stroke using       or who demonstrated old stroke lesions within the left MCA
magnetic resonance imaging (MRI) data. Consequently, we de-        territory on fluid-attenuated inversion recovery or gradient
veloped a DL model using diffusion-weighted imaging (DWI) to       echo sequences of MRI.16 Patients who had previously been di-
estimate the aphasia quotient (AQ) score of the Korean version     agnosed with dementia that caused communication difficulties
of the Western Aphasia Battery (K-WAB) (range, 0 to 100),14        before the index stroke were also not included in the study. In
which reflects the severity of aphasia in stroke patients with     addition, left-handed patients were excluded to ensure study
acute stroke, and evaluated its performance by comparing it        consistency.
with the true values of each patient. In the meantime, we also
developed logistic regression models that estimate the AQ          DWI data processing
score to evaluate the performance of the DL method, as com-        The patients underwent 1.5-T MRI (Magnetom Avanto, Sie-
pared to that of the conventional machine-learning approach.       mens Healthineers, Erlangen, Germany). The ischemic lesion
                                                                   mask was extracted in the native DWI space using the FSLView
Methods                                                            toolbox in the functional MRI of the brain software library
                                                                   (FSL, developed by Oxford Center for Functional MRI of the
Data availability                                                  Brain, Oxford, UK). Initial DWI was used for the analysis. A
Anonymized data are available on reasonable request from any       stroke neurologist, who was blinded to all clinical information,
qualified investigator.                                            manually segmented the DWI high-signal intensity area to
                                                                   measure the ischemic lesion. In patients with lesions in multi-
Study design and patient selection                                 ple vascular territories, lesions outside the left MCA territory
We retrospectively analyzed consecutive acute stroke patients      were also included in the lesion volume analysis. When we ob-
with aphasia who visited the Asan Medical Center (Seoul,           tained image features, only lesions in the left hemisphere were
South Korea) within 7 days of symptom onset between January        targeted and analyzed. Affine transformation and nonlinear
2011 and December 2013. Aphasia was defined as the presence        warping coefficients were estimated between the DWI using a
of a score greater than 1 in the best language category of the     b-value of zero in the native space and standard Montreal
National Institutes of Health Stroke Scale.15 In Asan Medical      Neurological Institute 152 T2 template images via the Func-
Center, during the study period, we usually performed MRI, in-     tional Magnetic Resonance Imaging of the Brain’s linear or
cluding DWI and fluid-attenuated inversion recovery sequenc-       nonlinear image registration tool. The estimated parameters
es, in stroke patients. If patients were considered candidates     were applied to the delineated lesion masks.
for acute revascularization, brain computed tomography was            To cover the whole brain area and to consider white matter
the a priori imaging modality in Asan Medical Center to ex-        regions, we used five brain ATLAS templates (Broadmann’s Area
clude the presence of hemorrhage; MRI was subsequently per-        [BA], Automated Anatomical Labeling [AAL], Harvard-Oxford
formed in the emergency room immediately after the initiation      [HO], JHU white matter label [WM-Label], and JHU white mat-
of alteplase injection. The choice to perform intra-arterial       ter track [WM-Track]) for analyzing the brain imaging informa-
thrombolysis/thrombectomy was determined according to a            tion. The lesion occupying ratio in each individual cortex was
comprehensive analysis considering MRI lesion characteristics,     calculated for five human brain ATLASs (BA, 41 left hemisphere
vessel status, and patients’ neurological status. Therefore, DWI   regions among 82 region labels; AAL, 54 among 116; HO, 55
was performed after the initiation of alteplase before mechan-     among 110; WM-Label, 19 among 44; and WM-Track, nine out
ical thrombectomy. After neurological stabilization at the dis-    of 20) in the standard Montreal Neurological Institute space to
cretion of the attending physicians, the K-WAB was routinely       quantitatively calculate the regional damage as follows: (vol-
performed in patients with aphasia, unless patients were vitally   ume of lesion inside the individual gyrus/total volume of indi-

https://doi.org/10.5853/jos.2021.02061                                                                      http://j-stroke.org   109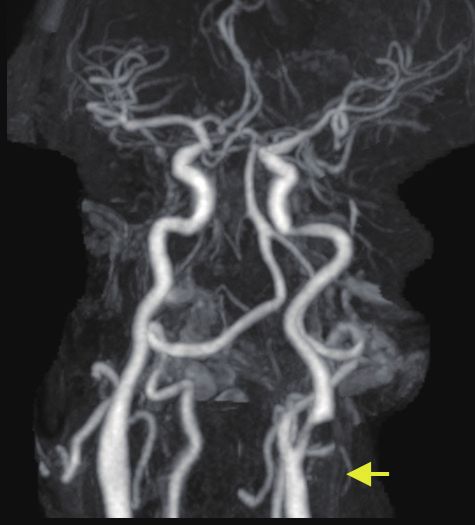
Jeong et al.   Deep Learning Model to Predict Aphasia Severity

vidual gyrus)×100 (%).17                                            sets was 3:1. The DL model was established with randomly se-
                                                                    lected 70% of the training set at 1,000 times (i.e., 1,000 DL
Data collection                                                     models were generated by the bagging strategy). For the test
To develop the DL model, we obtained 184 features, including        set, the predicted scores from 1,000 models were averaged.
178 lesion occupying ratio features derived from manually seg-
mented infarct lesions on DWI, and six clinical features (age,      Logistic regression model
sex, interval between the K-WAB test and onset, interval be-        We developed a conventional machine-learning model using
tween DWI and onset, education, and lesion volume), which are       logistic regression with Lasso (least absolute shrinkage and se-
regarded as important prognostic factors for post-stroke apha-      lection operator) regularization.20 Lasso regression is a model
sia.18 Clinical features were obtained from electronic medical      that shrinks regression coefficients towards zero, thereby ef-
records. As an outcome parameter, the AQ score, a composite         fectively reducing feature redundancies in the imaging fea-
score of the K-WAB, was adopted and collected. In Asan Medi-        tures, driven by using multiple brain ATLAS templates. We used
cal Center, the K-WAB was performed by two dedicated speech         a 5-fold cross-validation to yield the optimal regularization
therapists with experience in speech evaluation and therapy for     parameter. To examine whether the logistic regression model
more than 5 years. The AQ score ranges from 0 to 100, with a        can process a large number of image features, as well as a
higher score representing better language performance.              small number of clinical features, to improve its performance
                                                                    with increasing datasets, we developed multiple regression
Deep learning model                                                 models by inputting different sets of features: (1) clinical fea-
We utilized a deep feed-forward network (DFFN) for the DL           tures only, (2) imaging features only, and (3) clinical+imaging
model and did not use convolutional neural network approach-        features.
es. We chose 178 lesion occupying ratio features associated
with the left hemisphere regions among various atlases on DWI       Statistical analysis
and clinical features as input parameters. DFFN was imple-          Baseline characteristics between the training and test sets
mented using PyTorch (developed by Facebook’s AI Research           were compared using the chi-square test or Fisher’s exact test
lab). DFFN consists of four fully connected layers: an input lay-   for categorical variables and the t-test or Mann-Whitney U
er (184 nodes), 1st hidden layer (90 nodes), 2nd hidden layer       test for continuous variables, as appropriate. To compare the
(30 nodes), and an output layer. The hard hyper-tangent acti-       voxel-wise frequency difference of lesions between the train-
vation function was adopted for the 1st and 2nd hidden layers       ing and test groups, the Bernoulli model-based two-sample
with minimum/maximum values of −1 to 1. Finally, the output         t-test was performed for each voxel.21 We calculated Cohen’s
layer is fully connected and concatenates the outputs of the        weighted kappa with linear weights22 between the categorized
1st and 2nd layers, resulting in a final score with a hyper-tan-    model-estimated scores and true AQ scores (0–25, very severe;
gent activation function having a range of 0 to 1. During train-    26–50, severe; 51–75, moderate; ≥76, mild).23 The degree of
ing of the model, mean-squared error as a loss function and         agreement using Cohen’s weighted kappa were as follows:
Adam optimizer with a learning rate of 0.001 with default pa-       poor (
Vol. 24 / No. 1 / January 2022

SPSS statistical software version 25.0 (IBM Co., Armonk, NY,                      total of 36 patients received alteplase or intra-arterial throm-
USA).                                                                             bolysis/thrombectomy treatment. Of the 176 patients who
                                                                                  were finally included, 127 were assigned to the training set
Standard protocol approvals, registrations, and                                   and 49 were assigned to the test set. There were no significant
patient consents                                                                  differences in the baseline characteristics between the training
The study was performed in accordance with the Good Clinical                      and test sets (Table 1). The spatial patterns of lesions were an-
Practice guidelines and the Declaration of Helsinki, and was                      alyzed by comparing the lesion proportion in every single voxel
approved by the Institutional Review Board of Asan Medical                        between the training and test groups using the Bernoulli mod-
Center (IRB No. 2020-1794). Written informed consent was                          el-based two-sample t-test. There were no significant differ-
waived owing to the retrospective nature of the study.                            ences between the groups (Figure 2).

Results                                                                           Performance of the machine-learning model
                                                                                  For categorized AQ score, the DL model showed an accuracy of
Participants                                                                      61% in total, with Cohen’s weighted kappa of 0.59 (95% con-
During the study period, a total of 225 acute stroke patients                     fidence interval [CI], 0.42 to 0.76; P14 days after symptom onset, n=3]) (Figure 1).                       (95% CI, 0.55 to 0.83; P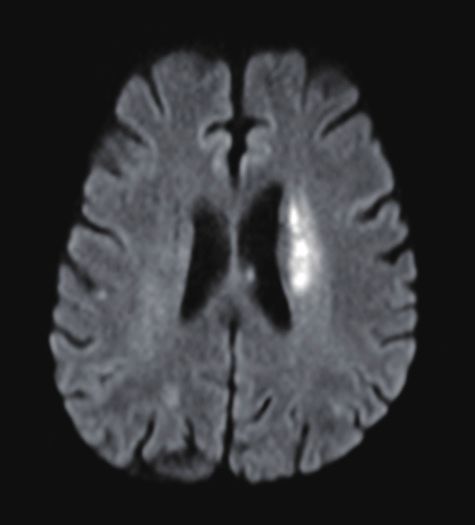
Jeong et al.      Deep Learning Model to Predict Aphasia Severity

Table 1. Baseline characteristics of patients in the training and test set
Characteristic                                              127 Training set                     49 Test set                              P
Age (yr)                                                       65.9±11.8                         68.0±12.0                               NS
Female sex                                                      46 (36.2)                         14 (28.6)                              NS
Hypertension                                                    60 (47.2)                         31 (63.3)                              NS
Diabetes                                                        40 (31.5)                         14 (28.6)                              NS
NIHSS on admission                                               8.3±5.5                          8.4±5.5                                NS
Years of education                                             10.1±5.1                          10.1±4.7                                NS
                     3
Lesion volume (cm )                                            58.4±75.7                         38.9±49.9                               NS
MRI from onset (hr)                                            56.1±66.7                         60.4±59.2                               NS
K-WAB from onset (day)                                           3.9±3.0                          3.4±2.1                                NS
AQ score                                                       43.6±30.3                         37.7±31.1                               NS
  Mild (≥76)                                                    29 (22.8)                         13 (26.5)                              NS
  Moderate (51–75)                                              28 (22.0)                            6 (12.2)                            NS
  Severe (26–50)                                                27 (21.3)                            8 (16.3)                            NS
  Very severe (0–25)                                            43 (33.9)                         22 (44.9)                              NS
Values are presented as mean±standard deviation or number (%).
NS, non-significant; NIHSS, National Institutes of Health Stroke Scale; MRI, magnetic resonance imaging; K-WAB, Korean version of the Western Aphasia
Battery; AQ, aphasia quotient.

                                                                           A                                                                        B

Figure 2. Lesion pattern heat maps of (A) training and (B) test groups. A heat map was used to visualize the proportion of lesions in each voxel. We compared
the lesion proportion in every voxel between the training and test groups using the Bernoulli model-based two-sample t-test, but found no difference be-
tween the training and test groups (P>0.05).

112     http://j-stroke.org                                                                                             https://doi.org/10.5853/jos.2021.02061
Vol. 24 / No. 1 / January 2022

 Table 2. Contingency table between the true score and model-estimated score
                                                                                            True score
                                                                                                                                                    Total
                                                          Very severe            Severe                  Moderate            Mild
   Model-estimated score
              Very severe                                     16                    3                       2                 0                      21
              Severe                                          4                     4                       1                 2                      11
              Moderate                                        1                     1                       3                 4                       9
              Mild                                            1                     0                       0                 7                       8
   Total                                                      22                    8                       6                 13                     49
   Accuracy                                               16/22 (73)             4/8 (50)                3/6 (50)          7/13 (54)             30/49 (61)
 Values are presented as number (%). Cohen’s weighted kappa, κ=0.59 (95% confidence interval, 0.42 to 0.76; P
Jeong et al. Deep Learning Model to Predict Aphasia Severity
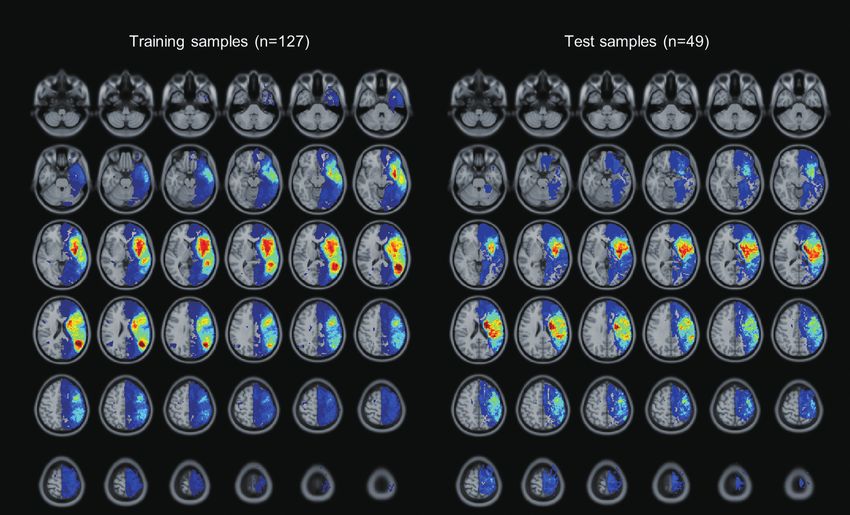
Table 3. Clinical features of cases with significant discrepancies between model-estimated score and true AQ score
Case 1 Case 2 Case 3
Age (yr) 81 75 54
Sex Male Male Female
Years of education 9 6 12
Model-estimated AQ score 90.5 55.7 1.8
True AQ score 28.6 0.5 78.1
NIHSS on admission 10 9 9
MRI from onset (hr) 3.6 83 0.8
K-WAB from onset (day) 3 9 5
Prime suspect for discrepancy Low perfusion due to left proximal ICA stenosis Abulia due to bilateral frontal lesions Early revascularization
AQ, aphasia quotient; NIHSS, National Institutes of Health Stroke Scale; MRI, magnetic resonance imaging; K-WAB, Korean version of the Western Aphasia
Battery; ICA, internal carotid artery.
A B E F I J
C D G H K L
Figure 4. Imaging characteristics of cases with notable discrepancies. Panels represent (A-D) Case 1, (E-H) Case 2, and (I-L) Case 3, respectively. (A, B) Small
acute lesions in the left internal carotid artery (ICA) border zone (yellow arrowheads) on diffusion-weighted imaging (DWI); (C) increased time-to-peak value
in the left middle cerebral artery (MCA) territory; (D) severe stenosis in the left proximal ICA (yellow arrow); (E-H) acute infarction in the left corona radiata
and bilateral anterior cerebral artery territory on DWI, especially in the left anterior cingulate cortex (yellow arrow); (I, J) large but subtle DWI high-signal in-
tensity in the left MCA territory (yellow dashed lines); (K) occlusion of the left MCA inferior division (yellow arrow) on conventional angiography; (L) subse-
quent recanalization after immediate mechanical thrombectomy.
examine language function in stroke patients during the acute est loss of information. Another strength of the DL model is its
stage. Therefore, a DL model using acute MRI data may be use- ability to handle large datasets. Although logistic regression
ful in clinical practice because it can evaluate language func- approaches can also give rise to a model dealing with image
tion regardless of patient cooperation and/or concomitant features, the overfitting issue is always a concern in conven-
medical conditions. tional models. In this study, we developed a logistic regression
The major strength of this study is that we developed a DL model, showing a comparable performance with our DL model,
model to estimate aphasia severity in detail. Although several with only six clinical features (correlation coefficients for AQ
models have been used to predict the outcome of aphasia after scores, 0.70 vs. 0.72). However, logistic regression approaches
stroke,7,9,29,30 these models use conventional logistic regression failed to enhance performance when adding image features to
to construct a model that uses only categorized image infor- clinical features. This unstable performance of logistic regres-
mation (e.g., small or large lesions) or outcomes (e.g., good or sion models raises the importance of DL algorithms, which can
bad outcomes). This process could have caused a marked loss successfully process large-sized image features.31 Additionally,
of information. However, DL techniques can handle original in this study, we used imaging (DWI lesions) data as an input
data without significant modification, resulting in only a mod- without categorization, and we developed a DL model that
114 http://j-stroke.org https://doi.org/10.5853/jos.2021.02061Vol. 24 / No. 1 / January 2022 could estimate not only the total AQ score (continuous vari- to estimate aphasia severity in many patients undergoing able), but also the sub-domain scores of language function. acute intervention may further raise the applicability of our DL The resulting performance is noteworthy. The DL model could technique in real-world practice. estimate the categorized AQ score with moderate agreement In the present study, the DL model used a skip connection (κ=0.59) and continuous AQ score with strong correlation instead of a plain network (i.e., concatenated outputs of the (r=0.72, P
Jeong et al.    Deep Learning Model to Predict Aphasia Severity

tenuated inversion recovery and susceptibility-weighted imag-               2012;43:1429-1431.
ing sequences show underlying old ischemic or hemorrhagic              4.   Charidimou A, Kasselimis D, Varkanitsa M, Selai C, Potagas C,
lesions; perfusion MRI demonstrates the penumbra that may                   Evdokimidis I. Why is it difficult to predict language impair-
predict the final infarction territory; and diffusion tensor trac-          ment and outcome in patients with aphasia after stroke? J
tography could predict the integrity of fasciculi of language               Clin Neurol 2014;10:75-83.
domains. However, including only a simple MRI sequence may             5.   Pedersen PM, Jørgensen HS, Nakayama H, Raaschou HO, Ol-
have enhanced the clinical utility of our DL model. Neverthe-               sen TS. Aphasia in acute stroke: incidence, determinants, and
less, future studies to evaluate the usefulness of multiple MRI             recovery. Ann Neurol 1995;38:659-666.
sequences in estimating the severity of aphasia are warranted.         6.   Nouwens F, de Jong-Hagelstein M, De Lau LM, Dippel DW,
                                                                            Koudstaal PJ, van de Sandt-Koenderman WM, et al. Severity
Conclusions                                                                 of aphasia and recovery after treatment in patients with
                                                                            stroke. Aphasiology 2014;28:1168-1177.
Our study suggests that the DL model using DWI data may be             7.   El Hachioui H, Lingsma HF, van de Sandt-Koenderman MW,
feasible and useful in estimating the severity of aphasia in pa-            Dippel DW, Koudstaal PJ, Visch-Brink EG. Long-term progno-
tients with acute stroke at an early stage. These findings war-             sis of aphasia after stroke. J Neurol Neurosurg Psychiatry
rant further research to evaluate the applicability of DL model             2013;84:310-315.
in different study populations.                                        8.   Nouwens F, Visch-Brink EG, El Hachioui H, Lingsma HF, van
                                                                            de Sandt-Koenderman MW, Dippel DWJ, et al. Validation of
Supplementary materials                                                     a prediction model for long-term outcome of aphasia after
                                                                            stroke. BMC Neurol 2018;18:170.
Supplementary materials related to this article can be found           9.   Payabvash S, Kamalian S, Fung S, Wang Y, Passanese J, Kama-
online at https://doi.org/10.5853/jos.2021.02061.                           lian S, et al. Predicting language improvement in acute stroke
                                                                            patients presenting with aphasia: a multivariate logistic mod-
Disclosure                                                                  el using location-weighted atlas-based analysis of admission
                                                                            CT perfusion scans. AJNR Am J Neuroradiol 2010;31:1661-
Yong-Hwan Kim was employed by company Nunaps Inc.                           1668.
  The remaining authors declare that the research was con-            10.   Lee EJ, Kim YH, Kim N, Kang DW. Deep into the brain: artifi-
ducted in the absence of any commercial or financial relation-              cial intelligence in stroke imaging. J Stroke 2017;19:277-285.
ships that could be construed as a potential conflict of interest.    11.   Lee H, Lee EJ, Ham S, Lee HB, Lee JS, Kwon SU, et al. Ma-
                                                                            chine learning approach to identify stroke within 4.5 hours.
Acknowledgments                                                             Stroke 2020;51:860-866.
                                                                      12.   Kassner A, Thornhill RE. Texture analysis: a review of neuro-
This research was supported by grants from the Korea Health                 logic MR imaging applications. AJNR Am J Neuroradiol
Technology R&D Project through the Korea Health Industry De-                2010;31:809-816.
velopment Institute (KHIDI), funded by the Ministry of Health         13.   Wernick MN, Yang Y, Brankov JG, Yourganov G, Strother SC.
& Welfare (HI18C2383) and the Ministry of Science and ICT                   Machine learning in medical imaging. IEEE Signal Process
(NRF-2018M3A9E8066249), Republic of Korea.                                  Mag 2010;27:25-38.
                                                                      14.   Kim H, Na DL. Normative data on the Korean version of the
References                                                                  Western Aphasia Battery. J Clin Exp Neuropsychol 2004;26:
                                                                            1011-1020.
  1. Benjamin EJ, Muntner P, Alonso A, Bittencourt MS, Callaway       15.   Brott T, Adams HP Jr, Olinger CP, Marler JR, Barsan WG, Biller
     CW, Carson AP, et al. Heart disease and stroke statistics-2019         J, et al. Measurements of acute cerebral infarction: a clinical
     update: a report from the American Heart Association. Cir-             examination scale. Stroke 1989;20:864-870.
     culation 2019;139:e56-e528.                                      16.   Forsting M, Janen O. MR Neuroimaging: Brain, Spine, Periph-
  2. Ellis C, Dismuke C, Edwards KK. Longitudinal trends in aphasia         eral Nerves. New York, NY: Thieme, 2017.
     in the United States. NeuroRehabilitation 2010;27:327-333.       17.   Kim BJ, Kim YH, Kim N, Kwon SU, Kim SJ, Kim JS, et al. Le-
  3. Ellis C, Simpson AN, Bonilha H, Mauldin PD, Simpson KN. The            sion location-based prediction of visual field improvement
     one-year attributable cost of poststroke aphasia. Stroke               after cerebral infarction. PLoS One 2015;10:e0143882.

116    http://j-stroke.org                                                                               https://doi.org/10.5853/jos.2021.02061
Vol. 24 / No. 1 / January 2022
18. Plowman E, Hentz B, Ellis C Jr. Post-stroke aphasia prognosis: Med 2017;53:249-255.
a review of patient-related and stroke-related factors. J Eval 29. Blom-Smink MR, van de Sandt-Koenderman MW, Lingsma HF,
Clin Pract 2012;18:689-694. Heijenbrok-Kal MH, Ribbers GM. Predicting everyday verbal
19. Srivastava N, Hinton G, Krizhevsky A, Sutskever I, Salakhutdi- communicative ability after inpatient stroke rehabilitation in
nov R. Dropout: a simple way to prevent neural networks patients with moderate and severe aphasia at admission: vali-
from overfitting. J Mach Learn Res 2014;15:1929-1958. dation of a prognostic model. Eur J Phys Rehabil Med 2019;55:
20. Raita Y, Goto T, Faridi MK, Brown DF, Camargo CA Jr, Hase- 532-534.
gawa K. Emergency department triage prediction of clinical 30. Godecke E, Rai T, Ciccone N, Armstrong E, Granger A, Hankey
outcomes using machine learning models. Crit Care 2019;23 GJ. Amount of therapy matters in very early aphasia rehabili-
:64. tation after stroke: a clinical prognostic model. Semin Speech
21. Chung MK. Statistical and Computational Methods in Brain Lang 2013;34:129-141.
Image Analysis. Boca Raton, FL: CRC Press, 2013. 31. Liu X, Gao K, Liu B, Pan C, Liang K, Yan L, et al. Advances in
22. Martinez-Martin P, Radicati FG, Rodriguez Blazquez C, Wet- deep learning-based medical image analysis. Health Data Sci
more J, Kovacs N, Ray Chaudhuri K, et al. Extensive valida- 2021;2021:8786793.
tion study of the Parkinson’s disease composite scale. Eur J 32. Das JM, Saadabadi A. Abulia. In: StatPearls. Treasure Island,
Neurol 2019;26:1281-1288. FL: StatPearls Publishing, 2019. https://www.ncbi.nlm.nih.
23. Kertesz A. Western Aphasia Battery-Revised (WAB-R): Exam- gov/books/NBK537093. Assessed December 1, 2021.
iner’s Manual. San Antonio, TX: PsychCorp, 2006. 33. Siegel JS, Snyder AZ, Metcalf NV, Fucetola RP, Hacker CD,
24. Andersen R. Modern Methods for Robust Regression. Los An- Shimony JS, et al. The circuitry of abulia: insights from func-
geles, CA: Sage Publications, 2007. tional connectivity MRI. Neuroimage Clin 2014;6:320-326.
25. Watila MM, Balarabe SA. Factors predicting post-stroke 34. Labeyrie MA, Turc G, Hess A, Hervo P, Mas JL, Meder JF, et al.
aphasia recovery. J Neurol Sci 2015;352:12-18. Diffusion lesion reversal after thrombolysis: a MR correlate of
26. Laska AC, Hellblom A, Murray V, Kahan T, Von Arbin M. Apha- early neurological improvement. Stroke 2012;43:2986-2991.
sia in acute stroke and relation to outcome. J Intern Med 2001; 35. He K, Zhang X, Ren S, Sun J. Deep residual learning for image
249:413-422. recognition. Proceedings of the 2016 IEEE Conference on
27. Lazar RM, Minzer B, Antoniello D, Festa JR, Krakauer JW, Computer Vision and Pattern Recognition (CVPR); 2016 Jun
Marshall RS. Improvement in aphasia scores after stroke is 27-30; Las Vegas, NV. IEEE; 2016;770-778. https://www.com-
well predicted by initial severity. Stroke 2010;41:1485-1488. puter.org/csdl/proceedings-article/cvpr/2016/8851a770/12Om-
28. Glize B, Villain M, Richert L, Vellay M, de Gabory I, Mazaux NxvwoXv. Assessed December 1, 2021.
JM, et al. Language features in the acute phase of poststroke 36. Srivastava RK, Greff K, Schmidhuber J. Highway networks.
severe aphasia could predict the outcome. Eur J Phys Rehabil arXiv 2015 Nov 3. https://arxiv.org/abs/1505.00387.
https://doi.org/10.5853/jos.2021.02061 http://j-stroke.org 117Vol. 24 / No. 1 / January 2022
Supplementary Table 1. Performance of logistic regression and deep learning methods depending on input features in the training set
Performance in training set* (n=127) AQ score Spontaneous speech Comprehension Repetition Naming
Logistic regression with LASSO
Clinical feature only (6 features) 0.74 0.70 0.72 0.71 0.74
Imaging feature only (178 features) 0.79 0.82 0.75 0.79 0.76
Clinical+imaging features 0.84 0.75 0.82 0.84 0.80
Deep feed forward network
Clinical+imaging features 0.86 0.88 0.84 0.88 0.85
AQ, aphasia quotient; LASSO, least absolute shrinkage and selection operator.
*Performance was calculated using the correlation coefficients between the actual and predicted Korean version of the Western Aphasia Battery (K-WAB)
scores.
Supplementary Table 2. Performance of logistic regression and deep learning methods depending on the input features in the test set
49 Performance in test set* (n=49) AQ score Spontaneous speech Comprehension Repetition Naming
Logistic regression with LASSO
Clinical feature only (6 features) 0.70 0.61 0.70 0.62 0.66
Imaging feature only (178 features) 0.54 0.64 0.54 0.53 0.50
Clinical+imaging features 0.63 0.67 0.65 0.59 0.59
Deep feed forward network
Clinical+imaging features 0.72 0.75 0.71 0.65 0.71
AQ, aphasia quotient; LASSO, least absolute shrinkage and selection operator.
*Performance was calculated in the correlation coefficients between actual and predicted Korean version of the Western Aphasia Battery (K-WAB) scores.
Supplementary Table 3. Contingency table between the true and model-predicted scores in patients who underwent acute intervention
True score
Total
Very severe Severe Moderate Mild
Model-predicted score
Very severe 11 4 1 1 17
Severe 1 1 3 0 5
Moderate 0 0 2 2 4
Mild 0 2 1 7 10
Total 12 7 7 10 36
Accuracy 11/12 (92) 1/7 (14) 2/7 (29) 7/10 (70) 21/36 (58)
Values are presented as number (%). Cohen’s weighted kappa, κ=0.60 (95% confidence interval, 0.41 to 0.78; PJeong et al. Deep Learning Model to Predict Aphasia Severity
Input 1st Hidden Output
Score
(184) (90) (1)
Fully-connected
Hyper-tangent activation with range [-1 to 1]
2nd Hidden
Hyper-tangent activation with range [0 to 1]
(30)
Drop-out 50% node
Supplementary Figure 1. Structure of the deep learning (DL) model. The number of nodes in each layer was noted in the box. For the input layer, 178 lesion
occupying ratio features (left hemisphere associated regions from various atlases) and six clinical features (age, sex, Korean version of the Western Aphasia
Battery [K-WAB] evaluation days from magnetic resonance imaging [MRI], MRI hours from onset, education years, and lesion volume) were used. Using the
DL model, the final score was predicted to range from 0 to 1. The true score of the K-WAB was fed into the model by normalizing scores in the range of 0 to 1.
Spontaneous speech Comprehension
20 10
16 8
12 6
Predicted score
Predicted score
8 4
4 2
0 0
0 4 8 12 16 20 0 2 4 6 8 10
Measured score A Measured score B
Repetition Naming
10 10
8 8
Predicted score
Predicted score
6 6
4 4
2 2
0 0
0 2 4 6 8 10 0 2 4 6 8 10
Measured score C Measured score D
Supplementary Figure 2. Correlation analysis of sub-scores of aphasia quotient in the test set. (A) The correlation coefficient of spontaneous speech was
0.75 (95% confidence interval [CI], 0.59 to 0.85; PVol. 24 / No. 1 / January 2022
AQ score of revascularization group
100
80
Predicted score
60
40
20
0
0 20 40 60 80 100
Measured score
Supplementary Figure 3. Correlation analysis between true aphasia quotient (AQ) score and model-predicted AQ score of stroke patients undergone acute
intervention. The correlation coefficient was 0.73 (95% confidence interval, 0.53 to 0.85; PYou can also read