Detection of grey regions in color images : application to the segmentation of a surgical instrument in robotized laparoscopy
←
→
Page content transcription
If your browser does not render page correctly, please read the page content below
Detection of grey regions in color images :
       application to the segmentation of a surgical
           instrument in robotized laparoscopy
                           Christophe Doignon, Florent Nageotte and Michel De Mathelin
                                    LSIIT (UMR CNRS 7005), University of Strasbourg
                                         ENSPS, Bd. Brant, 67400 Illkirch, France
                             email: {christophe.doignon,florent.nageotte,...}@ensps.u-strasbg.fr

   Abstract— In this paper, the detection and localization of     surgical opening and then it reduces the recovery time
grey regions in color images is addressed. This work has          for the patient but in counterpart, it involves a large
been developed in the scope of the robotized laparoscopic         number of repetitive gestures, such as the cleaning-suction
surgery, specifically for surgical procedures occuring inside
the abdominal cavity. Since very few works have been already      process, clamping, cauterization, needle manipulation
published about that purpose, some existing algorithms have       and it requires more ability and much training from the
been selected and brought together to achieve a robust color      surgeon. Moreover, motions of instrument are constrained
segmentation, as fast as possible. The foreseen application is    to by the insertion point in the abdominal wall which
a good training ground to evaluate these algorithms since         reduces the mobility since only four degrees of freedom
main difficulties came from the complexity of the scene,
the moving background due to breathing motion, the high           are available (however, in minimally invasive surgery,
surface reflectance, the non-uniform and time-varying lighting    extensive range of articulations referred as endowrist have
conditions. Nevertheless, to achieve the image segmentation       been recently designed at the tip of some laparoscopic
suitable for robot control, we propose a new approach,            instruments).
without markers, based on a recursive thresholding of the         Our research in this field aims at expanding the
histogram of a new purity color attribute and region growing.
The main contribution of this work is threefold and consists      potentialities of such systems by using visual servoing
in:                                                               techniques to realize semi-autonomous tasks. Therefore, in
   • the definition of a new color purity component,              order to assist the surgeon, we have conceived two years
   • a selection of reliable, fast and robust existing video      ago a system that automatically brings the instrument at
     processings for the above-mentioned application areas,       the center of the endoscopic image [10]. It included the
   • improving some existing video processings to enhance
                                                                  design of a special device to hold the surgical instrument
     color properties either to homogeneize regions and to
     emphasize the saturation feature of chromatic pixels.
                                                                  with tiny laser pointers and optical markers. The laser
                                                                  pointing instrument holder projected spots onto the organ
The usefulness of the proposed set of sequential processings
has been successfully validated with image sequences of an        surface which in turn were captured by a camera whereas
endoscope to efficiently extracting boundaries of a cylindrical   optical markers (composed of three circular LEDs) were
needle-holder with a sampling rate of 5 Hz.                       directly projected onto the image and in conjunction with
                                                                  images of the laser pattern, they were used to recover the
                                                                  depth between the organ and the instrument.
                     I. I NTRODUCTION
   Today, numerous vision systems are available as                There exist several obstacles to carry out a visual servoing
commercial products in various applications fields such           scheme for laparoscopic environment. The first one is
as quality-control, medical supervision, cinematography,          the unknown relative position between the camera and
arts, security, video surveillance,... Among them, one can        the robot arm holding the instrument. Other difficulties
observe since few years the increase of artificial vision         are coming from the environment perception, like the
applications to surgery, in particular to intra-operative         complexity of the observed scene, the time-varying lighting
guidance procedures. On the one hand, computer vision             conditions and a moving background (due to breathing
techniques brings a lot of improvements and gain in               and heart beating). Prior researchs requiring color images
reliability in the use of visual informations, and on the         have been conducted and visual servoing techniques have
other hand, medical robots provide a significant help in          been applied to the laparoscopic surgery. Casals et al. [4]
surgery, particularly for the minimally invasive surgery,         employed patterned marks on the instrument mounted on
as it is for the laparoscopic surgery. The main drawback          an industrial robot to realize an instrument tracking task.
of this surgical technique is the posture of the surgeon          Projections of marks were approximated by straight lines
which is very tiring. Robotic laparoscopic systems have           in the image segmentation process. This guidance system
recently appeared and are designed to reduce the surgeon’s        worked at a sampling rate of 5 Hz with the aid of an
tiredness and to increase the accuracy. Minimally invasive        assistant. Hirzinger et al. [21] used a color stereovision
surgery is a very attractive technique since it avoids            system to realize a tracking task with the endoscope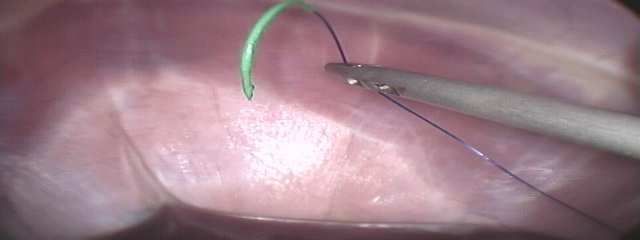
video signal
mounted on a robotic arm. By means of a color histogram
they selected the color with the lowest value in the
histogram to mark the instrument. This spectral mark was                                color image frame capture
then utilized to control the robot motion at a sampling rate                                                digitized image
of 15 Hz. An interesting feature of this technique is the
                                                                                          purity color extraction
choice of HSV color space for the segmentation, leading
to a good robustness with respect to lighting variations.                                                  modified saturation S’

                                                                                                sigma filtering
One can notice that all previous applications require           grey regions                               modified saturation S’
special markers and color images but are confined to a
                                                                segmentation
simple navigation inside the abdominal cavity. To help                                    histogram computation
                                                                                               and smoothing
the surgeon, more ambitious tasks must be investigated.
New proposed tasks may require interactions with tissues                                                    histogram of S’

and more autonomy. Autonomous needle manipulation is                                       iterative thresholding
one such hard problem for which we wish to contribute                                                      regions with low color purity
through some subtasks like needle catching and stitching,
with the use of robot vision. Furthermore, since surgical                                     regions growing
instruments must be autoclavable before the surgical                                                       segmented grey regions
operation and since several instruments may alternatively
                                                                                              regions selection
be used through a trochar (depending on the subtask
addressed), it seems irrealistic to always keep some                                                       region of interest

markers placed on the instrument. The objective of this
paper is to provide a robust segmentation of laparoscopic                                  erosion            dilation
instruments boundaries without additional landmarks and          application                      −          +
as fast as possible in order to be integrated as a module
of an image guidance procedure. The development of                                                         region boundaries of interest

reliable segmentation of color endocopic images as part                                       Edges detection
of a vision-driven endoscopy system is a challenging
                                                                                                           edges
task as declared in [2]. In laparoscopic surgery, most of
surgical instruments are metallic leading to projected grey
regions and also unsuitable high surface reflectance in               Fig. 1.   Flow diagram of the proposed segmentation.
the image. To deal with these phenomena, we propose
a segmentation scheme which consists in a relevant
selection and some improvements of reliable, fast and          we deal with color images, it’s suitable to analyze the
robust existing algorithms.                                    multispectral aspect of the information to identify regions
                                                               of interest. Most of earlier works in the field of data
The outline of the paper is the following. In the next         classification involved techniques mainly based on Markov
section, low-level processings emphasizing the color           Random Fields (MRF-based energy minimization), mul-
saturation component are described. This section also          tiresolution scheme or Genetic Algorithms (GA) which
includes an efficient region smoothing algorithm. The          are not (yet) suitable for real-time imaging [12]. In this
region-based segmentation by means of the color purity         paper, we do not intend to present another robust color
attribute is explained in section three. Throughout this       segmentation but rather we focused that work on the
paper, experimental results are presented with color           extraction of boundaries of (nearly) uniformly grey regions
images of a moving endoscope and endoscopic views of           in the image. Following this purpose, we develop the idea
a needle-holder in presence of living tissues. The last        that the color saturation is the most discriminant attribute
section concludes this article and introduces future work.     for grey regions segmentation despite that the purity of
                                                               color can be affected by surface reflectance [17].
                                                               Many color image processings such as enhancement and
  II.   SATURATION COLOR FEATURE EXTRACTION AND                restoration require that only the luminance component to
                    ENHANCEMENT                                be processed whereas some other applications require hue
   A fundamental requirement of reliable vision systems        or saturation components to be preserved or modified.
is the ability to extract from digital images visual cues      Saturation component is a relevant cue for the detection
relevant to the observed scene. Contour-based segmenta-        of grey regions in the image, since a low saturation value
tion, region-based segmentation, classification and curve      indicates a low colored pixel and a high value corresponds
parametrization are some important steps for representing      to a purely colored pixel [14]. It’s a measure of the
visual data in a structural form. For applications involving   amount of white within the color. It’s well-known that
robots, image segmentation as well as classification and       coordinate systems related to the human visual system’s
recognition must be fully automatized. Moreover, since         perceptual attributes (luminance, hue and saturation - LHS
Fig. 2. Endoscopic images of a surgical laparoscopic instrument (needle-holder and the needle). (left) original color image - (right) color image with
the modified saturation attribute S 0 instead of S.
for short) are more suitable for processing color images Compared to the original definition of the saturation
than RGB since chromaticity components (H and S) are attribute in (1), S 0 rather affects more high values than
decoupled from that of luminance L [22] and that RGB low values which tends to separate more chromatic pixels
space brings a non-uniform chromaticity scale. This is from achromatic ones. The counterpart is that this new
inappropriate when most segmentation techniques need a attribute is a little bit more sensitive to brightness changes
similarity measure to discriminate two colors. Luminance, but mainly for chromatic pixels. The motivation underlying
L, is the color brightness and is defined by a linear the definition of a new purity attribute is to discriminate
relationship (L = 0.299R +0.587G+0.114B) [7] whereas more grey-pixels from colored ones. For instance, with
the color saturation is related with the RGB by: the following attribute values (R, G, B) = (3, 6, 3), the
saturation S = 1/4 whereas S 0 = 1/2 for this rather
min{R, G, B}
S =1−3 (1) green pixel. The original saturation value is identical to
R+G+B the one computed with some much more grey pixels,
This latter definition clearly shows that pixels may have such as with (R, G, B) = (3, 4, 5) but not S 0 which has a
the same saturation whatever are their color or brigthness. lower value (S 0 = 2/5). The effect of this new attribute is
illustrated in figures 2 and 3. To display the right image
A. A modified saturation color component in figure 2, a color transformation from RGB to LHS
There exist other definitions for the saturation signal coordinate system is carried out. S’ is computed with the
like the radius of the chromaticity circle perpendicular to formula (2). Then, a color transformation from LHS to
the luminance axis, as it is for the YIQ color coordinates RGB is performed with S’ instead of S. One can observe
system. Transformations to other perceptually based spaces that the purity of color is emphasized. To validate this
such as CIE Lab and CIE Luv need much computation time aspect, a simulation with a serie of random pixels has
and do not provide discriminating cues more significant. been done. The accumulation of the mean values for S
With the objective of detecting grey regions in the image, and S 0 are reported in figure 3(left). One can see that
it should be relevant to look for a more discriminant visual the new attribute which reflects the color purity is more
cue in order to better classify chromatic pixels. discriminant than the original one. In figure 3(right) (the
With the purpose of highlighting this aspect, we propose horizontal cross-section of images on the top, at middle
to define the purity of a color with a slightly modification height), one can observe that the difference |S 0 − S| is
of the saturation as follow: more significant for high values than for low values. In
min{R, G, B} the sequel, this new attribute will be utilized for further
S0 = 1 − (2) video processings.
max{R, G, B}
The region of interest is assumed to be grey and will be
0.45
saturation S
180
unmodified saturation
modified saturation
referred as the foreground. It could not be assumed to be
modified saturation S‘
the only grey region in the whole image since other parts
0.4 160
140
of image can also contained many pixels with a grey distri-
0.35
0.3 120
0.25 100 bution. This is mainly due to the presence of high surface
0.2 80
reflectance or hue discontinuities (as illustrated with the
0.15 60
0.1 40
0.05 20
0 0
0 100 200 300 400 500 600 700 800 900 1000 0 100 200 300 400 500 600 700
Fig. 3. (left) Comparison between saturation and modified saturation
mean values over 1000 random color pixels. This figure shows that S’
is 21 % higher than S in average. (right) Comparison between saturation
and modified saturation values (S and S’) for an horizontal line at middle
height of images in figure 2. Color purity value (scaled from 0 to
255) is enhanced for chromatic pixels whereas it is preserved for nearly
achromatic ones.
Fig. 4. Modified saturation S’ for color image in figure 2.3000 3000
color transitions occuring at the needle boundaries) leading saturation
modified saturation
saturation
modified saturation
(sigma filtering)
to low color purity values (see figure 4). Pixels can also
2500 2500
be categorized as achomatic if the brightness is very high. 2000 2000
So, pixels that fall into this category (for intensity values 1500 1500
greater than 90 % of full scale as suggested by Ikonomakis 1000 1000
[9]) are labeled as ”meaningless”. 500 500
0 0
0 50 100 150 200 250 300 0 50 100 150 200 250 300
Fig. 7. (left) Histograms of the saturation (blue) and modified saturation
(red) distributions - (right) idem but proceed once the sigma filter is
applied. The homogeneous effect within a class of pixels is significant.
Fig. 5. (left) Color image of an endoscopic lens with high reflectance
inside the grey region. (right) Color purity image with the apply of the
sigma filter (w = 6). Many pixels are ”meaningless” and do not contribute
to the building of the color purity histogram. trade-off for either smoothing pixel values inside regions
and either preserving the properties of the extracted edges
that will be used for further processings. With the sigma
B. A fast and shape-preserved edges filtering
filter, a pixel can be averaged with its neighbours that are
Noise cleaning is commonly used as one of the first close in value. Lee suggests looking to all values in the
operations applied on digitized image. Non linear filtering neighborhood of a given pixel f (u, v) and averaging f only
allows to detect lack of spatial coherence and either replace with those values that are within the two-sigma interval of
the incoherent pixel value by using some or all pixels in a f . If N (u, v) is the (2w + 1) × (2w + 1) neighborhood
neighborhood. Such low-level processing is crucial to keep around pixel f (u, v), then the estimate f˜ is computed by
away an oversegmentation result since this phenomenum 8 X
is very awkward for pixels classification. The uniformity < 1
nc
f (u, v) if nc ≥ 0.09 card{N }
of objects plays a significant role in separating objects f˜(u, v) = (m,n)∈Nc
:
each others, usually in separating the objects from the f (u, v) otherwise
(3)
background and topological properties of edges should
Nc = {(m, n) ∈ N (u, v) : |f (u, v) − f (m, n)| ≤ 2σ} and
be equally preserved. A comparative study of some non
nc = card{N }. If fewer than 9/100 of the pixels (also
linear filters performances is given by Seeman et al. [20].
suggested by Lee) in N (u, v) are close in value to the
The apply of anisotropic diffusion to computer vision
pixel of interest, the pixel value is left unchanged; such
received a great attention to achieve the above mentioned
pixel is presumably a region-boundary pixel. Compared
two-fold purposes. This technique encourages smoothing to the well-known median filter, the sigma filter is more
within a region whereas region boundaries remain sharp
efficient for smoothing areas since the median filter is
[16]. Although a geometry-driven approach is elegant and
much more dedicated to peak noise cleaning rather than
powerful, it suffers from a cumbersome consuming time,
gaussian noise cleaning. For instance, a comparison of the
and in practice it is not (yet) suitable as a part of a visual
apply of anisotropic diffusion and the sigma filter to the
servoing scheme for robotics motion control. The sigma
purity color image is shown in figure 6. One can observe
filter proposed by Lee ( [11], [8]) is a good computational
that homogeneization and edges structure preservation
are very similar whereas the computing time is greatly
reduced with the sigma filter.
III. G REY REGIONS DETECTION
Histogram thresholding is probably the most widely used
technique for gray level image segmentation. The threshold
is derived from the image histogram and many thresholding
methods have been proposed with this support. Among
them, global methods which determine a threshold from
the information of the entire image [19], yield relatively
acceptable results for the partitioning of pixels into classes.
One of these methods, the Otsu’s method (a 25 years
old technique) is a global non-parametric thresholding
method which provides satisfactory results in presence of
bimodal histograms [15]. The Otsu’s threshold is chosen
Fig. 6. (top) Results with anisotropic diffusion (an efficient Matlab as the one that maximizes the quantity η = σB 2
/σT2
implementation due to Perona et al.) applied to the color purity image
(30 iterations, K=10, λ = 0.25, computational time is about 4 s) - (down)
with σB the between-group variance (a measure of group
2
Results with the sigma filter applied to the color purity attribute (σ = 8, separability) and with σT2 the total variance. An efficient
w = 6, computational time is about 80 ms for the whole image). implementation has been proposed by Reddi et al. [18] for2000 2000 2000
modified saturation (sigma filtering) modified saturation (sigma filtering) modified saturation (sigma filtering)
1800 eta (x100) 1800 eta (x100) 1800 eta (x100)
threshold (first iteration) threshold (second iteration) threshold (the third iteration)
1600 1600 1600
1400 1400 1400
1200 1200 1200
1000 1000 1000
800 800 800
600 600 600
400 400 400
200 200 200
0 0 0
0 50 100 150 200 250 0 50 100 150 200 250 0 50 100 150 200 250
Fig. 8. The separability factor η(t) (×100, in blue) and the threshold values (black stars) found: (η max = 0.82, τ1 = 99) for the first iteration
(left), (ηmax = 0.79, τ2 = 56) for the second iteration (middle), (ηmax = 0.65, τ3 = 34) for the third iteration (right), all proceed on image on
figure 6. The maximum value of η(t) is corresponding to the location of the threshold.
the computation of the threshold. The histogram of this values (black star) are displayed with the smoothed color
attribute is computed using (2) over the entire image and purity histogram (σ = 2) and in figure 9 (top), the binary
it represents a probability distribution of the color purity image indicates whether corresponding pixels lies in the
levels. To obtain reliable peaks and valleys, a Gaussian segmented region or not.
smoothing filter is applied on the histogram prior to the
thresholding, thus removing unreliable peaks and valleys. B. Region growing and fast edges detection
Due to the presence of specularities and non-uniform
A. Recursive thresholding
lighting distribution, small regions are also detected in the
To achieve the pixels partitioning, we employ the tech- image, labeled with the same class. Moreover, in practice,
nique proposed in [5] which extends the Otsu’s method to the accuracy of the color purity attribute computation
multimodal histograms. The threshold operation is regarded depends on the brightness value. Nevertheless, a minor
as the partitioning of the pixels into two classes C0 = region removal algorithm is performed to clean the image
{0, 1, 2, ..., t} and C1 = {t + 1, ..., sm − 1} (sm is the ( [3], page 43) and a fast region growing algorithm [1]
number of grey levels). Thus, the optimal threshold t? can is carried out (with a seed location chosen inside the
be determined by maximizing the following criterion segmented region provided that region boundaries are close
t? = arg max (σB
2
/σT2 ) (4) to the image boundaries - a constraint which always occurs
t in laparoscopic vision) and the resulting segmentation is
The quantity η = σB 2
/σT2 is called the separability factor shown in figure 9 (bottom). In practice, the region of
in [5] and is used to drive the algorithm. It indicates interest is chosen among those previously detected as
the likelihood of separating the class when considering follow: the region of interest is the one with the lowest
the color purity distribution. The higher η is, the more number of contour boundaries at image boundaries
the separability is. We apply this algorithm and adapt ρ=
total number of contour boundaries
it to reduce the search for next threshold only towards
value. Therefore, to extract contour boundaries of a cylin-
the lowest values. The process of histogramming, peak
drical instrument, region boundaries are seen as a starting
selections, and thresholding is recursively repeated until no
point to delineate a new region of interest (bounded by a
new peaks is found, or regions become too small. In figure
lower and a upper area of interest computed with basic
8, (from left to right), separability factors and threshold
morphological operations, see figure 10 (top)) and mapped
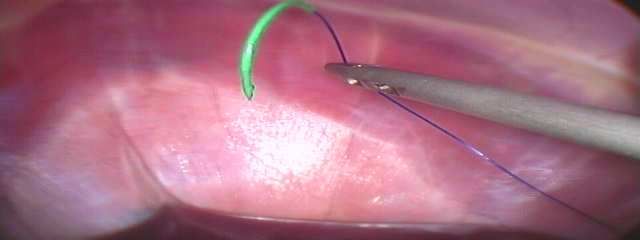
Fig. 9. (top) The detected regions with the recursive thresholding process Fig. 10. (top) Region of interest (in black) for the apply of an edge
(τ3 = 34). - (bottom) The result of region growing for the four regions detector on the color image. - (bottom) Detected and classified edges
(in white, green, red and blue) in the top and close to image boundaries. (accounting for a pair of lines fitting) superimposed with the image.to the original color image. The color edges detection [6] ACKNOWLEDGMENT
as well as the Hough transform are performed for pixels The financial support of the french ministry of research
inside that region (which acts as a binary mask) in order to is gratefully acknowledged. The experimental part of this
locate the pair of straight lines which fit the outer contours work has been made possible thanks to the collaboration of
of the imaged cylinder (see figure 10 (bottom)). This kind Computer Motion Inc. and also the ”Institut de Recherche
of geometric feature strongly constrains the 3-D point of contre les Cancers de l’Appareil Digestif”. In particular,
view. Thus, it’s a salient feature for object localisation, we would like to thank Prof. Marescaux, Leroy and Soler
particularly for the pose of a cylinder. However, in some for their advices, as well as for the use of their facilities.
circumstances, it is not well located, particularly when
high reflectance of the metallic surface occurs for a very R EFERENCES
significant part of the grey region as it is in figure 5. In table [1] R. Adams and L. Bischof. Seeded region growing. IEEE Transac-
I, we summarize computing times for the segmentation tions on PAMI, 16(6):641–647, June 1994.
[2] L. Ascari, U. Bertocchi, C. Laschi, C. Stefanini, Antonina Starita,
implemented with C language on a Pentium IV 2.6 GHz. and P. Dario. A segmentation algorithm for a robotic micro-
endoscope for exploration of the spinal cord. In Proceedings of
TABLE I the IEEE International Conference on Robotics and Automation,
C OMPUTING TIMES FOR GREY REGIONS SEGMENTATION WITH COLOR pages 491–496, New Orleans, LA, April 2000.
[3] A. Bovik. Handbook of Image and Video Processing. Acad. Press.
IMAGES OF SIZES (640 × 240).
[4] A. Casals, J. Amat, D. Prats, and E. Laporte. Vision guided robotic
system for laparoscopic surgery. In Proc. of the IFAC Int. Congress
on Advanced Robotics, pages 33–36, Barcelona, Spain, 1995.
Video processings Computing time (ms) [5] M. Cheriet, J. N. Said, and C. Y. Suen. A recursive thresholding
de-interlacing 1.2 technique for image segmentation. IEEE Transactions on Image
high-intensity pixel classification 3.5 up to 12 Processing, 7(6), June 1998.
[6] J. Fan, D. K. Y. Yau, A. K. Elmagarmid, and W. G. Aref. Automatic
purity color computation 7 image segmentation by integrating color-edges extraction and seeded
sigma filtering (w = 6) 80 region growing. IEEE Trans. on Image Processing, 10(10), 2001.
histogram computation and smoothing 0.7 [7] R. C. Gonzalez and R. E. Woods. Digital Image Processing.
Addison-Wesley MA, 1992.
iterative image thresholding (3 iterations) 0.4 [8] R.M. Haralick and L. G. Shapiro. Computer and Robot Vision,
region growing (only for grey regions) 11.3 up to 18 volume 1. Addison-Wesley Publishing, 1992.
erosion and dilation (2 iterations) 6.1 [9] N. Ikonomakis, K. Plataniotis, and A. N. Venetsanopoulos. A
region-based color image segmentation scheme. In in Proceedings
edge detection (region of interest) 7.2 up to 8.9 of Electrical Imaging, volume 3653 of SPIE (San Jose, California),
Hough transform 4 pages 1202–1209, January 1999.
robust line fitting 8 up to 21 [10] A. Krupa, J. Gangloff, C. Doignon, M. de Mathelin, G. Morel,
J. Leroy, L. Soler, and J. Marescaux. Autonomous 3-d positioning of
Total up to 159.3 surgical instruments in robotized laparoscopic surgery using visual
servoing. IEEE Trans. on Robotics and Automation, Oct. 2003.
[11] J.S. Lee. Digital image smoothing and the sigma filter. Computer
Vision, Graphics, and Image Processing, 24:255–269, 1983.
[12] J. Liu and Y.-H. Yang. Multiresolution color image segmentation.
IV. C ONCLUSION AND FUTURE WORK
IEEE Transactions on PAMI, 16(7):689–700, July 1994.
We have presented preliminary results for a fast [13] F. Nageotte, M. de Mathelin, C. Doignon, L. Soler, J. leroy, and
J.Marescaux. Computer-aided suturing in laparoscopic surgery. In
color segmentation of grey regions. This work has been Medical Robotics, Navigation and Visualization, RheinAhrCampus
developed with a view to locating surgical instruments Remagen, Germany, March 11-12 2004.
as well as endoscopes in a robotized laparoscopic [14] Y. Ohta, T. Kanade, and T. Sakai. Color information for region
segmentation. CVGIP, 13:222–241, 1980.
environment. Handling unconstrained environments [15] N. Otsu. A threshold selection method from gray-level histograms.
with computer vision is often difficult because the IEEE Trans. on Systems, Man and Cybernetics, 9(1):62–66, 1979.
existing techniques are specialized and do not develop [16] P. Perona, T. Shiota, and J. Malik. Anisotropic diffusion. In
Geometry-driven diffusion in Computer Vision, pages 73–92. Kluwer
the necessary transformation steps of visual data to a Academic Publisher, 1994.
high enough degree. With this paper, we do not intend [17] P. Pujas and M. Aldon. Robust colour image segmentation. In In
to present new theorytical contribution in the field of 7th International Conference on Advanced Robotics (ICAR’95), San
Filiu de Guixols, Spain, September 1995.
robot vision, but rather we have selected and improved [18] S.S. Reddi, S.F. Rudin, and H.R. Keshavan. An optimal multiple
some fast video processings which work well despite threshold scheme for image segmentation. IEEE Transactions on
the moving background (due to breathing motion), the System, Man and Cybernetics, 14(4):661–665, July 1984.
[19] P. K. Sahoo, S. Soltani, and K. C. Wong. Survey : A survey of
high reflectance of organs and instruments surfaces, the thresholding techniques. CVGIP, 41:233–260, 1988.
non-uniform and time-varying lighting conditions. An [20] T. Seeman and P. Tischer. Structure preserving noise filtering
extension of this work would consist in considering a of images using explicit local segmentation. In Proceedings of
the International Conference on Pattern Recognition, Brisbane,
pyramidal representation of the image and a tracking Australia, 16-20 August 1998.
software to speed up the proposed segmentation over the [21] G.-Q. Wei, K. Arbter, and G. Hirzinger. Automatic tracking of
video sequence. It is also one step toward a computer- laparoscopic instruments by color-coding. In Springer Verlag, editor,
Proc. First Int. Joint Conf. CRVMed-MRCAS’97, pages 357–366,
aided suturing system currently in progress [13] and Grenoble, France, March 1997.
which requires, among other things, the 3-D localization [22] C. C. Yang and J. J. Rodriguez. Efficient luminance and saturation
of the insertion point and the guidance of the needle-holder. processing techniques for color images. Journal of Visual Commu-
nication and Image Representation, 3(3):263–277, September 1997.You can also read