Development of smart boulders to monitor mass movements via the Internet of Things: a pilot study in Nepal
←
→
Page content transcription
If your browser does not render page correctly, please read the page content below

Earth Surf. Dynam., 9, 295–315, 2021
https://doi.org/10.5194/esurf-9-295-2021
© Author(s) 2021. This work is distributed under
the Creative Commons Attribution 4.0 License.

              Development of smart boulders to monitor mass
                  movements via the Internet of Things:
                          a pilot study in Nepal
              Benedetta Dini1 , Georgina L. Bennett2 , Aldina M. A. Franco1 , Michael R. Z. Whitworth3 ,
                             Kristen L. Cook4 , Andreas Senn5 , and John M. Reynolds6
           1 School   of Environmental Sciences, University of East Anglia, Norwich Research Park, Norwich, UK
                         2 College of Life and Environmental Sciences, University of Exeter, Exeter, UK
                                                    3 AECOM, Plymouth, UK
                                      4 Helmholtz Centre, GFZ-Potsdam, Potsdam, Germany
                                               5 Miromico AG, Zurich, Switzerland
                                             6 Reynolds International Ltd, Mold, UK

                                    Correspondence: Benedetta Dini (b.dini@uea.ac.uk)

                                 Received: 24 September 2020 – Discussion started: 8 October 2020
                           Revised: 27 January 2021 – Accepted: 2 March 2021 – Published: 15 April 2021

      Abstract. Boulder movement can be observed not only in rockfall activity, but also in association with other
      landslide types such as rockslides, soil slides in colluvium originating from previous rockslides, and debris
      flows. Large boulders pose a direct threat to life and key infrastructure in terms of amplifying landslide and flood
      hazards as they move from the slopes to the river network. Despite the hazard they pose, boulders have not been
      directly targeted as a mean to detect landslide movement or used in dedicated early warning systems. We use
      an innovative monitoring system to observe boulder movement occurring in different geomorphological settings
      before reaching the river system. Our study focuses on an area in the upper Bhote Koshi catchment northeast
      of Kathmandu, where the Araniko highway is subjected to periodic landsliding and floods during the monsoons
      and was heavily affected by coseismic landslides during the 2015 Gorkha earthquake. In the area, damage by
      boulders to properties, roads, and other key infrastructure, such as hydropower plants, is observed every year.
      We embedded trackers in 23 boulders spread between a landslide body and two debris flow channels before the
      monsoon season of 2019. The trackers, equipped with accelerometers, can detect small angular changes in the
      orientation of boulders and large forces acting on them. The data can be transmitted in real time via a long-range
      wide-area network (LoRaWAN® ) gateway to a server. Nine of the tagged boulders registered patterns in the
      accelerometer data compatible with downslope movements. Of these, six lying within the landslide body show
      small angular changes, indicating a reactivation during the rainfall period and a movement of the landslide mass.
      Three boulders located in a debris flow channel show sharp changes in orientation, likely corresponding to larger
      free movements and sudden rotations. This study highlights the fact that this innovative, cost-effective technology
      can be used to monitor boulders in hazard-prone sites by identifying the onset of potentially hazardous movement
      in real time and may thus establish the basis for early warning systems, particularly in developing countries where
      expensive hazard mitigation strategies may be unfeasible.

Published by Copernicus Publications on behalf of the European Geosciences Union.
296                    B. Dini et al.: Development of smart boulders to monitor mass movements via the Internet of Things

1   Introduction                                                    widely used and documented to remotely monitor surface
                                                                    displacements of active landslides (e.g. Glueer et al., 2019).
Landslides that affect and originate from mountainous               On one hand, traditional techniques tend to be cheaper, but
bedrock hillslopes often contain boulders, which are large          they only allow the retrieval of point-like information and can
fragments with a diameter of > 0.25 m up to several metres.         pose challenges for installation. On the other hand, advanced
Boulders may have a significant influence on the fluvial net-       techniques such as GB-InSAR allow for more continuous
work in terms of landscape evolution, a topic receiving in-         coverage but involve much higher costs related to both equip-
creased attention in the recent literature (e.g. Shobe et al.,      ment and data processing, and they cannot easily deliver in-
2020; Bennett et al., 2016a). However, the presence in vary-        formation in real time, even if recent research has shown
ing proportions of large grain sizes within a landslide mass        the use of radar techniques to deliver real-time data aimed
can also significantly influence its destructive power and af-      at rockfall hazard mitigation (Wahlen et al., 2020). Wire-
fect recovery operations. Large boulders can instantaneously        less technologies are desirable due to unfavourable terrain
destroy properties and infrastructure, and, critically, they can    conditions in which landslide monitoring is often needed.
block lifelines for considerable periods of time, as they are       In this respect, passive radio-frequency (RFID) techniques
the most difficult component of a deposit to remove (e.g.           have recently been used to monitor landslide displacements,
Serna and Panzar, 2018). Boulders can lie on hillslopes for         and they have been shown to be inexpensive and versatile
a long time (e.g. Collins and Jibson, 2015) before being re-        (Le Breton et al., 2019). Although this type of technique has
mobilised as a consequence of trigger events, such as intense       not yet been used in early warning systems, it is contended
rainfall and earthquakes, which may lead to hazard cascade          that the adaptability of such technology could be developed
chains involving boulder transport. In time, boulders have the      in this context. The main advantage is their low cost, their
potential to move from hillslopes and to enter debris flow          wireless nature, and also the ability of the sensors to work
channels and eventually rivers, posing a hazard along the           in the presence of adverse environmental factors that would
way. Among the far-reaching effects of boulder movements,           impair other techniques such as GPS and total stations (e.g.
damage to hydropower dams can have significant knock-on             fog, snow, dense vegetation). However, passive RFID tags
effects on local economies (e.g. Reynolds, 2018a, b, c).            currently allow for a monitoring distance (distance between
   The direct and accurate monitoring of boulder movement,          the tags and the receiving gateway) of a few tens of metres
also in relation to environmental variables, is essential in        only, which is disadvantageous when monitoring large unsta-
order to achieve a better understanding of the implications         ble slopes or different geomorphic settings in the same area
of their presence on hillslopes in active landscapes, the dy-       at the same time. None of the techniques mentioned above,
namics of their remobilisation, and their eventual entrain-         however, have been used to monitor boulder movement, and
ment in river systems. In this context, boulder tracking and        most of them would not be suitable for this purpose (perhaps
real-time monitoring represent an important step forward to-        with the exception of passive RFID); thus, they have limited
wards increased resilience in hazard-prone areas and could          potential in capturing the amplification of landslide hazards
be performed in different geomorphological settings rang-           posed by the presence of large boulders.
ing from landslide bodies, to loose slope deposits, to debris          Monitoring the movement of sediments within floods has
flow channels and rivers, depending on the specific needs           also received much attention in the literature. For exam-
and aims. The ability to produce alerts for either hazardous        ple, bedload transport can be monitored with environmen-
boulder movements, or to use the movement of boulders to            tal seismology in order to detect the seismic noise generated
identify hazardous reactivations of existing large instabili-       by moving particles (Burtin et al., 2011; Tsai et al., 2012).
ties, requires a careful choice of monitoring techniques that       Whilst this is useful in order to identify flood events or even
work in difficult and different environments, that are prefer-      debris flow events in nearby tributaries, it is also unsuitable
ably wireless, and that can reliably send information in real       for individual boulder monitoring. Passive radio sensor tech-
time. Whilst various early warning systems have been exper-         nology has been used to monitor the movement of individual
imented with and put in place for landslides and debris flows,      grains in rivers (e.g. Bennett and Ryan, 2018; Nathan Bradley
no early warning system has been used to detect and monitor         and Tucker, 2012); however, this technique only allows the
large boulders, thus improving resilience with respect to the       quantification of total transport distances between succes-
additional hazards they pose.                                       sive surveys, and no real-time data transmission has yet been
   Several techniques exist to monitor landslide movements          achieved in this context. Several studies in coastal settings
that are also used in the context of real-time extraction of dis-   have tracked individual boulders with extensive field surveys
placements. For example, early warning systems have been            (e.g. Cox, 2020; Naylor et al., 2016), giving insights into
based on traditional techniques such as topographic bench-          boulder dynamics. Similar efforts to track boulders in fluvial
marks or extensometers, often in combination with more ad-          settings are underway (e.g. Carr et al., 2018). However, such
vanced techniques such as ground-based radar interferome-           efforts are very time-demanding and are also not suited for
try (GB-InSAR) (e.g. Intrieri et al., 2012; Loew et al., 2017).     real-time detection of boulder movement.
Geodetic techniques based on GPS or total stations are also

Earth Surf. Dynam., 9, 295–315, 2021                                                  https://doi.org/10.5194/esurf-9-295-2021
B. Dini et al.: Development of smart boulders to monitor mass movements via the Internet of Things                              297

   Recently, the use of IMUs (inertial measurement units) has        been used to tag different animals in order to extract infor-
been tested for different applications in the field of geomor-       mation on migratory, nesting, and feeding behaviours among
phology (e.g. Caviezel et al., 2018, and references therein;         other things (e.g. Soriano-Redondo et al., 2020; Panicker et
Frank et al., 2014; Akeila et al., 2010). In particular, de-         al., 2019; Flack et al., 2018; Kano et al., 2018; Gilbert et
vices able to capture boulder or pebble accelerations and ro-        al., 2016). Whilst some trackers store the data internally and
tations have been tested in different set-ups in man-made en-        transmit them to a server via GSM when a network becomes
vironments. Gronz et al. (2016) used devices equipped with           available, the trackers used for this study have been devel-
a triaxial accelerometer, a triaxial gyroscope, and a magne-         oped to allow for a network of nodes that communicate wire-
tometer embedded within pebbles to reconstruct the path and          lessly and in real time through an Internet of Things (IoT)
movement of individual particles in a laboratory flume with          system (e.g. Panicker et al., 2019) that works with a gateway
the aid of a high-speed camera. Such devices, able to capture        installed locally. In an IoT system, the nodes of the network
accelerations up to 4 g at 10 Hz, send data via an 868 MHz           communicate to the gateway over radio frequencies and with-
radio gateway from which it is then either forwarded to a            out the need for human intervention. The gateway can then be
wireless router or directly downloaded to a computer via an          directly connected to a computer, or, crucially, it can transmit
Ethernet cable. Induced rockfall field experiments were car-         the data via a GSM network to a server in real time.
ried out in the Swiss Alps by Caviezel et al. (2018) in order           Transferring this type of technology to boulder monitoring
to test the applicability of IMUs to accurately measure boul-        brings several advantages in comparison to other monitoring
der accelerations and rotations for the calibration of rockfall      systems. The devices in this work can be used to monitor sev-
models. The devices used in the latter study have a high sam-        eral boulders at the same time and in different geomorpho-
pling frequency (1 kHz) and an acceleration detection range          logical settings within a large study area thanks to the longer
up to 400 g; the data are stored on a micro-SD card and then         range achievable by the system in comparison to, for exam-
downloaded via cable onto a computer. However, the life-             ple, RFID techniques. This means the potential to monitor
time of these sensors is limited by battery life (1 to 56 h, de-     different hazards (e.g. landslides, debris flows) and different
pending on the setting type), hence requiring development            hazardous sites in the same area, allowing for a comprehen-
to monitor naturally occurring processes in field set-ups that       sive, simultaneous overview of hazard development affect-
rarely and unpredictably occur.                                      ing a community and its infrastructure. This also implies the
   In this study, we aim to fill a gap in the available literature   monitoring of several sites within reach of only one antenna,
regarding the monitoring of individual boulders in real time         making the technology cost-effective and providing the po-
and in different geomorphological settings in the field. In the      tential to monitor areas well upstream of settlements. More-
context of the possible future development of an early warn-         over, our long-range wireless devices are low-power, can be
ing system, the priority of this pilot study is heavily focused      directly activated by movement, and have real-time commu-
on capturing the activation of boulder movement in real time,        nication. These are key features of our devices and network,
rather than on the accuracy and precision of the measurement         since this potentially enables us to (1) develop an early warn-
itself and resolving the full movement, with the last two re-        ing system for hazardous events that involve the presence of
quiring further development. We explore how displacements            boulders, with movement information delivered in real time
or even subtle orientation changes of boulders lying within          and as movement unfolds, (2) monitor during prolonged peri-
a large, slow-moving, and potentially deep-seated landslide          ods without battery replacement (e.g. one full monsoon sea-
body can be used to identify landslide reactivation and evo-         son), and (3) unravel landslide evolution and mechanics, pro-
lution of the activity levels of different sectors through time.     vided a dense enough network over a particular site, thus al-
We contend that this ability may allow researchers to inves-         lowing for better evaluation of possible evolution scenarios
tigate landslide dynamics, geometries, and failure modes in          as movement occurs.
future developments and with denser networks. Additionally,             In this study, based in the upper Bhote Koshi catchment
we explore how rapid boulder movement within active tribu-           (red square in inset in Fig. 1), Nepal, we demonstrate the use
tary channels could indicate events such as debris flows, and        of long-range wireless devices to detect hazardous boulder
their monitoring could help identify the forcing thresholds          movement and landslide reactivation in real time. We also
required for remobilisation of different grain sizes in the fu-      demonstrate for the first time the use of this technology in
ture. As mentioned above, technologies that can work in real         the field of geomorphology and in a field set-up to monitor
time and wirelessly are better suited for this purpose. For this     the movement of boulders embedded within a landslide and
reason, in this work, we explore the transfer of a technol-          in two debris flow channels.
ogy developed in the field of ecology to the monitoring of
boulders in slow-moving landslides and debris flows. Wire-
less devices equipped with a GPS module and an accelerom-
eter originally developed for animal tracking are modified
and adapted for the purpose of boulder tracking and monitor-
ing. GPS trackers in combination with accelerometers have

https://doi.org/10.5194/esurf-9-295-2021                                                  Earth Surf. Dynam., 9, 295–315, 2021
298                    B. Dini et al.: Development of smart boulders to monitor mass movements via the Internet of Things

Figure 1. Overview of study area and network, including three tagged sites (two debris flow channels and a landslide body). Red box:
zoom of two tagged sites. Yellow boxes: terrestrial laser scanner areas. Orange box: field view of the field camera. Image: Pleiades (CEOS
Landslides Pilot).

2     Study area                                                       slides (Roback et al., 2018; Guo et al., 2017; Tanoli et al.,
                                                                       2017; Kargel et al., 2016; Collins and Jibson, 2015). The
2.1    Hazards and their interactions in the area of study             areal distribution of landslides away from the main shock
                                                                       epicentre appears to have been controlled by a combination
Nepal lies at the heart of the Himalayan arc, and it is one            of peak ground acceleration, slope, and fault rupture propa-
of the most disaster-prone countries in the world. In particu-         gation (Roback et al., 2018; Martha et al., 2017; Regmi et al.,
lar, the extreme topographic gradients, seismicity, and mon-           2016). Some authors pointed out that many coseismic land-
soonal climate, coupled with increased population pressure             slides occurred at high elevations (e.g. Tanoli et al., 2017),
(Whitworth et al., 2020), make Nepal widely and frequently             and it was observed that after the earthquake, a large num-
affected by landslides and various types of floods. In 2015            ber of landslides remained disconnected from the channels,
a large number of coseismic landslides were triggered as a             with significant amounts of material stored on the hillslopes
consequence of the Gorkha earthquake sequence, in particu-             (Cook et al., 2016; Collins and Jibson, 2015), including boul-
lar in association with the largest M 7.8 Gorkha earthquake            ders that are still visible today on valley flanks. During the
(25 April 2015) and M 7.3 Dolakha earthquake (12 May                   2015 monsoon, new landslides were triggered along with
2015). Several authors mapped coseismic landslides after the           the expansion of coseismic landslides, but loose material re-
events and, although numbers vary greatly (a few thousand              mained stored on the hillslopes by the end of the monsoon
to a few tens of thousands of landslides mapped in differ-             (Cook et al., 2016). The sediments produced with coseis-
ent studies), the impact of these hazards has been unani-              mic landslides are expected to move from the hillslopes and
mously recognised as very significant (Reynolds, 2018b, c;             into the fluvial system over several years after the earthquake
Roback et al., 2018; Martha et al., 2017; Kargel et al., 2016).        (Collins and Jibson, 2015, and references therein).
The Bhote Koshi catchment, northeast of Kathmandu (red                    The Bhote Koshi is also highly prone to glacial lake out-
square in inset in Fig. 1), was also identified as one of the          burst floods (GLOFs), with six events reported since 1935
most affected areas, showing the greatest density of land-             (Khanal et al., 2015). Different authors have mapped glacial

Earth Surf. Dynam., 9, 295–315, 2021                                                       https://doi.org/10.5194/esurf-9-295-2021
B. Dini et al.: Development of smart boulders to monitor mass movements via the Internet of Things                           299

lakes within the Bhote Koshi catchment in recent years, with        in low-order stream channels within the region (Roback et
the total number ranging between 74 and 122 (Khanal et al.,         al., 2018), thus allowing for movement of some smaller
2015; Liu et al., 2020), making glacial lake density in this        boulders (> 0.25 m diameter) and allowing hillslope–channel
catchment 4 times higher than that of the central Himalaya          coupling.
(Liu et al., 2020). All available studies are in agreement re-
garding the recent increase in the total area of glacial lakes in   2.2   Geologic and tectonic setting
the region in relation to increasing temperatures and glacial
retreat (Liu et al., 2020), with some authors suggesting that       Our study sites lie within the Main Central Thrust (MCT)
this increase amounts to 47 % and that some lakes doubled           zone (Rai et al., 2017), where the rocks of the Higher Hi-
in size between 1981 and 2001 (Khanal et al., 2015). Some           malaya Sequence (HHS) are thrusted over rocks of the Lesser
of these lakes have the potential to drain catastrophically,        Himalaya Sequence (LHS). The MCT is one of the main
with some authors indicating that this risk may increase in         faults that accommodate the subduction of the Indian subcon-
the future as glacial lakes increase in number and volume.          tinent under the Eurasian Plate. The MCT has been mapped
Floods originating from the outburst of glacial lakes can have      at the top and bottom of the roughly 350 m thick Hadi Khola
short-lived discharges that are several orders of magnitude         Schist that is sandwiched between the Dhad Khola Gneiss
higher than background discharges in receiving rivers (Cook         above and the Robang Phyllite below at Tatopani, some 5 km
et al., 2018) and can have impacts for many tens of kilome-         upstream of the study site (DMG, 2005, 2006; Rai, 2011;
tres downstream (Richardson and Reynolds, 2000; Huber et            Reynolds, 2018c). The study site lies entirely within the Be-
al., 2020; Liu et al., 2020; Khanal et al., 2015). The latest       nighat Slate, which comprises predominantly black schist,
one in the Bhote Koshi catchment occurred in July 2016,             phyllite, quartzite, and carbonate rocks (DMG, 2005, 2006;
likely originating from a rain-induced debris flow into Gong-       Rai, 2011). The rocks belonging to the HHS are composed
batongshacuo Lake, a moraine-dammed lake in Tibet (Au-              of crystalline amphibolite- to granulite-facies metamorphic
tonomous Region of China) (Cook et al., 2018; Reynolds,             rocks, mainly ortho- and paragneisses, quartzite, and schists.
2018a) that drained catastrophically, impacting infrastructure      The LHS rocks present lower-grade metamorphism, increas-
and properties up to 40 km downstream. Boulders up to 8 m           ing towards the MCT, and are largely comprised of phyllites,
long, weighing in excess of 150 t, jammed the sluice gates          schists, metasandstones, and quartzites (Basnet and Panthi,
of the Bhote Koshi hydropower project, diverting the debris-        2019; Martha et al., 2017; Rai et al., 2017; Upreti, 1999;
charged flash flood through, totally destroying the desilting       Gansser, 1964).
basin, and inducing substantial damage to the site (Reynolds,
2018b). During the remedial works for the reconstruction of         2.3   Economic assets in the study area – increased
the headworks infrastructure, a boulder with a 17 m diame-                vulnerability
ter (approximately 4500 t) was uncovered adjacent to the up-
stream wall of the headworks dam. This complex event has            Our study sites are located along the Araniko highway, a ma-
highlighted the need for improved ways of understanding the         jor route that connects Kathmandu to Kodari and then links
interactions of cascading hydro-geomorphic processes and            Nepal to China. This main road was significantly affected
improved measures aimed at increasing resilience (Reynolds,         by earthquake-induced landslides in 2015, but it is also sub-
2018a, c). The availability of loose material on hillslopes, the    jected to landslides every year during the monsoon season
monsoonal climate, and the GLOF hazard in the area enhance          (e.g. Whitworth et al., 2020). The area is of strategic impor-
the possibility of material containing large grain sizes reach-     tance for Nepal due to the high concentration of hydropower
ing the river network via hillslope movements and eventually        projects either already in operation or under construction
being remobilised by exceptionally large floods. Huber et           (Khanal et al., 2015). Moreover, the Araniko highway is a
al. (2020) highlight the fact that very large boulders (around      key trade and transport link (Liu et al., 2020) and one of the
10 m in diameter) present today in the Bhote Koshi river have       two routes between China and Nepal. Khanal et al. (2015)
likely been transported by large GLOF events, supporting the        indicate that international trade and tourism between Nepal
idea that it is unlikely that monsoon-generated floods may          and China have been growing rapidly since the opening of
have the energy threshold required to remobilise very large         the Araniko highway and that this route is economically im-
grain sizes (Cook et al., 2018).                                    portant; the records of the customs office in Nepal show a
   Landslides and debris flows can also occur as a conse-           value of USD 135.9 million in imports and USD 4.1 million
quence of heavy and persistent rainfall during the monsoon.         in exports in 2011–2012, with both governments benefiting
Every year the area receives up to 4100 mm of rainfall be-          from the revenue.
tween June and September (Tanoli et al., 2017). Active mon-
soons can trigger or reactivate landslides; an example is the       2.4   Selected sites
Jure landslide (roughly 15 km southwest of our study sites)
that occurred in August 2014 (Acharya et al., 2016). More-          The study site is located at the northern edge of an inferred
over, intense monsoon rainfall events can trigger debris flows      deep-seated gravitational slope deformation around 1.5 km

https://doi.org/10.5194/esurf-9-295-2021                                                Earth Surf. Dynam., 9, 295–315, 2021

300                   B. Dini et al.: Development of smart boulders to monitor mass movements via the Internet of Things

wide that stretches from Hindi in the north to just upstream       and the sensor. After placement, each hole was filled with
of Chakhu to the south (Reynolds, 2018c). A secondary land-        epoxy resin, sealing the cavity and thus protecting the device
slide body on the northwest-facing valley flank directly im-       from tampering and from the elements (water and humidity),
pinging the settlement of Hindi and two debris flow channels       whilst allowing for unaffected connectivity to the gateway
were chosen as tagging sites (Fig. 1). The most active de-         via LoRaWAN® . To ease the drilling process but also to al-
bris flow channel of the two marks the northeastern bound-         low the epoxy to stay in the cavity before being completely
ary of the landslide, whilst the other channel, which appears      cured, the holes were drilled at an almost vertical angle (with
to be less active, is located 360 m to the northeast directly      respect to the global inertial frame), so roughly from the top
upstream of the densest part of the settlement of Hindi. Both      down. This allowed for the emplacement of the devices flat
channels intersect the Araniko highway and cross the settle-       against the battery inside the cavity, with the z axis nearly
ment before merging with the Bhote Koshi. The landslide is         horizontal (global inertial frame), where x and y are oriented
a soil slide covering an area of approximately 0.03 km2 . Col-     as the two longest sides of the device. There is some vari-
luvium material likely deposited from previous landslides is       ability around the deviation from the global horizontal orien-
visible at the head scarp and in the terraces along the south-     tation of the z axes of all our devices, but in general terms the
western flank, with the presence of large boulders of diam-        position of the device would follow such a set-up. The orien-
eter > 2 m. Large boulders are also observed scattered over        tation of the z axis with respect to the cardinal points was not
the landslide body. The scarp suggests a depth of the land-        recorded.
slide of at least 2 m, and large, fresh cracks were observed          The position of the gateway, located in the opposite side
in the crown area in October 2019, indicating activity during      of the valley at a distance of about 700 m from the furthest
the previous monsoon season.                                       sensor, at 1330 m a.s.l. and roughly 60 m above the valley
                                                                   bottom was chosen to be within reach of the GSM network
                                                                   and have a direct line of sight with the sensors (Figs. 1 and
3     Methodology
                                                                   2e). Due to an unreliable main power supply, a four-panel
3.1    Network set-up and components
                                                                   solar system was developed for this purpose. The initial set-
                                                                   up did not allow for continuous power to the gateway and
A total of 23 long-range wireless smart sensors were used          led to instability in the system, with frequent offline times
as nodes in the system. They comply with the LoRaWAN®              during the 2019 monsoon season. However, the system has
(Long-Range Wide-Area Network) specification, are pro-             been improved and it will guarantee continuous power to the
vided with external GPS and long-range antennae, and mea-          gateway for successive acquisition seasons. The panels cur-
sure 23 mm by 13 mm (Fig. 2b),. The sensors are equipped           rently charge two 12 V, 110 AH batteries that then provide
with an accelerometer configured to sample at 2 Hz, and a          continuous power to the gateway through a POE (power over
GPS module. In the absence of movement, the devices are            Ethernet) supply. The solar system is composed of parts that
programmed to record and transmit one single location (GPS         can be sourced locally at a relatively low cost and that can be
data only) per day at a fixed time. When movement is de-           transported to sites without road access, such as the site cho-
tected by the accelerometer so that tilt or acceleration ex-       sen in this study. The nature of the local GSM network, rely-
ceeds defined thresholds, collection of GPS and accelerome-        ing on one individual antenna in the area at the time of this
ter data is activated. Different thresholds can be applied for a   study, also led to frequent GSM connection failures, which
detected angular variation in degrees or for a linear accel-       prevented the gateway from communicating with the server.
eration in g−3 . The values assigned for this study can be         The devices deployed in the 2019 season were programmed
found in Sect. 3.3. The sensors, which were developed by           not to store the data but to send them immediately, causing
Movetech Telemetry and Miromico, transmit the acquired             the data transmitted during gateway offline time to be lost.
data to a LoRaWAN® gateway on the 868 MHz band wire-
lessly and in real time. A Multitech IP67 LoRaWAN® gate-           3.2   Choice of tracked boulders
way sends the payloads received from the sensors to a Loriot
LoRaWAN® network server through the local GSM network              The tagging sites were selected with the aim of covering dif-
using an agnostic SIM card (Fig. 2a–d). The packages are           ferent geomorphological settings whilst retaining visibility to
then sent from Loriot to the Movetech Telemetry server and         the gateway. The boulders identified for tagging are spread
are decoded, providing the raw information collected by the        over three sites, two debris flow channels, and a landslide
nodes.                                                             body (Fig. 1). The boulders cover a range of sizes and ge-
   Each sensor was fitted with one (Fig. 2b) or two lithium        ologies, though the geology in this context is not expected
C-cell batteries connected in parallel. A total of 23 boulders     to play a significant role in affecting the connectivity of the
were individually tagged by embedding the sensors in a hole        network. The smallest boulders tagged have b axes of 0.3 m,
drilled in the rock (Fig. 2c). Each boulder was drilled with a     whilst the largest boulder has a b axis of 3.3 m (Fig. S1 in the
35 mm core drill for a length of about 15 cm. The depth of         Supplement). The selected boulders are characterised by dif-
the hole allowed for the emplacement of the C-cell batteries       ferences in their position at their location. Boulder location

Earth Surf. Dynam., 9, 295–315, 2021                                                  https://doi.org/10.5194/esurf-9-295-2021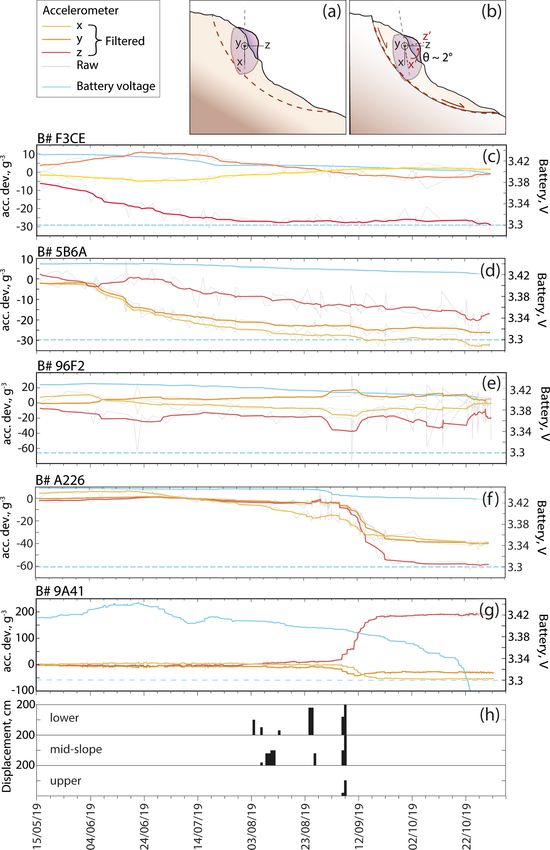
B. Dini et al.: Development of smart boulders to monitor mass movements via the Internet of Things                                    301

Figure 2. (a) Sketch of the network, its components, and communication methods. (b–c) Sensor and tagging of a boulder. (d) Gateway
set-up. (e) Overview of the tagging sites from the gateway. The gateway is visible in the far left of the image. Blue dashed lines mark the
debris flow channels, and red dashed lines mark the boundaries of the landslide.

and embedment influenced the choice of the accelerometer                3.3   Sensor settings
settings used, as explained in the section below. They can be
subdivided into three categories: in channel (IC), partly em-           The sensors were programmed to send a routine message ev-
bedded (PE), and fully embedded (FE) either within the land-            ery 24 h, in which only the GPS position is sent. Between reg-
slide body or in the channel banks (Figs. 3 and S2). Boulders           ular fixes the sensors sleep and do not send any data unless
in the channel are expected to move freely in the case of a             movement occurs, as explained in the following. As men-
large event and to be potentially subjected to collisions. Such         tioned in Sect. 3.1, the sensors can also acquire and send data
events could be debris flows with sufficient intensity to im-           in association with an accelerometer event for which activa-
part forces high enough to cause the boulders to move downs-            tion thresholds can be set for impact forces and for angular
lope within the flow. Fully embedded boulders are not ex-               variations. The sensors can be programmed following two
pected to move independently of the surrounding soil mass;              main modes: (1) the accelerometer data are averaged over a
as such, they can only move as a whole with the material                window of time (over a number of recordings), and we call
on channel banks or with the landslide body if these were               this mode average settings (AVG in Fig. S2). (2) The abso-
to undergo sliding episodes and reactivation (see example               lute value of the maximum acceleration occurring in a time
schematics in Fig. 5a, b). For these boulders, generally only           interval can be recorded, and we call this mode maximum set-
the top part is visible, whilst the bottom is fully surrounded          tings (MAX in Fig. S2). In the first case, the values of the
by soil. On the other hand, partly embedded boulders found              three axes are normalised to g force (where 1 = 1 g), and the
at the head scarp, along the southwestern flank of the land-            measurements essentially represent the static angle of tilt or
slide, or in the channel banks can either move as a whole with          inclination; thus, the projection of the acceleration of gravity,
the surrounding material or become dislodged and begin to               g, on the three axes ranges between 0 (for an axis oriented
move freely on the surface. The second scenario is related to           horizontally with respect to the global inertial frame) and ±1
the little amount of soil covering the bottom part, particularly        (for an axis oriented vertically with respect to the global iner-
in the downslope direction, and this scenario would occur if            tial frame). In the second case, the absolute maximum value
the soil were to be eroded during intense rainfall events.              can be recorded; this can exceed 1 g and can be set as high as
                                                                        2, 4, 8, or 16 g. The measurement resolution changes accord-

https://doi.org/10.5194/esurf-9-295-2021                                                      Earth Surf. Dynam., 9, 295–315, 2021
302                    B. Dini et al.: Development of smart boulders to monitor mass movements via the Internet of Things

Figure 3. (a) Sketch of boulder position types. (b–c) Examples of partly embedded (PE) boulders within the landslide body. (d–f) Examples
of fully embedded (FE) boulders within the landslide body. (g–h) Examples of boulders inside the main channel (IC). (i) Example of a fully
embedded (FE) boulder within the channel bank.

ing to the chosen detectable maximum so that a scale capped            horizontal. Similarly, if the scale is capped at 16 g, a value
at 2 g has a resolution of 0.016 g, whilst a scale capped at           of m = 0.184 g corresponds to an angular variation of about
16 g has a resolution of 0.184 g (Fig. S3).                            10◦ when the axis is nearly vertical, but this increases to as
   When considering only an individual axis, the variation             high as approximately 21◦ when the axis approaches the hor-
between two static accelerometer measurements would cor-               izontal (Fig. S3).
respond to an angular change, as shown in Eq. (1):                        The boulders expected to move as a whole with the soil in
                                                                       which they are embedded, and that are more likely to experi-
γ = arcsin(m/1000) × 180◦ /π,                                  (1)     ence small and gradual angular variations as the surrounding
                                                                       material gently slides, were programmed with the average
where γ is the angular variation on a given axis and m is the
                                                                       settings. We chose to cap accelerometer data for average set-
difference between normalised successive accelerometer val-
                                                                       tings at 2 g (highest resolution), as high-impact forces were
ues recorded on the same axis in g. Eq. (1) describes the re-
                                                                       not expected, and we assigned thresholds for activation to
lationship between accelerometer output on a given axis and
                                                                       accelerometer events of approximately 0.4 g and 5◦ for im-
its tilt: for trigonometry, the projection of the gravity vector
                                                                       pact forces and angular changes, respectively. The sensors in
on an axis produces an acceleration that is equal to the sine
                                                                       the two debris flow channels and some of those only partly
of the angle between that axis and a plane perpendicular to
                                                                       embedded within the landslide were programmed to record
gravity. According to Eq. (1), if the scale is capped at 2 g,
                                                                       high-impact forces using the maximum settings (Fig. S2). In
for m = 0.016 g the corresponding angular variation is ap-
                                                                       this case, the scale was capped at the maximum detectable
proximately 0.9◦ if the axis is vertical (with respect to global
                                                                       force of 16 g (lowest resolution), and the impact and angular
inertial frame) but approximately 5.5◦ if the axis approaches

Earth Surf. Dynam., 9, 295–315, 2021                                                       https://doi.org/10.5194/esurf-9-295-2021
B. Dini et al.: Development of smart boulders to monitor mass movements via the Internet of Things                              303

thresholds were set at approximately 4 g and 5◦ , respectively.     from the actual data (Supplement Sect. S1), to indicate
This angular threshold yielded noisier data with respect to the     the amount of rotation boulders in the channel underwent
sensors programmed with the average setting type because of         (Fig. 6b, d, f). The boulders in the 3D visualisations are, how-
the direct consequence of a drastic reduction in measurement        ever, extrapolated from the context of the channel in which
resolution in the sensors programmed with the maximum set-          they were at the moment of tagging because it is not pos-
ting type (Fig. S3), for which the scale was capped at 16 g.        sible to calculate the yaw angle (i.e. the angular variation
Natural measurement variability and errors associated with          around the global vertical). The purpose of the visualisations
the sensors led to spurious data, given the relatively small an-    is just to give a sense of the change in orientation obtained
gular threshold assigned for the highest detectable maximum         by the boulders between successive accelerometer measure-
of 16 g. In other words, given that the step of accelerome-         ments (Fig. 6a, c, e), and not that of offering a full 3D repre-
ter measurement is as high as 0.184 g, a spurious angular           sentation of boulder movement.
variation of more than 5◦ is often detected even when the              The sensors are equipped with a GPS module, which is
boulder is stable due to intrinsic measurement variability (up      currently also used to retrieve the date and time of the data ac-
to 2 bits). Due to the fact that an angular threshold lower         quisition, whilst the data transmission has another time stamp
than the scale resolution was imposed, we observed many ex-         related to the arrival of the data string to the server. The ac-
tra acquisitions triggered by small variability in accelerom-       celerometer readout in the current version of the software is
eter measurements around a stable value rather than by true         tied to a GPS acquisition; this means that although the ac-
movement.                                                           celerometer is activated as soon as movement is detected, the
   In order to reduce the noise in the data due to these fluc-      recording of the acquisition is obtained only when the GPS
tuations, a three-stage smoothing is applied to the raw data.       has successfully retrieved the position. An acquisition of ac-
First, a moving window covering five successive data points         celerometer data with no GPS position can be obtained and
is used. The median value of the five data points is assigned to    transmitted (in which case it would only be associated with a
all points in the window that lie within ±0.184 g of the data       server time stamp indicating time of arrival at the server), but
point immediately before the window. If any of the values           only after the GPS has attempted to retrieve the position and
lie outside the ±0.184 g threshold, then the raw data points        failed. The time-out for the GPS search has been set to 120 s.
are left unchanged. In the second stage, peaks of one data          This is because, due to the local topographic setting and the
point are removed (i.e. one point above or below two points         high valley flanks, the availability of enough satellites at any
with the same value); this is because if a high-impact force        given time may be low. A major drawback during the 2019
is imparted to a boulder, the position of the boulder is ex-        acquisition campaign was that during the GPS search time,
pected to change. This would mean that a high value would           no accelerometer acquisition could be recorded and trans-
likely be followed by a change in the static angle of tilt of the   mitted in the current firmware version of the devices. This
three axes. Therefore, it is unrealistic to have a peak value       means that if boulder movement unfolds over a few seconds,
followed by a value equal to that observed before the peak,         the likelihood is that the accelerometer recording will only
particularly when sampling at 2 Hz. This would imply that a         occur towards the end of the movement or after it has stopped
boulder undergoes acceleration in one direction, moves, and         completely, allowing only the retrieval of snapshots of infor-
comes to a halt in the same orientation as before the move-         mation on two successive static acquisitions within seconds
ment. In the third and final stage, another moving window           (near-real time) of the movement starting. Development has
of five consecutive data points searches for values that lie        already been made to the firmware to separate the accelerom-
within the ±0.184 g threshold with respect to the last point        eter acquisition from the GPS for future acquisition seasons
immediately before the window. The same value of the last           and increase the velocity of the accelerometer response to a
point before the window is assigned if all points are within        trigger.
the threshold. If any of the points lie outside the ±0.184 g
threshold, the values are left unchanged.                           3.4   Validation data
   After smoothing, time series of actual accelerometer val-
ues were referred to the same zero only for visualisation pur-      A Bushnell NatureView HD camera was installed at the gate-
poses, without further manipulation. The accelerometer x, y,        way location. The camera was set to acquire an image every
and z values were recalculated simply as                            30 min, and the field of view included the landslide and the
                                                                    southwestern debris flow channel to around 35 m below the
xt = xi − x1                                                 (2)
                                                                    Araniko highway. Given the rugged terrain and the line of
for i > 1, where xt is the transformed, plotted value and xi all    sight, the visibility in the area around the southwestern flank
measurements after the first. This allows the graphs shown in       of the landslide is limited and the observation is best for the
Figs. 5 and 6 to be analysed more easily, preventing the y-         lower part of the slope. Moreover, the plane of the landslide
axis scale from being stretched between −1000 and 1000 mg.          is at a relatively low angle with the line of sight of the cam-
   Finally, schematic visualisations of a sample model boul-        era. Image cuts were performed for analysis over the visible
der were produced, calculating pitch and roll angle changes         parts of the southern channel and of the landslide (Fig. 1).

https://doi.org/10.5194/esurf-9-295-2021                                                 Earth Surf. Dynam., 9, 295–315, 2021
304 B. Dini et al.: Development of smart boulders to monitor mass movements via the Internet of Things
Pixels visually recognisable in all image frames were man- sensors programmed with the maximum settings (Fig. S2)
ually selected. These correspond to individual trees or boul- due to the fact that they are partly embedded in the land-
ders and were identified in successive frames. This allowed slide and had potential to become detached from the land-
for a rough estimate (with an accuracy of about 0.2 m) of the slide body. Thus, given the lower accuracy and coarser scale,
displacements of these features in the image plane through they could not have detected small, gradual movements even
the available image sequence. if they had been subjected to them.
Moreover, the landslide body and the southwestern chan-
nel (Fig. 1) were scanned with a Faro Focus 3D X330 ter- 4.1 Slow movements within the landslide body
restrial laser scanner (TLS) in two successive campaigns in
April and in October 2019. Each site was scanned from two The movement recorded by boulders embedded within the
scan locations, and the point clouds were aligned by match- landslide body is consistent with slow, gradual tilting that oc-
ing stable areas using the multi-station adjustment algorithm curred with the sliding of the landslide mass. Small rotational
in Riegl RiSCAN Pro (v. 2.3.1). The data were analysed components of the displacement vector that can either be re-
to obtain ground displacements during the monsoon sea- lated to the whole mass or, most likely, to different sectors
son and processed using the point-to-point cloud comparison of the landslide induce small angular variations to the boul-
method M3C2 in CloudCompare (Lague et al., 2013). The ders embedded within the soil at the surface. Figure 5 shows
field camera and TLS data were used to identify days charac- the accelerometer data for fully and partly embedded boul-
terised by sliding of the landslide body, sliding of the channel ders programmed with the average settings. The graphs in
banks, boulder movements, and areas that underwent signif- Fig. 5c–g show the values recorded by the accelerometers in
icant changes of the ground surface. These data are used in the x, y, and z axes through the observation window. Time is
a qualitative way for comparison with and validation of the shown on the x axis from 15 May to 31 October 2019, whilst
accelerometer data obtained with the wireless devices, and, the y axis indicates the value of the projection of g on each
despite the qualitative approach, these data provided a quite accelerometer axis in milligrams (g−3 ). The grey curves are
detailed overview of the days on which movement occurred. raw data, and the yellow, orange, and red curves are the data
Two Pe6B three-component geophones recording at 200 Hz after noise was removed. The data are actual data recorded
were installed on fluvial terraces below the study site to mon- by the accelerometers, referred to a common zero for visu-
itor debris flow activity in the debris flow channels (Burtin et alisation purposes, as explained in Sect. 3.3 (hence, all raw
al., 2009). data curves begin at zero and the smoothed curves around
zero due to the smoothing). A sketch of the possible type of
movement related to gentle tilting of the boulder within the
4 Results soil mass is shown in Fig. 5a and b and does not represent any
true movement of any of the tagged boulders. The data show
We observed that during the 2019 monsoon season, there that all sensors that detected movement were appropriately
were important sliding episodes of the main landslide body charged throughout the season (blue curves in graphs). The
(see Sect. 4.1), which caused small and gradual tilt of the variations of the accelerometer axis values from the initial
tagged boulders embedded within it. Moreover, although value range from 10 mg to 200 mg in the different sensors.
there is no evidence of large debris flows in either of the For an individual axis, the variation in the values would cor-
channels tagged (for example, in the seismometer records), respond to an angular change as shown in Eq. (1). Thus, for
some boulders within the southern channel bounding the m = 10 mg, γ ∼ = 0.6◦ and γ ∼ = 8◦ for a nearly horizontal and
landslide show data that could indicate rapid movement. Of nearly vertical axis (with respect to the global inertial frame),
the 23 boulders tagged, 9 show accelerometer time series respectively, and for m = 200 mg, γ ∼ = 12◦ and γ ∼ = 37◦ in
that are compatible with downslope movement (yellow to the horizontal and vertical cases. In all boulders the rotation
red symbols in Fig. 4). Of these, six lie within the landslide is oblique with respect to all axes and does not occur around
body and were programmed with the average settings in or- any of them.
der to detect small angular changes (Fig. 5). The remaining The images acquired by the time-lapse camera (see the
three were located within the southern debris flow channel Video supplement) indicate that the landslide moved slowly
and were programmed with the maximum settings to capture at the beginning of the rainy season and then accelerated later
large (> 1 g) impacts (Fig. 6). in the season, most likely in relation to an increase in the pore
In terms of boulder sizes, boulders that appeared to have water pressure within the soil. This temporal evolution is also
moved within the landslide have b axes ranging from 0.4 to observed in our accelerometer data. Moreover, it is likely that
2.75 m, whilst those that moved in the southern channel have the landslide is divided into sectors with different activity
b axes between 0.4 and 0.5 m (Fig. S1), thus covering a much levels and different responses to rainfall through time (e.g.
smaller range. Bonzanigo, 2021). In particular, Figs. 4 and 5 show that the
The four boulders within the landslide that do not show ev- movements of boulders within the landslide not only differ in
idence of movement (white circles in Fig. 4) were fitted with the magnitude of the angular variations recorded, which is an
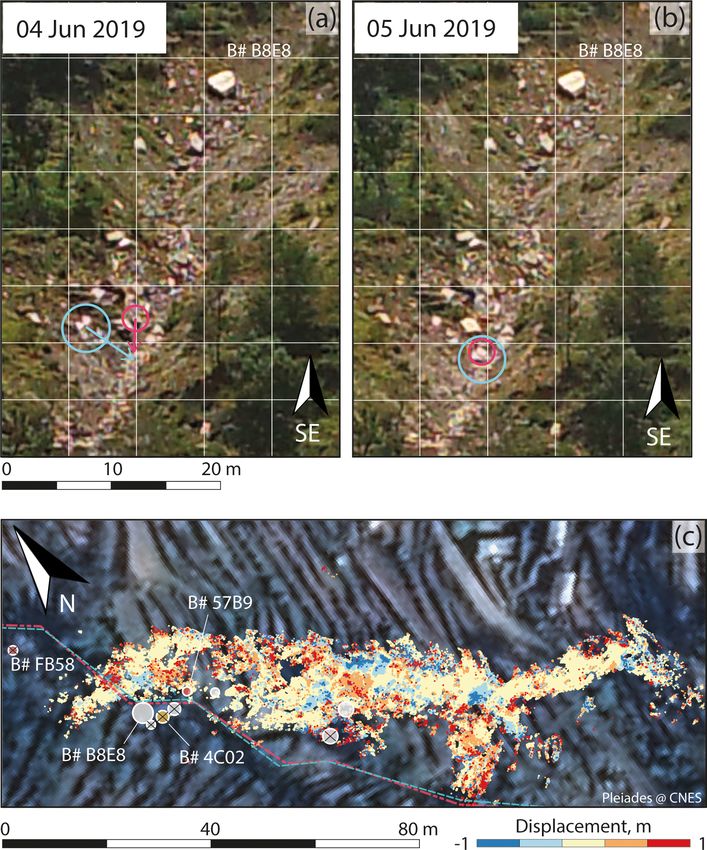
Earth Surf. Dynam., 9, 295–315, 2021 https://doi.org/10.5194/esurf-9-295-2021B. Dini et al.: Development of smart boulders to monitor mass movements via the Internet of Things 305 Figure 4. Zoom of two tagged sites. The sizes are scaled according to the b axis of the boulders (an example of scales is given for boulders without movement in the legend, but it applies to all boulders). White squares are boulders that did not move or for which movement was not recorded. Green circles are boulders in the debris flow channel. Yellow to red symbols are boulders within the landslide body. Hatched areas are zones with observed movement through images (L: lower, M: mid-slope, U: upper) and terrestrial laser scanning. Image: Pleiades (CEOS Landslides Pilot). order of magnitude higher for B-A226 and B-9A41 in com- ble changes occurred is about 5000 m2 and corresponds to parison to other boulders, but also in the evolution with time. the lower portion of the landslide. Figure 5h indicates the Three boulders (B-33EB, not shown in Fig. 5; B-F3CE and estimated movement magnitudes in the image plane for the B-5B6A, the positions of which are also labelled in Fig. S2) lower, middle, and upper parts of the visible sliding area (in- already show movements early in the time series during May dicated by L, M, and U in Fig. 4). Displacements roughly and June. The other three boulders (B-96F2, B-A226, and up to 2 m in the image plane are detected in the lower and B-9A41) show a later onset of the movement between late mid-slope parts of the moving area (Figs. 5h and 7a) be- August and mid-September. The boulders with early move- tween the end of August and the beginning of September, ments are located below the main scarp (B-F3CE) and in the with upper parts showing displacements of around 1 m. The middle part of the landslide (B-33EB and B-5B6A) closer movement observed in the accelerometer data of B-A226 to the channel, whilst those that move later are closer to the and B-9A41 (Fig. 5f–g) corresponds to the periods in which southwestern flank of the landslide (B-9A41 and B-96F2), higher displacement magnitudes are inferred from the im- thus farther away from the channel and in the lower half of ages. Figures 4 and Fig. 7b also show that boulders B-5B6A, the landslide body (B-A226). B-33EB, and B-9A41 are located in areas surrounded by dis- Visual interpretation of the images acquired by the field placements as seen by the TLS data (yellow hatched areas in camera (Sect. 3.4) indicates that significant movements of Fig. 4). Moreover, two boulders within the upper part of the the landslide body occurred during sliding episodes within landslide were not found in the field campaign carried out the orange hatched area in Fig. 4. The area in which visi- in October 2019 (B-33EB and B-625C), likely due to fresh https://doi.org/10.5194/esurf-9-295-2021 Earth Surf. Dynam., 9, 295–315, 2021
306                     B. Dini et al.: Development of smart boulders to monitor mass movements via the Internet of Things

Figure 5. (a–b) Sketch of the possible type of movement experienced by embedded and partly embedded boulders. Note that this is only
a schematic to indicate a movement that occurs in accordance with the landslide body and does not necessarily represent real movement of
the boulders monitored in this study. (c–g) Real accelerometer data (raw and smoothed) showing deviation from the initial position for each
axis for boulders within the landslide body through the monsoon season. The yellow, orange, and red curves in the line plots represent the
smoothed data from the accelerometer x, y, and z axes, respectively, and the grey curves represent the raw data for each axis. The blue curve
shows the battery voltage, and the blue horizontal dashed line represents the 3.3 V threshold below which the battery is discharged and faulty
behaviour may be expected. (h) Estimated displacements of lower, mid-slope, and upper parts of the slope obtained through field camera
images.

Earth Surf. Dynam., 9, 295–315, 2021                                                          https://doi.org/10.5194/esurf-9-295-2021
B. Dini et al.: Development of smart boulders to monitor mass movements via the Internet of Things                                     307

Figure 6. (a, c, e) Real accelerometer data (raw and smoothed) showing deviation from the initial position for each axis for boulders in the
debris flow channel and its banks through the monsoon season. Light green bars represent uncertainty in the movement timing due to lack of
GPS acquisition (i.e. no time recorded) or an offline gateway. (g) Daily and cumulative rainfall data from GPM. Yellow bars represent days
on which movements are observed in the channel and/or on its banks in the field camera images. (b, d, f) Model boulder 3D visualisation
to represent the change from the initial positions of the boulders and the positions acquired after the recorded movement, only in terms of
pitch and roll angles (see Supplement Sect. S1). Note that the boulders are in a space with no coordinates because the visualisations do not
indicate the position of each boulder within the channel, but only the pitch and roll angle changes. Numbers of positions are marked in the
accelerometer graphs.

accumulation of material from the scarp. Indeed, TLS scan               in the scale, 2 bits), associated with measurement variability
data show cumulative displacements of up to 1 m over large              and the coarse scale used (see Sect. 3.3).
areas between April and October 2019 (Fig. 7).                             As an example, in the graph for B-4C02, we observe
                                                                        a change from the initial orientation of the accelerometer
                                                                        within the boulder equivalent to 1000 mg in y and around
4.2   Rapid orientation changes in boulders in the                      700 mg in x and z. This is compatible with a change be-
      southern debris flow channel                                      tween the initial orientation 1 and orientation 2 attained by
Figure 6 shows the accelerometer data obtained for boul-                the boulder by 4 June 2019, as visualised in Fig. 6b. The cur-
ders located within the southern debris flow channel or on              rent settings have not captured how the boulder transitioned
its banks between 15 May and 22 October 2019. The graphs                between position 1 and position 2, likely due to the very short
in Fig. 6a, b, and c contain the same accelerometer informa-            time interval during which the change is expected to have
tion as explained in Sect. 4.1. The difference in the scale of          happened. The GPS acquisition is likely to have taken longer
the accelerometer output with respect to Fig. 5 is explained            than the movement that triggered the recording and delayed
by the different settings. These boulders were programmed               the accelerometer acquisition. This applies to the other two
to retrieve accelerations higher than 1 g (as opposed to nor-           boulders shown in Fig. 6. We do not observe forces > 1 g
malised values) and forces up to 16 g. The raw data (grey               for any of the sensors programmed with the maximum set-
curves) show frequent oscillations, often within ±0.184 g               tings, despite the ability of the sensors to detect up to 16 g.
around a value (corresponding to one step in the accelerome-            This is consistent with a lack of debris flow activity recorded
ter scale, or 1 bit) and occasionally up to ±0.372 g (two steps         by cameras or seismometers, the more prolonged activity of

https://doi.org/10.5194/esurf-9-295-2021                                                       Earth Surf. Dynam., 9, 295–315, 2021
308 B. Dini et al.: Development of smart boulders to monitor mass movements via the Internet of Things
Figure 7. Examples of movements in the landslide body between Figure 8. Example of movements in the debris flow channel be-
panels (a) and (b). Coloured circles visually represent traceable pix- tween panels (a) and (b). Example of movements in the channel
els. Their movement is visible through the superposed grid. The banks and in the channel between panels (c) and (d). Coloured cir-
approximate location of B-A226 is shown. (c) Scan data for the cles represent traceable pixels. Coloured boxes represent areas in
upper part of the landslide area show several zones of movement; which large changes are observed. (e) Scan data for the channel
red represents accumulation and blue erosion. Black crosses repre- showing several zones of movement; blue represents a collapse of
sent boulders that were not found after the monsoon season. Image: parts of the orographic right bank, and red represents accumulation
Pleiades (CEOS Landslides Pilot). areas. Black crosses represent boulders that were not found after the
monsoon season. Image: Pleiades (CEOS Landslides Pilot).
which would have generated sustained boulder movement,
beyond the time needed for GPS acquisition as explained be- that occurred roughly 25 m downstream of the tagging area
low. in early June is shown in Fig. 8a–b, where two boulders can
Figure 6g shows rainfall data (daily and cumulative) from clearly be seen to move downslope from the banks towards
GPM IMERG (Bolvin et al., 2015) in green, while the orange the middle of the channel by 2–5 m. Figure 8c shows the ar-
bars indicate days on which movement (sliding of the banks eas on the northeastern channel bank and the channel bed
and/or individual boulder movement) is observed within the for which significant changes in the ground surface during
channel in the images acquired by the field camera. Often pe- the monsoon season are detected with the TLS data. Here,
riods with movement observations occur after days of moder- erosion exceeding 1 m is observed in the northeastern bank,
ate to intense and/or persistent rainfall. B-4C02 shows move- and accumulation exceeding 1 m is observed in parts of the
ment data recorded by the accelerometer as early as the be- channel bed.
ginning of June. Even though this is early in the monsoon The vertical green bars in the graphs for B-57B9 and B-
season, this movement falls within a few days of moderate FB58 (Fig. 6c and e) show the uncertainty regarding the
rainfall at the beginning of June during which movements timing of the recorded movements. Essentially, each green
in the channel are already visible in the camera’s images. bar indicates a window of time during which the movement
Similarly, B-57B9 and B-FB58 show movement (i.e. changes observed may have occurred. The data for each orientation
in orientation) very close in time to periods for which other change marked by a green bar may have been transmitted at
movements are visible within the channel in the images. Just a different time than the acquisition time, as explained be-
as an example of the several boulder movements observed low. An explanation of the different scenarios that are de-
in the channel in the camera images, a boulder movement scribed below is also given in the flowchart in Fig. 9. The
Earth Surf. Dynam., 9, 295–315, 2021 https://doi.org/10.5194/esurf-9-295-2021You can also read


