Distribution of coccoliths in surface sediments across the Drake Passage and calcification of Emiliania huxleyi morphotypes
←
→
Page content transcription
If your browser does not render page correctly, please read the page content below
Research article
Biogeosciences, 19, 585–612, 2022
https://doi.org/10.5194/bg-19-585-2022
© Author(s) 2022. This work is distributed under
the Creative Commons Attribution 4.0 License.

Distribution of coccoliths in surface sediments across the Drake
Passage and calcification of Emiliania huxleyi morphotypes
Nele Manon Vollmar1 , Karl-Heinz Baumann1 , Mariem Saavedra-Pellitero2 , and Iván Hernández-Almeida3
1 Department  of Geosciences, University of Bremen, P.O. Box 33 04 40, 28334 Bremen, Germany
2 Schoolof Geography, Earth and Environmental Sciences, University of Birmingham, Birmingham B15 2TT, UK
3 Geological Institute, Department of Earth Science, ETH Zurich, Sonneggstrasse 5, 8092, Zurich, Switzerland

Correspondence: Nele Manon Vollmar (nvollmar@uni-bremen.de)

Received: 21 April 2021 – Discussion started: 23 April 2021
Revised: 10 November 2021 – Accepted: 23 November 2021 – Published: 2 February 2022

Abstract. The Southern Ocean is experiencing rapid and          coccoliths via surface and bottom currents and eddies influ-
profound changes in its physical and biogeochemical prop-       ence the (sub-)fossil coccolith assemblages south of the Po-
erties that may influence the distribution and composi-         lar Front. Additionally, deeper samples in the southern part of
tion of pelagic plankton communities. Coccolithophores are      the study area are particularly affected by selective carbonate
the most prolific carbonate-producing phytoplankton group,      dissolution.
playing an important role in Southern Ocean biogeochemi-           We identified five E. huxleyi morphotypes (A, A overcalci-
cal cycles. However, knowledge is scarce about the record       fied, R, B/C and O) and estimated coccolith carbonate masses
of (sub-)fossil coccolith assemblages in the Southern Ocean,    on the basis of scanning electron microscope images. E. hux-
which constitute invaluable indicators for palaeoenvironmen-    leyi morphologies reflect diverging biogeographical distri-
tal reconstructions. This study investigates coccolith assem-   butions, trending towards smaller and lighter coccoliths to
blages preserved in surface sediments of southernmost Chile     the south and emphasizing the importance of documenting
and across the Drake Passage that were retrieved during R/V     those morphologies in relation to changing environmental
Polarstern expedition PS97. We focused on the coccolith re-     conditions to assess their response to projected environmen-
sponse to steep environmental gradients across the frontal      tal change in the Southern Ocean.
system of the Antarctic Circumpolar Current and to hydro-
dynamic and post-depositional processes occurring in this re-
gion. We used statistical analyses to explore which environ-
mental parameters influenced the coccolith assemblages by       1   Introduction
means of cluster and redundancy analyses. We specifically
assessed the morphological diversity of the dominant taxa,      The Southern Ocean (SO) surrounds Antarctica and connects
i.e. Emiliania huxleyi, emphasizing biogeographical variabil-   the Atlantic, Indian and Pacific oceans via the eastward flow-
ity of morphotypes, coccolith sizes and calcite carbonate       ing Antarctic Circumpolar Current (ACC), but it also con-
mass estimations.                                               nects low tropical latitudes with high polar latitudes. It is
   High coccolith abundances and species diversity com-         thus a critical component of the global ocean circulation and
pared to studies in the same area and in other sectors of the   the climate system as well as an important ecozone hosting
Southern Ocean occur, with a high species richness espe-        a broad range of interdependent flora and fauna (Chapman
cially south of the Polar Front. While the surface sediments    et al., 2020). Furthermore, it is a major upwelling region in
offshore Chile and north of the Polar Front provide suitable    which, because of iron and light limitations, primary pro-
material to reconstruct overlying surface ocean conditions,     duction stays comparatively low, resulting in an effective re-
further factors such as temporary thriving coccolithophore      turn of nutrients to the surface waters (Morrison et al., 2014;
communities in the surface waters or transport of settling      Talley et al., 2011; Rintoul, 2018; United Nations, 2016;
                                                                Frölicher et al., 2014).

Published by Copernicus Publications on behalf of the European Geosciences Union.
586                                        N. M. Vollmar et al.: Coccoliths in surface sediments across the Drake Passage

   The SO surface oceanography is characterized by frontal       tive interaction between coccolithophores and diatoms is also
regimes resulting from the existence of different water          of particular relevance in the SO, even though diatoms dom-
masses (Orsi et al., 1995; Chapman et al., 2020). These          inate subantarctic waters in terms of biomass. Nevertheless,
ACC fronts often correspond to jets and divide the SO wa-        small taxa, such as coccolithophores and small or lightly sili-
ter masses into zones of similar properties (Talley et al.,      cified diatoms, are known to dominate the protistan commu-
2011; Palter et al., 2013; Raymond, 2014; Chapman et al.,        nity in terms of numbers in the Subantarctic Zone (SAZ,
2020). The Subtropical Front (STF, Hofmann, 1985) marks          e.g. de Salas et al., 2011), while diatoms dominate in re-
the northernmost extent of subantarctic waters and corre-        gions south of it (e.g. Saavedra-Pellitero and Baumann, 2015;
sponds to the 7 ◦ C isotherm (Park et al., 2019; Sokolov and     Balch et al., 2016; Malinverno et al., 2016; Cárdenas et al.,
Rintoul, 2009; Barré et al., 2011). The STF acts as a bound-     2019; Smith et al., 2017). Models have shown that coccol-
ary to the subtropical, relatively warm and salty water. South   ithophores contribute 16.5 % to the total annual net primary
of the STF, the Subantarctic Front (SAF) marks the south-        production south of 30◦ S, which is 5 % of the global annual
ernmost extent of relatively warm subantarctic surface water,    net primary production (e.g. Nissen et al., 2018). The model
and the Polar Front (PF) constitutes the boundary between        simulation by Nissen et al. (2018) fits well with field obser-
the relatively warmer subantarctic and the cold Antarctic wa-    vations made in the plankton during the last years, which
ters, defined as the northernmost extent of the 2 ◦ C at 200 m   have shown that not only the majority of the species but also
depth, which often coincides with the seasonal maximum of        the number of individuals decrease at the PF and southward
sea-ice extent (e.g. Orsi et al., 1995; Kim and Orsi, 2014;      (e.g. Mohan et al., 2008; Patil et al., 2013; Saavedra-Pellitero
Giglio and Johnson, 2016; Nghiem et al., 2016). South to the     et al., 2014, 2019; Charalampopoulou et al., 2016; Malin-
PF, the Antarctic Zone (AZ) is characterized by a thin surface   verno et al., 2015, 2016).
layer of cold and fresh Antarctic Surface Water (ASW) from          One common observation is the general dominance of
the Antarctic shelf zone. The AZ is bounded to the south         Emiliania huxleyi in extant coccolithophore assemblages
by the Southern ACC Front (SACCF) which approximately            with a southward displacement of morphotype A by the more
equals the maximum sea-ice extent in the cold season. Closer     weakly calcified morphotypes of morphogroup B (Cubil-
to Antarctica and seasonally covered by sea ice, the Southern    los et al., 2007; Boeckel et al., 2006; Mohan et al., 2008;
Zone (SZ) lies between the SACCF and the Southern Bound-         Charalampopoulou, 2011; Patil et al., 2013, 2014; Saavedra-
ary (SB) of the ACC, where low-oxygen Upper Circumpolar          Pellitero et al., 2014, 2019). In fact, specimens of E. hux-
Deep Water (UCDW) upwells and becomes very cold and              leyi with a variable degree of calcification within the same
fresh ASW. The SB is the northern boundary of the very cold      morphotype have been previously observed in the South
and nearly isothermal waters offshore Antarctica (Continen-      Pacific, offshore Chile and in the Patagonian fjords, being
tal Zone, CZ).                                                   especially evident in morphotypes A and R (e.g. Beaufort
   It is known that phytoplankton, including coccol-             et al., 2008, 2011; Rigual Hernández et al., 2018; von Das-
ithophores as the modern ocean’s dominant calcifying phy-        sow et al., 2018; Saavedra-Pellitero et al., 2019; Díaz-Rosas
toplankton, play a fundamental role in the SO food web,          et al., 2021). The southernmost extent of coccolithophores
in which carbon is consumed, respired (as carbon dioxide),       in SO plankton with monospecific occurrence of E. huxleyi
remineralized and sequestrated. Satellite remote sensing de-     is approximately located at the SACCF, although often its
tected the existence of a region of elevated reflectance and     abundance is already very low south of the PF (Malinverno
particulate inorganic carbon between the STF and the PF,         et al., 2015; Saavedra-Pellitero et al., 2019). However, more
corresponding to high coccolithophore abundances. This so-       southward shifts in the occurrence or abundance of coccol-
called “Great Calcite Belt” usually occurs during austral        ithophores and assemblage composition have already been
summer (Balch et al., 2011, 2016). Phytoplankton production      observed and modelled in recent years (e.g. Winter et al.,
in this area also controls global primary production via the     2014; Krumhardt et al., 2019). Repeated sampling in the
lateral export of nutrients to lower latitudes (e.g. Sarmiento   Australian sector of the SO over the past 4 decades suggests a
et al., 2004; Palter et al., 2010). Because of their two-fold    dramatic range expansion of coccolithophores south of 60◦ S,
carbon utilization, via photosynthesis (drawing down CO2         dominated by the globally ubiquitous species E. huxleyi (Cu-
from the atmosphere into the ocean, Deppeler and David-          billos et al., 2007; Winter et al., 2014; Charalampopoulou
son, 2017) and calcification (releasing CO2 into the surface     et al., 2016). In this region temperature seems to be a more
water and atmosphere, Volk and Hoffert, 1985; Rost and           prominent factor affecting E. huxleyi morphotype distribu-
Riebesell, 2004; Kohfeld and Ridgwell, 2009), the contribu-      tion and coccolith mass than the carbonate chemistry, there-
tion of coccolithophores to the carbon cycle is particularly     fore suggesting that the influence of global warming on coc-
complex. Additionally, the ratio between the production of       colithophores will be stronger than ocean acidification in the
particulate organic carbon and particulate inorganic carbon      future. The influence of carbonate chemistry in the calcite
(essentially calcium carbonate) is dependent on the species,     production of coccoliths has also been noted in culture exper-
morphotype and given biogeochemical conditions (Blanco-          iments; it however showed conflicting results in the literature.
Ameijeiras et al., 2016; Findlay et al., 2011). The competi-     While in several experiments increased pCO2 concentrations

Biogeosciences, 19, 585–612, 2022                                                    https://doi.org/10.5194/bg-19-585-2022
N. M. Vollmar et al.: Coccoliths in surface sediments across the Drake Passage                                                587

led to reduced calcification rates, other experiments showed      sents the narrowest strait through which the ACC flows, re-
no response or even increased calcification rates (Meyer and      sulting in a strong concentration of the oceanic fronts (Park
Riebesell, 2015, and references therein).                         et al., 2019; Barré et al., 2011) and hence large environmental
   Considering that the SO biological calcification is known      changes across a relatively small space. In general, sea sur-
to exert a powerful control on the global distribution of al-     face temperature (SST) decreases southward, while nutrients
kalinity (Krumhardt et al., 2020), the extent to which those      (e.g. nitrate, phosphate and silicate) increase poleward across
southward shifts are exclusively of recent origin could possi-    the DP. While fronts amplify vertical mixing, their associ-
bly be reconstructed on the basis of the occurrences of coc-      ated strong jets diminish horizontal mixing (Chapman et al.,
coliths in surface sediments. However, the number of coccol-      2020), and as such, they can act as biological barriers for non-
ithophore studies in surface sediment in this area is very lim-   motile plankton (such as coccolithophores). However, fronts
ited, and they mostly focus on assemblages (Boeckel et al.,       are very dynamic in the DP, as they meander, merge, and split
2006; Findlay and Giraudeau, 2002; Saavedra-Pellitero and         over short timescales (i.e. weeks; see Barré et al., 2011, for a
Baumann, 2015). Understanding and predicting the impact           detailed analysis of the DP), enhancing water exchange. The
of the already ongoing SO acidification and warming on the        latter is also supported by emerging eddies along the fronts,
calcifying plankton is nowadays a key research challenge.         which are capable of transporting water masses across fronts.
While the relationship between environmental parameters           Especially the Polar Front Zone (PFZ), between the SAF and
and the community composition, biogeography and calcifi-          PF, and the AZ, south of the PF, are both characterized by
cation mode of E. huxleyi in extant coccolithophore commu-        anticyclonic and cyclonic eddies (Barré et al., 2011; Talley
nities across the Drake Passage (DP) was already assessed         et al., 2011) which influence the surface water temperatures
by Saavedra-Pellitero et al. (2019), this work focuses on the     and nutrient contents in the DP depending on the season.
transformation and record of living polar coccolithophores        While anticyclonic eddies normally upwell deep, cold and
into fossil coccolith assemblages preserved in underlying re-     nutrient-rich waters and enhance primary production in aus-
cent sediments. The aims of the present study are to in-          tral winter and spring, this mechanism seems to reverse in
vestigate if the biogeographical distribution of the coccol-      austral autumn and summer (Dawson et al., 2018).
ith assemblages in surface sediments across the DP reflect           The DP is furthermore known for strong bottom currents,
the steep environmental gradients marked by the frontal sys-      so the winnowing and trapping of sediment are common in
tems and to assess if (and how) they are affected by the          this area (Lamy, 2016; Wu et al., 2019). Modern bottom
hydrodynamic and post-depositional processes in this re-          flow speed in proximity to the frontal jets lies between 10
gion. Additionally, we evaluated the coccolith mass varia-        and 25 cm/s (Renault et al., 2011; Donohue et al., 2016) and
tions in the dominant taxa E. huxleyi within each different       was estimated to be between 12 and 22 cm/s at the modern
morphotype, which can serve as an estimate for CaCO3 ex-          SAF location in the Holocene (Toyos et al., 2020). Despite
port that may be affected by projected environmental change       these strong bottom currents, the surface sediments in the
(e.g. Rigual Hernández et al., 2020c). This analysis of pre-      DP show a clear trend between the composition of surface
industrial assemblages by using a suite of well-preserved         sediments and ocean productivity, terrigenous input, the in-
surface sediment allowed for a comparison to the available        tensity of ocean currents, and ice proximity (Wu et al., 2019;
plankton data (Saavedra-Pellitero et al., 2019) and will con-     Cárdenas et al., 2019).
stitute an invaluable dataset for future potential palaeoproxy       A general N–S transition from carbonate-rich to opal-rich
calibrations and climate models, covering an existing gap in      sediment is observed within the DP surface sediments (Cár-
the literature of the SO.                                         denas et al., 2019). Relatively high carbonate contents of
                                                                  > 45 wt % in the Subantarctic Zone (SAZ) along the Chilean
                                                                  and Argentinian margins decrease in the subantarctic wa-
2   Study area                                                    ters of the AZ south of the PF and become extremely low
                                                                  (mean of 2.4 wt %) in the surface sediments of the SZ and
The study area covers the Chilean margin south of 52◦ S to-       CZ south of the SACCF (Raymond, 2014; Cárdenas et al.,
gether with the western part of the Drake Passage (DP; see        2019; Wu et al., 2019). Diatom concentrations at and south
Fig. 1). Off the Chilean margin, the relatively narrow but        of the PF are generally 1 order of magnitude higher than
strong Cape Horn Current (CHC) transports low-salinity and        north of it. Diatom distribution clearly reflects the N–S en-
modified ACC waters into the Atlantic through the northern        vironmental gradients of sea surface temperature and sea-ice
DP (Chaigneau, 2005; Strub et al., 1998). Two further pole-       extent, and the assemblage distribution characterizes the dif-
ward flowing currents, the surface Peru–Chile Countercur-         ferent frontal zones (Raymond, 2014; Cárdenas et al., 2019).
rent transporting equatorial waters and the subsurface Peru–      Furthermore, terrigenous sediments in the DP region mainly
Chile Undercurrent transporting warm and high-nutrient wa-        originate from proximal terrestrial sources such as Patago-
ters (Karstensen and Ulloa, 2009; Strub et al., 1998) reach       nia and the Antarctic Peninsula, as shown by a comparable
approximately the area where the CHC diverges from the            set of surface sediment samples (Wu et al., 2019). Estimated
ACC at around 40◦ S (not shown in the map). The DP repre-         Holocene sedimentation rates in the DP area are of the order

https://doi.org/10.5194/bg-19-585-2022                                                      Biogeosciences, 19, 585–612, 2022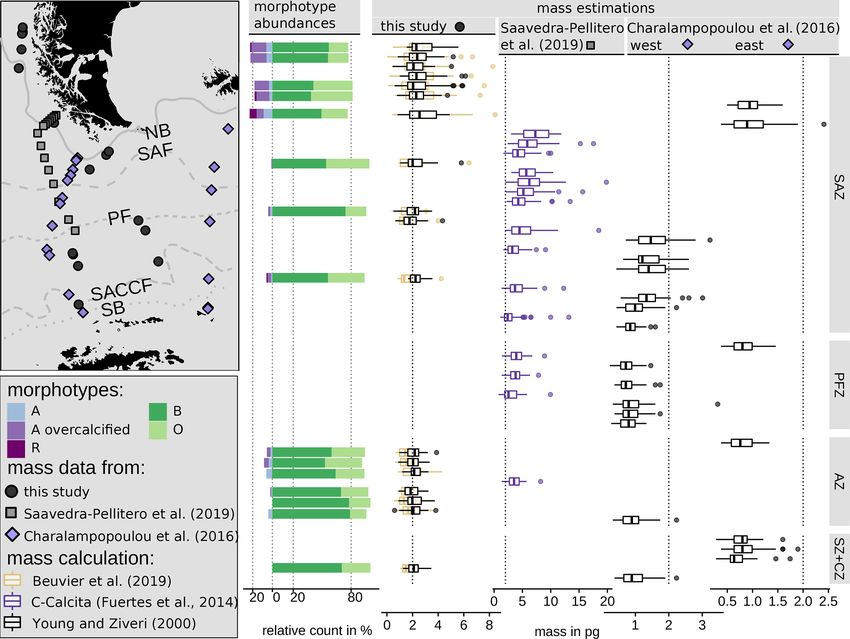
588 N. M. Vollmar et al.: Coccoliths in surface sediments across the Drake Passage
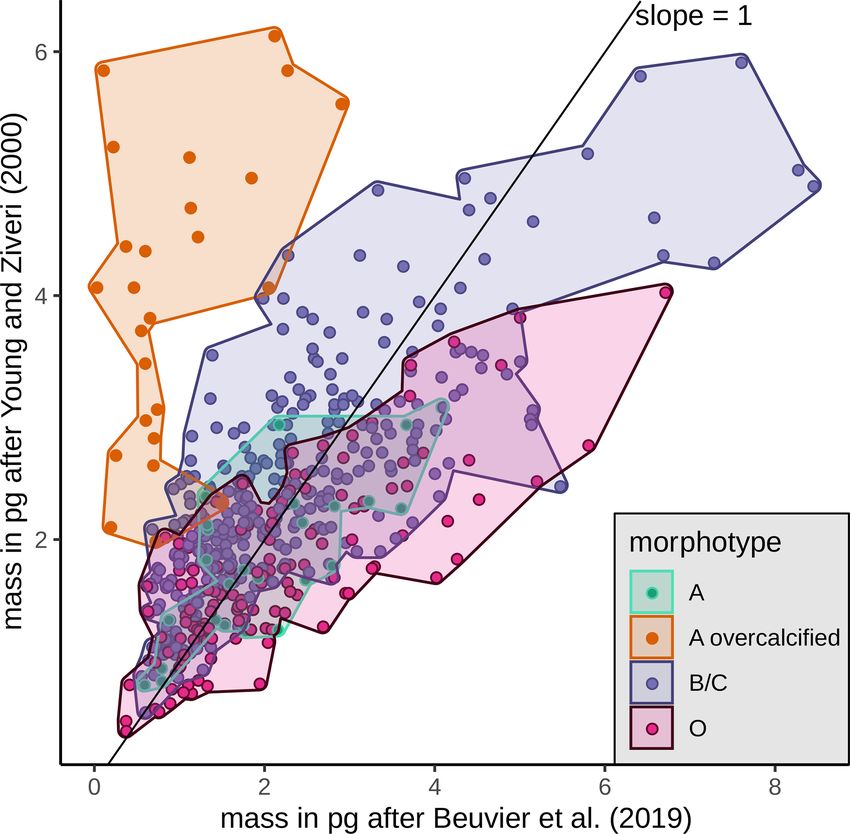
Figure 1. Study area in the Drake Passage, Southern Ocean, showing (a) locations of the studied surface sediment samples from expedition
PS97 (Lamy, 2016) and radiocarbon dates (1 from Caniupán et al., 2011b, and 2 from Vorrath et al., 2019) and a bathymetric map from
ETOPO1 (Amante and Eakins, 2009) and (b) a sea surface temperature composite (MODIS Aqua 2002–2020 cumulative L3m 4 km product
distributed by the Ocean Biology Distributed Active Archive Center as AQUA_MODIS.20020704_20200831.L3m.CU.SST.sst.4km.nc based
on NASA/JPL, 2020) with main currents after Lamy et al. (2015) and Kaiser et al. (2005): CHC (Cape Horn Current) and ACC (Antarctic
Circumpolar Current). Dotted and dashed lines depict the ACC fronts (from Park and Durand, 2019) from north to south the following:
NB (Northern Boundary, resembles the STF), SAF (Subantarctic Front), PF (Polar Front), SACCF (Southern ACC Front) and SB (Southern
Boundary). Areas between the ACC fronts are the SAZ (Subantarctic Zone), PFZ (Polar Frontal Zone), AZ (Antarctic Zone), SZ (Southern
Zone) and CZ (Continental Zone). Blue line depicts the approximate summer sea-ice extent (Sea Ice Index, Version 3, Fetterer et al., 2017).
Base map dataset from Natural Earth (https://naturalearthdata.com, last access: 27 April 2020).
of 3.5 cm/kyr to up to > 10 cm/kyr (Ho et al., 2012; Caniupán depth) and 20.5 cm (76.5 cm composite depth) with 1.13 and
et al., 2011a; Wu et al., 2021). 6.64 ka, respectively. The real sediment surface was partly
missing in the piston core, so Wu et al. (2021) calculated a
recent age for the trigger weight core, but even the surface of
3 Material and methods the piston core had an age which allows us to assume that the
surface sediment is at least close to recent times. We there-
In total, 28 surface sediment samples from the southern
fore assume that our studied surface sediments represent rela-
Chilean and Argentinian margin and the DP were prepared
tively modern conditions, with ages ranging most likely from
and analysed for this study (Fig. 1). All samples were re-
the mid to late Holocene.
trieved with a 12-tube multicorer sampling device (MUC67,
The uppermost centimetre of the multicores was sam-
manufactured by Fa. Wuttke, Henstedt-Ulzburg, Germany,
pled and prepared with a combined dilution/filtering tech-
with an inner tube diameter of 6 cm and a length of 60 cm)
nique following Andruleit (1996). Between 66 and 153 mg
from February to April 2016 during expedition PS97 (Lamy,
of dry bulk sediment per sample were suspended in dem-
2016). Datings of adjacent near-surface sediments at the
ineralized water buffered with ammonia and ultrasonicated
southern Chilean margin (Caniupán et al., 2011b) as well
for up to 30 s. The suspensions were split to 1/100 with a
as south of the PF within the DP (Vorrath et al., 2019) give
rotary sample divider, filtered through polycarbonate mem-
calibrated accelerator mass spectrometry (AMS) 14 C ages of
brane filters with a pore size of 0.45 µm and dried in an oven
2.91–3.06 and 4.83 ka, respectively. Additionally, Wu et al.
at 40 ◦ C for 24 h. Out of the dried filters, a piece of ap-
(2021) calibrated AMS 14 C ages for the sediments from
proximately 1 cm2 was cut out, mounted on an aluminium
the piston core PS97/085-3 at 0.5 cm (56.5 cm composite
Biogeosciences, 19, 585–612, 2022 https://doi.org/10.5194/bg-19-585-2022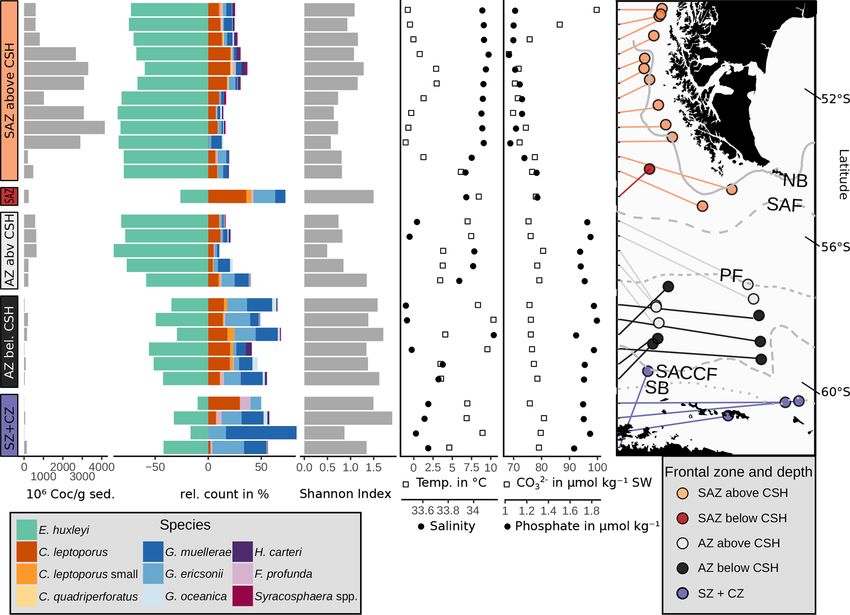
N. M. Vollmar et al.: Coccoliths in surface sediments across the Drake Passage                                                    589

scanning electron microscope (SEM) stub, fixed with car-
bon conductive tabs and sputter-coated with gold–palladium.
The filters were analysed with a Zeiss DSM 940A SEM at
a magnification of 3000× for coccolith species abundance
counts and of at minimum 5000× for E. huxleyi morphotype
identification and abundances. A minimum of 300 coccoliths
per sample was counted in transects across the filter area,
except for eight relatively coccolith-poor samples south of
the PF (PS97/083-1, PS97/080-2, PS97/042-1, PS97/044-1,
PS97/074-1, PS97/048-1, PS97/049-2 and PS97/052-3) and
two in the SAZ (PS97/096-1 and PS97/094-1) in which at
least 100 coccoliths were counted (see Table 2). All the sam-
pling points were considered when plotting the number of
coccoliths per gram of sediment, except for three samples
with extremely low counts that were excluded in the plots of     Figure 2. Examples of identified Emiliania huxleyi morphotypes in
relative abundances. The number of coccoliths per gram of        this study. The scale bar is 1 µm and equal among all displayed coc-
sediment (Coc/g sed.) was calculated using the formula from      coliths. In morphogroup A, we identified morphotypes A, A over-
                                                                 calcified and R; in morphogroup B, we identified morphotypes B/C
Andruleit (1996):
                                                                 and O based on the central-area feature. Note the large size variation
               Fc · Cc · Sp                                      within morphotype B/C. See Table 1 for a classification summary
Coc/g sed. =                ,                              (1)   of the different morphotypes.
                 A·W

in which Fc is the effective filtration area (mm2 ), Cc is the
number of counted coccoliths, Sp is the split factor, A is the      In an additional count, we differentiated between five E.
investigated filter area and W is the weight of bulk dry sedi-   huxleyi morphotypes within morphogroups A and B. These
ment.                                                            are type A, type A overcalcified and type R (comprised in
   Furthermore, a preservation index (Calcidiscus                morphogroup A) as well as type B/C and type O (within
leptoporus–Emiliania huxleyi Dissolution Index, CEX)             morphogroup B). Our approach thus slightly differs from the
adopted from Dittert et al. (1999) was calculated in order to    morphotype identification of Saavedra-Pellitero et al. (2019)
check whether the coccolith assemblages were influenced by       within morphogroup B. Due to the fact that we could not al-
carbonate dissolution. The CEX is based on the differential      ways distinguish with certainty between types B, B/C and
dissolution behaviour of the delicate E. huxleyi versus the      C, we considered here type B/C as a mixed classification
more robust C. leptoporus and has proven to be comparable        for coccoliths resembling characteristics of these three types,
to dissolution indices based on foraminiferal tests.             with a size ranging across the typical threshold at 3.5 µm
                                                                 (Young et al., 2021, 2003; Cubillos et al., 2007). In our stud-
                 % E. huxleyi                                    ied samples, size was the only coherent characteristic that
CEX =                                                      (2)
        % E. huxleyi + % C. leptoporus                           differed between specimens within morphogroup B (exclud-
                                                                 ing morphotype O) with a normal distribution maximum be-
  The assemblage diversity was assessed using the Shannon        tween approximately 3 and 4 µm and showing no indica-
index:                                                           tion for distinct morphotype distributions (see Table 1 and
                         S
                                                                 Fig. 2). Hence, we classified all E. huxleyi coccoliths from
                                                                 morphogroup B into either type B/C or type O, depending on
                         X
Shannon diversity = −           pi log2 pi ,               (3)
                          i=1                                    the central area (Hagino et al., 2011). In total, we classified
                                                                 between 53 and 115 E. huxleyi morphotypes in most samples
where pi is the proportion of species i and S is the number      in the SAZ and four samples in the AZ, while we could only
of species.                                                      classify between 11 and 48 E. huxleyi morphotypes in eight
                                                                 samples from the AZ and SZ + CZ and in one sample in the
3.1   Species and morphotype taxonomy                            SAZ (see Table 2).

Coccoliths were classified at the species level following        3.2   Emiliania huxleyi morphometry and mass
Young et al. (2003) and the electronic guide to the biodiver-          estimation
sity and taxonomy of coccolithophores Nannotax3 by Young
et al. (2020). Specific taxonomical considerations regarding     For a subset of 22 samples, the morphometry of E. huxleyi
E. huxleyi specimens were taken into account, and morpho-        coccoliths was performed and analysed on 570 SEM micro-
types were differentiated as far as it was possible on single    graphs of single flat-lying E. huxleyi coccoliths at a magni-
coccoliths directly during the counts.                           fication of 10 000 × (347 of morphotype B/C, 156 of mor-

https://doi.org/10.5194/bg-19-585-2022                                                       Biogeosciences, 19, 585–612, 2022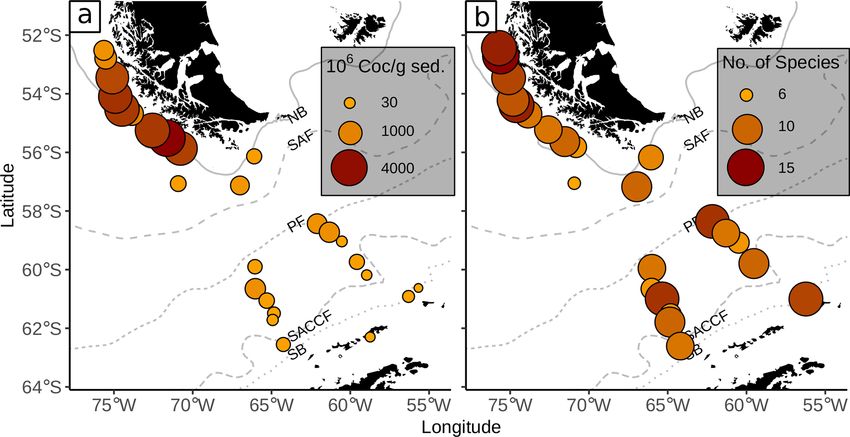
590                                             N. M. Vollmar et al.: Coccoliths in surface sediments across the Drake Passage

Table 1. Identified Emiliania huxleyi morphotypes and classification summary based on Young et al. (2020), Hagino et al. (2011) and
Saavedra-Pellitero et al. (2019). See Fig. 2 for example images for the respective morphotypes.

 Morphogroup       Morphotype             Morphology of distal shield                                  Morphology of the central area
 A                 Type A                 Moderately to heavily calcified elements                     Grill
                   Type A overcalcified   Moderately to heavily calcified elements, broad inner tube   Closed or nearly closed
                   Type R                 Reticulofenestra-like, heavily calcified distal shield       Grill
 B                 Type B/C               Lightly calcified and well-separated elements                Solid, plated, laths with irregular outline
                   Type O                 Lightly calcified elements, elevated                         Open

photype O, and 67 of morphotypes A and A overcalcified to-                 O (ks = 0.015) was introduced by Poulton et al. (2011) in
gether). Images of E. huxleyi coccoliths were measured with                a plankton study along the Patagonian Shelf for a morpho-
the Coccobiom2 macro (Young, 2015) in the Fiji software                    type with a central area described as an “open or thin plate”
programme (Schindelin et al., 2012). Measurements were                     which the authors called type B/C but that we identified as
done in micrometres (µm) based on the scale bar of the SEM                 morphotype O based on the published images and descrip-
images. They were scaled to 100 % with a Coccobiom2 SEM                    tion of Hagino et al. (2011). The approach of performing
calibration of 1.09 and the chosen magnification.                          morphometric measurements on the coccoliths followed by
   From the morphometrical measurements on E. huxleyi the                  the estimation of their coccolith mass assuming a systematic
coccolith masses were estimated based on two different for-                relation between length and thickness was chosen because
mulas, that of Beuvier et al. (2019) and that of Young and                 all data were determined on the same material using SEM.
Ziveri (2000). Beuvier et al. (2019) studied coccospheres                  Rigual Hernández et al. (2020c) compared coccolith car-
and coccoliths of seven different Noëlaerhabdaceae species                 bonate estimates from a birefringence-based approach with
including three strains of E. huxleyi by means of X-ray                    the morphometrics-based approach from Young and Ziveri
nanotomography. They found that coccolith mass correlates                  (2000) and showed, on average, slightly higher but largely
with grid perimeter and with crystal number. They devel-                   comparable carbonate contents for E. huxleyi coccoliths us-
oped the following empirical formula (Eq. 4) to calculate                  ing the latter approach.
the coccolith mass m (in pg) from the number of segments
n (with two constants, kn = 4.73 × 10⁻⁵ ± 0.28 × 10⁻⁵ and                  3.3   Environmental parameters
β = 3.175 ± 0.251). The number of segments (n) was calcu-
lated with p being the peripheral grid perimeter (central-area             We used biogeochemical parameters to test how much of the
perimeter) and w being the average width of the calcite crys-              species assemblage composition could be explained by envi-
tals (also known as T elements) that we set to 0.12 µm (see                ronmental factors (see also Sect. 3.4). Those are annual salin-
Beuvier et al., 2019). This is based on a calcite density of               ity, temperature and phosphate at 10 m water depth which
2.71 pg µm−3 . However, this formula does not account for                  we extracted from the 1◦ GLODAPv2 mapped climatology
calcification of the central area itself, as found in the E. hux-          (Global Ocean Data Analysis Project; Lauvset et al., 2016;
leyi morphotype A overcalcified observed in this study.                    Key et al., 2015) to stay consistent with the calculated car-
                                                                           bon system parameters based on the same data product. Car-
                                                                           bon system parameters for the location of each sample at its
                          p                                                respective water depth were calculated using the CO2 SYS
m = kn · nβ with n =                                              (4)
                          w                                                macro for PC (Pierrot and Wallace, 2006) based on salin-
   We additionally used the well-established approach to esti-             ity, temperature, silicate, phosphate, alkalinity and total CO2 .
mate coccolith masses by Young and Ziveri (2000). Their ap-                The data from GLODAPv2 and the derived carbonate system
proach (Eq. 5) is based on the length l of a coccolith together            data have a seasonal bias towards Southern Hemisphere win-
with a species-specific and morphotype-specific shape factor               ter (December to March) because samples in this database
ks and the calcite density C (for coherency with the formula               were mostly taken during the austral summer (Lauvset et al.,
of Beuvier et al., 2019 we used here of 2.71 pg µm−3 ).                    2016). Coccolithophores in the southeastern Pacific sector
                                                                           of the SO bloom mostly during austral spring and summer
                                                                           months (Balch et al., 2016; Nissen et al., 2018), and thus the
m = C · ks · l 3                                                  (5)      coccolithophore assemblages in surface sediments are biased
                                                                           towards the same season as the environmental dataset.
   The different shape factors used were based on the identi-                 Austral winter photosynthetically active radiation (PAR)
fied morphotype following Young and Ziveri (2000): ks =                    at 10 m water depth was estimated using a model of light
0.02 for morphotypes A and B/C and ks = 0.04 for mor-                      penetration (Buiteveld, 1995; Murtugudde et al., 2002), the
photype A overcalcified. The shape factor for morphotype                   diffuse attenuation coefficient for downwelling irradiance at

Biogeosciences, 19, 585–612, 2022                                                                https://doi.org/10.5194/bg-19-585-2022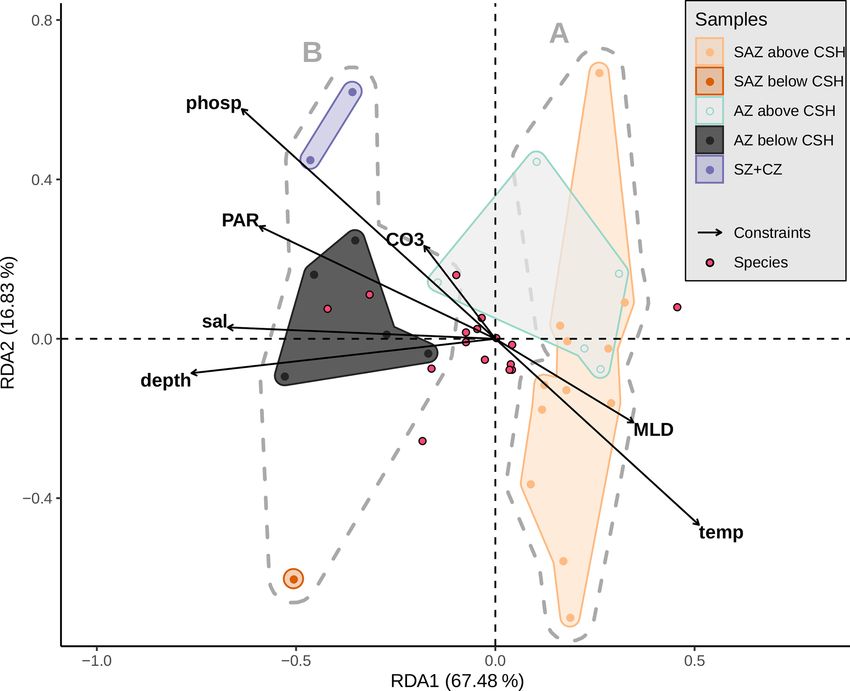
N. M. Vollmar et al.: Coccoliths in surface sediments across the Drake Passage                                              591

490 nm and Eq. (1) in Lin et al. (2016). Mixed-layer depth       the R package ggplot2 version 3.3.2 (Wickham, 2016) and
(MLD) was extracted from monthly 1◦ Argo MLD clima-              Inkscape version 1.0.2 and Inkscape 1.1.1 (Inkscape, 2021).
tology (Holte et al., 2017; based on a density algorithm).
Data from austral spring and summer months (September
to March) were averaged and extracted from the respective        4     Results
sample positions.
                                                                 Coccoliths were found in all the oceanographic zones
                                                                 bounded by the fronts, with generally high absolute numbers
3.4   Statistical analyses
                                                                 in the SAZ and comparatively low numbers in the AZ and
                                                                 SZ + CZ. The abundance ranges from 9 × 10⁶ Coc/g sed. in
Prior to any statistical analysis, we excluded three sam-        the SZ + CZ (at PS97/077-1) to 4159 × 106 Coc/g sed. in the
ples (PS97/077-1, PS97/079-1 and PS97/071-2) because of          SAZ (at PS97/020-1). We unexpectedly found a quite diverse
the very low number of coccoliths counted (< 40 per sam-         coccolith assemblage with a total of 23 identified species,
ple). We identified suitable ordination methods by apply-        ranging from 6 to 15 different taxa per station.
ing detrended correspondence analysis (DCA) on the species          The highest numbers of coccoliths were recorded in the
relative-abundance dataset. DCA resulted in a first axis         deepest samples studied along the Chilean margin (1.8 to
length of 1 SD, suggesting a short gradient for which lin-       2.5 km water depth) with 2669×106 to 4159×106 Coc/g sed.
ear ordination methods are more appropriate. The relative-       belonging to different taxa, ranging from 7 to 14 different
abundance data were standardized using a Hellinger trans-        species depending on the station (Fig. 3). The shallower sur-
formation, which is well suited for species abundance data, to   face sediment samples analysed in this study, located in the
make variability of the species abundances comparable and        northernmost area offshore Chile (0.5 to 1.3 km water depth),
give low weights to rare species (Legendre and Gallagher,        bore 10 to 15 different species but contained relatively low
2001), using R package adespatial 0.3-8 (Dray et al., 2020).     coccolith numbers of ca. 591 to 1023 × 106 Coc/g sed. The
We chose the Hellinger distance measure because it is metric     samples along the Argentinian margin, in an open-ocean set-
and performs well in linear ordination (Buttigieg and Ram-       ting (from 1.6 to 4 km water depth), yielded only 199 to
ette, 2014). To find groups of samples that are most sim-        472 × 106 Coc/g sed. belonging to 6 to 10 different species.
ilar to each other, average-linkage (unweighted pair group       The samples south of the PF, located in the AZ, were re-
method with arithmetic mean, UPGMA) hierarchical cluster-        trieved from water depths of at least 1.2 km but mostly of 3 to
ing was performed on the assemblage data with the R func-        4 km. We found similar numbers of coccolith species than at
tion hclust (R Core Team, 2020), because it takes into ac-       lower latitudes (from 6 to 13 taxa), but the coccolith contents
count the average pair-wise distance between all members         considerably decreased (22×106 to 645×106 Coc/g sed.), es-
of clusters. The best number of clusters was suggested by the    pecially in the deeper samples, below 3.1 km. Even some of
majority of 30 indices calculated with the R package NbClust     the southernmost samples in the SZ + CZ along the Antarc-
version 3.0 (Charrad et al., 2014). The significance of each     tic margin (PS97/074-1 and PS97/052-3) yielded a content of
cluster was assessed by multiscale bootstrap resampling with     57 and 141 × 106 Coc/g sed. from 12 and 9 species, respec-
10 000 replications using the R package pvclust version 2.2-0    tively. The lowest total coccolith abundances were found in
(Suzuki et al., 2019) to assess the stability of the clusters.   two samples in the SZ + CZ (PS97/071-2 and PS97/077-1)
   We assessed relationships between environmental and bi-       and AZ (PS97/079-1) with 9 to 22 × 106 Coc/g sed. Because
otic data using a transformation-based redundancy analysis       of the low total coccolith counts < 40 in these three samples,
(tb-RDA). We constrained our assemblage data (response of        we did not consider them for further analyses (see Table 2).
16 species at 25 sites) to seven standardized environmental
variables (explanatory): salinity, temperature, phosphate and    4.1    Species composition and distribution
PAR at 10 m water depth; CO3 as a representative variable for
the carbonate system at surface sediment sample depth; the       All surface sediment coccolith assemblages in the study area
MLD; and the respective surface sediment sample depth it-        consist of E. huxleyi, Gephyrocapsa muellerae and Calcidis-
self. The adjusted R 2 was calculated, and the significance of   cus leptoporus (intermediate morphotype; hereafter only re-
the tb-RDA was tested at 9999 permutations. Analysis was         ferred to as C. leptoporus according to Baumann et al., 2016),
performed using the R package vegan version 2.5-6 (deco-         and in all, except in one sample, we identified Gephyrocapsa
stand, rda, RsquareAdj and anova.cca; Oksanen et al., 2019).     ericsonii as a main contributor. Those species make up on av-
We determined the similarity between the water column and        erage 94 % of the coccolith assemblages in the SAZ, 93 % in
fossil coccolithophore assemblages in this region by calculat-   the AZ and 87 % in the SZ + CZ. Additionally, C. leptoporus
ing the analogue distance of a subset of the sediment surface    small, Florisphaera profunda, Gephyrocapsa oceanica, He-
samples to the nearest plankton samples (Saavedra-Pellitero      licosphaera carteri and Syracosphaera spp. are present in
et al., 2019) using the R package ggpalaeo version 0.0.0.9005    low relative numbers in several of the studied stations in the
(Telford, 2019; see Fig. A3). All figures were made with         DP and the Chilean margin (see Fig. 4).

https://doi.org/10.5194/bg-19-585-2022                                                    Biogeosciences, 19, 585–612, 2022
592                                           N. M. Vollmar et al.: Coccoliths in surface sediments across the Drake Passage

Table 2. Sample main metadata (Lamy, 2016), frontal zone, total counted coccoliths, coccolith abundance, species richness and total number
of classified E. huxleyi morphotypes per sample. The lowermost three samples yielded very low total coccolith counts and were excluded
from statistical analyses. Note that E. huxleyi morphotype classifications were done in an additional count (see Sect. 3)

         Station   Latitude    Longitude    Frontal     Water depth      Total    Abundance       Species   Classified E. huxleyi
                      (◦ S)       (◦ W)     zone             (in m)    counted       (×106 )     richness           morphotypes
         139-2        52.44        75.71    SAZ                 639        406        596.48          14                      66
         132-2        52.62        75.59    SAZ                 843        330        591.42          10                      67
         135-1        52.70        75.59    SAZ                1094        365        807.99          15                     115
         129-2        53.32        75.21    SAZ                1879        370       2669.92          12                      99
         122-2        54.10        74.91    SAZ                2560        314       3305.55          11                      56
         027-1        54.38        74.61    SAZ                2349        340       3089.65          14                      73
         024-2        54.59        73.95    SAZ                1273        308       1023.91           9                      66
         021-1        55.12        72.67    SAZ                1840        316       3078.35           9                      52
         020-1        55.51        71.64    SAZ                2104        325       4159.29          10                      84
         015-2        55.73        70.89    SAZ                1878        317       2897.79           7                      93
         096-1        56.08        66.15    SAZ                1621        212        199.29           8                      47
         094-1           57        70.97    SAZ                3993        103        239.12           6                       –
         097-1        57.05        67.07    SAZ                2319        319        472.89          10                      83
         085-2        58.35        62.17    AZ                 3091        330        569.10          13                      53
         086-2        58.64        61.40    AZ                 2969        327        628.13           9                      82
         083-1        58.99        60.57    AZ                 3756        101         29.69           7                      22
         080-2        59.67        59.63    AZ                 3113        182        202.18          10                      34
         042-1        59.84        66.10    AZ                 4172        105        156.02           9                       –
         045-1        60.57        66.09    AZ                 2292        313        645.80           7                      90
         044-1        60.61        66.02    AZ                 1203        121        226.96           6                      78
         074-1        60.87        56.34    SZ + CZ            1831        111         57.37          12                      24
         046-6           61        65.36    AZ                 2803        309        218.59          13                      48
         048-1        61.44        64.89    AZ                 3455        103         86.11           7                      18
         049-2        61.67        64.96    AZ                 3752        101         39.23          10                      26
         052-3        62.50        64.29    SZ + CZ            2890        178        141.01           9                      24
         079-1        60.14        58.99    AZ                 3539          34         22.13           7                     11
         077-1        60.59        55.70    SZ + CZ            3586          10          8.96           5                      –
         071-2        62.26        58.77    SZ + CZ             441           6         15.91           3                      –

                                                                          The majority of the surface sediment assemblages are
                                                                       dominated by E. huxleyi coccoliths with average abundances
                                                                       of 72 % in the SAZ, 60 % in the AZ and 37 % in the
                                                                       SZ + CZ. Emiliania huxleyi gets replaced by gephyrocap-
                                                                       sids (G. muellerae and G. ericsonii) and C. leptoporus at the
                                                                       deeper stations (i.e. below 3.1 km), from the SAZ (gephy-
                                                                       rocapsids: 30 %, C. leptoporus: 40 %) and AZ (gephyrocap-
                                                                       sids: 36 %, C. leptoporus: 19 %) to the SZ + CZ (gephyro-
                                                                       capsids: 47 %, C. leptoporus: 6 %). Gephyrocapsa muellerae
                                                                       and G. ericsonii are found in all stations, while G. ocean-
                                                                       ica is not observed in some samples from the SAZ along the
                                                                       Chilean margin and is completely absent in the open-ocean
                                                                       SAZ. Following those gephyrocapsids, the next most abun-
Figure 3. (a) Total number of coccolith as well as (b) number          dant coccoliths belong to the family Calcidiscaceae (mainly
of coccolith species in the studied surface sediments of the DP.       C. leptoporus), which makes up 13 % on average of the coc-
Data from stations PS97/071-2, 077-1 and 079-1 are only shown          colith assemblage. Calcidiscus leptoporus is found in every
in (a). ACC fronts from north to south: NB (Northern Boundary),        sample, while C. leptoporus small is missing in some sam-
SAF (Subantarctic Front), PF (Polar Front), SACCF (Southern ACC
                                                                       ples from the SAZ along the Chilean margin and in one sam-
Front) and SB (Southern Boundary).
                                                                       ple from the SZ + CZ (Fig. 4). Calcidiscus quadriperforatus
                                                                       is exclusively present in samples along the Chilean margin.

Biogeosciences, 19, 585–612, 2022                                                           https://doi.org/10.5194/bg-19-585-2022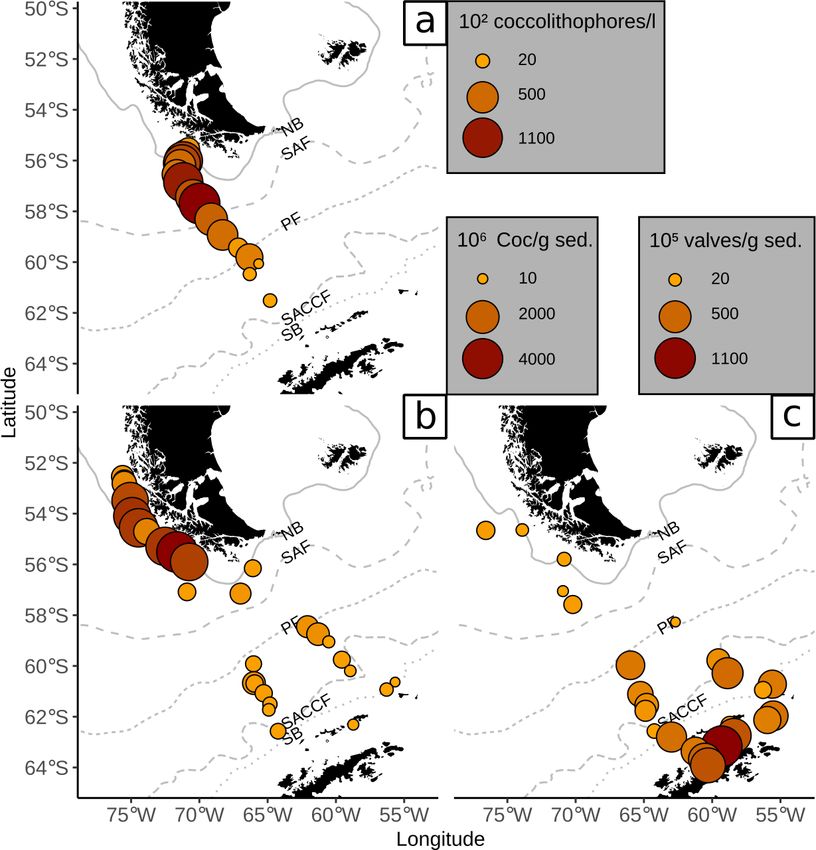
N. M. Vollmar et al.: Coccoliths in surface sediments across the Drake Passage 593
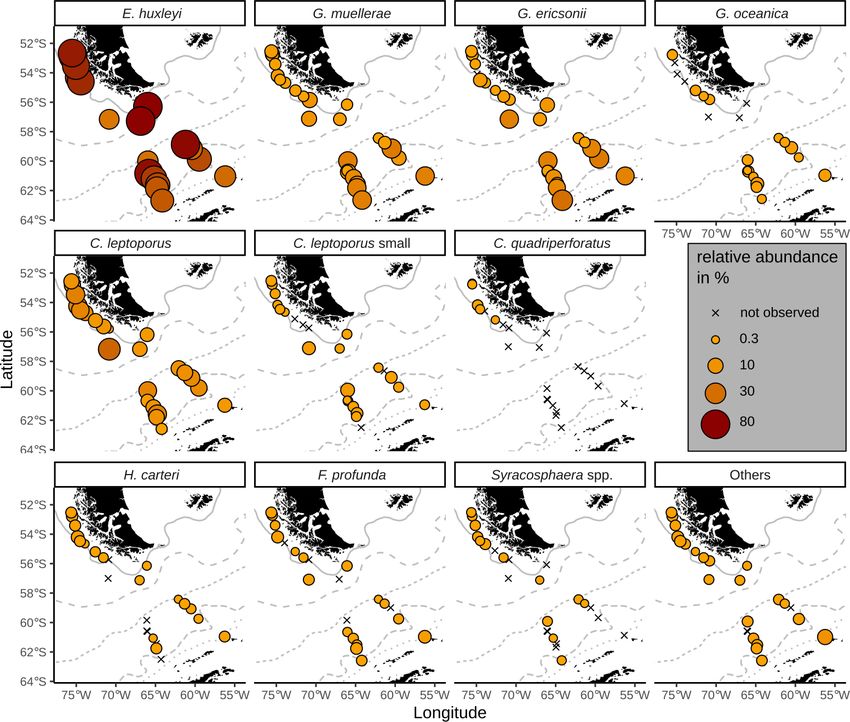
Figure 4. Relative abundances of relevant species in the surface sediments. ACC fronts from north to south: NB (Northern Boundary), SAF
(Subantarctic Front), PF (Polar Front), SACCF (Southern ACC Front) and SB (Southern Boundary).
Noteworthy minor species include F. profunda, H. carteri Additionally to sample depth, we assessed possible fur-
and Syracosphaera spp. with average relative abundances ther drivers of the assemblage distributions using RDA. Con-
of a maximum of 2 % and with occurrences in all frontal straining the surface sediment species assemblages to sample
zones (Fig. 4). Other species scattered across all biogeo- depth, CO3 as a representative variable for the carbon system
graphic zones are Reticulofenestra sessilis, Umbellosphaera at sample depth and the MLD, PAR, temperature, phosphate
spp., Coccolithus braarudii, Algirosphaera robusta and other and salinity at 10 m water depth result in a significant (p =
unidentified taxa. Rare species include Syracosphaera pul- 0.0004) RDA and a significant first axis (pRDA1 = 0.0005) at
chra, Umbilicosphaera foliosa, Umbilicosphaera sibogae, 10 000 permutations. In line with the previous findings, the
Calciosolenia brasiliensis, Coccolithus pelagicus, Oolitho- highest significance is found for the surface sediment sam-
tus fragilis, Umbilicosphaera hulburtiana, Coronosphaera ple water depth (p = 0.0011). Further important drivers are
mediterranea, Pontosphaera spp. and further reworked spec- PAR at 10 m (p = 0.0222), salinity at 10 m (p = 0.0269) and
imens scattered across the DP in three stations (Fig. A1). phosphate at 10 m (p = 0.0314). Depending on the signifi-
See the additional material referenced in the Data availability cance threshold, temperature at 10 m could also be consid-
section for further details. ered relevant (p = 0.0541). These environmental parameters
are negatively correlated to the first RDA axis (RDA1) with
4.2 Cluster and redundancy analysis scores of −0.76 (sample depth), −0.59 (PAR), −0.67 (salin-
ity), −0.63 (phosphate) and 0.51 (temperature).
We performed a hierarchical cluster analysis on the relative
species assemblages resulting in two groups (see Sect. 5). 4.3 Emiliania huxleyi morphotypes
Group A consists of samples that stem from water depths
above 3.1 km from the SAZ and AZ. Group B consists of Emiliania huxleyi coccoliths belonging to morphotypes A,
samples that are either from the SZ + CZ or from the AZ A overcalcified and R are mainly found in the SAZ (Fig. 5).
below or just above 3.1 km, with one sample from the SAZ Morphotype A is found in very low numbers across all zones,
far below 3.1 km. making up on average 6 %, ranging from 1 % to 27 %, of
https://doi.org/10.5194/bg-19-585-2022 Biogeosciences, 19, 585–612, 2022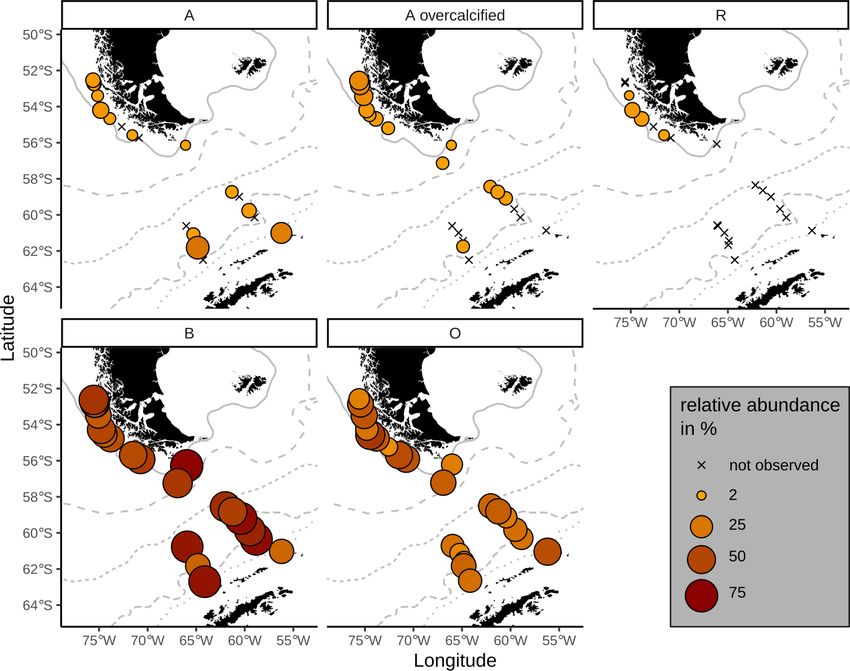
594                                        N. M. Vollmar et al.: Coccoliths in surface sediments across the Drake Passage

the identified E. huxleyi morphotypes. In particular, morpho-    5   Interpretation and discussion
type A overcalcified is abundant in the northernmost samples
along the Chilean margin (reaching up to ca. 16 %) with de-
creasing numbers towards the south (ca. 5 %). Few coccoliths     The surface sediments in our study area are character-
of E. huxleyi morphotype A overcalcified were identified in      ized by a striking difference in the total coccoliths abun-
some samples in the AZ, but they are absent from SZ + CZ         dance, with higher abundances along the Chilean mar-
locations. Morphotype R is restricted to samples in the SAZ,     gin (807–4159 × 106 Coc/g sed.) than south of the PF (9–
and it is present only in low relative abundances (1 %–7 %)      645 × 106 Coc/g sed., Fig. 7). In total, 22 species were identi-
with an average of 3 %. Morphogroup B is dominating the          fied in the surface sediments samples analysed. This is rather
E. huxleyi coccolith assemblages in the studied surface sedi-    surprising because so far only between 8 and a maximum of
ment samples, with 13 % to 56 % of the coccoliths belonging      15 species have been found in samples located along latitudi-
to morphotype O (on average 31 %) and ca. 33 % to 83 %           nal transects crossing the same frontal systems in other sec-
to morphotype B/C (on average 59 %). Morphotype O was            tors of the SO (e.g. Findlay and Giraudeau, 2002; Boeckel
found to be slightly more abundant in the SAZ, while mor-        et al., 2006; Riaux-Gobin et al., 2006; Saavedra-Pellitero
photype B/C was more prominent in the AZ.                        et al., 2019). Fewer species have also been found in com-
                                                                 parable sediment settings in the northern North Atlantic (e.g.
4.4   Emiliania huxleyi biometries and mass estimates            Baumann et al., 2000).
                                                                    The high coccolith abundances along the Chilean mar-
Emiliania huxleyi coccoliths belonging to morphogroup B          gin within the SAZ clearly suggest relatively high produc-
predominate in the study area, showing a size variation of       tivity conditions in the surface water. The species composi-
type B/C coccoliths from 2.22 to 4.78 µm and of type O coc-      tion, dominated by E. huxleyi, C. leptoporus and Gephyro-
coliths from 2.21 to 4.63 µm (Fig. 6). Coccoliths belonging      capsa species, agrees well with those of Chilean communi-
to morphotypes A and A overcalcified were only measured in       ties in overlying plankton samples (e.g. Saavedra-Pellitero
the SAZ with lengths of 2.47 to 3.85 µm. Within morphotype       et al., 2019). Thus, the general good resemblance between
B/C there is a decreasing size trend from north to south, with   (sub-)fossil surface sediment samples and living communi-
maximum lengths of 4.78 µm in the SAZ, 4.15 µm in the AZ         ties indicates that the regional oceanography plays an impor-
and 4 µm in the SZ + CZ. Morphotype O reaches comparable         tant role in shaping recent assemblages.
lengths of up to 4.63 µm in the SAZ.                                Coccolith abundances in surface sediments south of the PF
   Overall, the number of coccoliths in morphogroup B            are lower than at the Chilean margin, but they are still unusu-
(types B/C and O) longer than 4 µm decreases from 3 % to         ally high for this southern latitude (up to 650×106 Coc/g sed.
50 % in the SAZ to up to 6 % in the AZ, while the number of      compared to Boeckel et al., 2006; Findlay and Giraudeau,
coccoliths smaller than 3.5 µm increases from 16 % to 72 %       2002; Saavedra-Pellitero and Baumann, 2015). As it has of-
in the SAZ to 60 % to 70 % in the AZ. Coccoliths in mor-         ten been observed, coccoliths are replaced by diatom valves,
phogroup A (types A and A overcalcified were measured,           which become more abundant southward (e.g. Cárdenas
but morphotype R was not) are considerably smaller than the      et al., 2019; see Fig. 7). However, a decrease in coccol-
coccoliths in morphogroup B.                                     ith diversity is not observed at and south of the PF (see
   Mass estimates after Beuvier et al. (2019) and Young and      Fig. 3). Emiliania huxleyi remains the dominant species to-
Ziveri (2000) (see Sect. 3.4) based on the morphometrical        gether with robust taxa, such as G. muellerae and C. lep-
measurements of E. huxleyi coccoliths are comparable (Eq. 4      toporus. In addition, other taxa are selectively enriched here
after Beuvier et al., 2019, and Eq. 5 after Young and Ziveri,    and even species that are not observed in the overlying plank-
2000) with an overall mean of 2.12 pg (Eq. 4) and 2.29 pg        ton samples offshore southern Chile and across the DP are
(Eq. 5), respectively (see Table 3 and Fig. A2). The mass es-    recorded in the surface sediment samples. This potentially
timates using the first formula were generally a little lower,   suggests that other factors than surface ocean productivity
although it also yielded maximum mass estimates of > 8 pg        might have affected the species composition in these sam-
for some coccoliths of morphotype B/C, for which Eq. (5)         ples.
estimates maximum values of up to 6 pg. The lowest masses           Because of the scarcity of coccolith studies in surface sedi-
were found for morphotype A coccoliths (ca. 1–3 pg) with         ments across similar latitudinal transects in the SO, the deter-
both formulas. At the same time, Eq. (4) largely underesti-      mination of the ecological drivers of the coccolithophore as-
mates the masses of morphotype A overcalcified coccoliths        semblages in this region and potential implications for palae-
(to mostly under 2 pg), while Eq. (5) estimates masses of        orecord interpretations have not been extensively explored.
2–6 pg for those coccoliths. The highest range in mass was       In the following sections we will interpret and discuss the po-
found in the SAZ, with 8.42 and 5.7 pg, respectively.            tential in situ and post-depositional factors that may govern
                                                                 the coccolith abundance and species composition in south-
                                                                 ern high latitudes, with a special focus on E. huxleyi and its
                                                                 different morphotypes.

Biogeosciences, 19, 585–612, 2022                                                    https://doi.org/10.5194/bg-19-585-2022
N. M. Vollmar et al.: Coccoliths in surface sediments across the Drake Passage 595
Figure 5. Relative proportions of E. huxleyi morphotypes. Top: morphogroup A. Bottom: morphogroup B. Crosses mark samples where the
respective morphotype was not observed. ACC fronts from north to south: NB (Northern Boundary), SAF (Subantarctic Front), PF (Polar
Front), SACCF (Southern ACC Front) and SB (Southern Boundary).
Table 3. Summary of mass estimations using two different calculation methods: after Beuvier et al. (2019) (Eq. 4) and after Young and Ziveri
(2000) (Eq. 5) (all measurements in pg).
Method Frontal zone n Mean Median Min Max Range
Beuvier et al. (2019) SAZ 389 2.28 2.01 0.02 8.45 8.42
AZ 124 1.63 1.49 0.55 4.32 3.77
SZ + CZ 8 1.74 1.48 1.04 2.62 1.57
All 521 2.12 1.77 0.02 8.45 8.42
Young and Ziveri (2000) SAZ 389 2.36 2.15 0.44 6.14 5.70
AZ 124 2.09 2.04 0.59 3.87 3.28
SZ + CZ 8 2.15 2.09 1.25 3.47 2.21
All 521 2.29 2.11 0.44 6.14 5.70
5.1 Productivity-related distribution on the continental the present study area, elevated nutrient supply via freshwa-
slope offshore southern Chile and comparison with ter runoff by precipitation and seasonal glacier melting (e.g.
plankton and sediment-trap findings Dávila et al., 2002; Saldías et al., 2019) and relatively warm
surface water temperatures in the CHC in comparison to the
The observed high numbers of coccoliths in the surface sedi- overall study area are plausible causes for an elevated coc-
ments offshore southern Chile are in good agreement to pre- colithophore production and the related increase in coccol-
viously reported higher coccolith accumulation rates off cen- ith sedimentation off southern Chile. Slight differences in
tral Chile (Saavedra-Pellitero et al., 2013), an area that is coccolith abundances between deeper mid-slope sediments
however, influenced by an active coastal upwelling system. (between 1.8 and 2.5 km depth, > 2500 × 106 Coc/g sed.)
The generally high numbers of coccoliths along the Chilean and shallower sediments from the upper slope (0.6–1.2 km
margin within the SAZ also suggest relatively high coccol- depth, < max 1000 × 106 Coc/g sed.) in the SAZ are proba-
ithophore productivity conditions in the surface waters. For bly due to dilution of the shallow samples by high sedimen-
https://doi.org/10.5194/bg-19-585-2022 Biogeosciences, 19, 585–612, 2022596 N. M. Vollmar et al.: Coccoliths in surface sediments across the Drake Passage
Figure 6. Coccolith length distribution of E. huxleyi morphotypes
from north to south. Morphotypes A and A overcalcified were
merged. Grey dots show the actual measurements. Vertical dotted Figure 7. Comparison of (a) coccolithophore counts in plankton
line is shown at 3.5 µm for visual guidance. Data only shown for samples (mean over all water depths as coccolithophores per litre
stations with more than five measurements. ×102 , Saavedra-Pellitero et al., 2019) with (b) coccolith counts in
surface sediments (in Coc/g sed. × 106 , this study) and (c) diatom
valve counts in surface sediments (in valves per gram sediment
× 105 , Cárdenas et al., 2019). ACC fronts from north to south: NB
tation rates via freshwater runoff near the coast. However, (Northern Boundary), SAF (Subantarctic Front), PF (Polar Front),
steadily increased coccolithophore abundances and diversity SACCF (Southern ACC Front) and SB (Southern Boundary).
from coastal to oceanic regions as described for areas further
to the north (Menschel et al., 2016; von Dassow et al., 2018)
may also account for variations in coccolith abundances in 2021). Previous studies in the SO have observed a distri-
the studied slope sediments off southern Chile. bution clearly limited up to the extent of the SACCF (Ma-
The coccolithophore species composition in surface sed- linverno et al., 2015; Holligan et al., 2010; Cubillos et al.,
iments studied here, dominated by E. huxleyi and Gephyro- 2007), which was interpreted as a minimum thermal toler-
capsa species, agrees well with assemblages found in nearby ance of 1 ◦ C for this taxon in the SO. This is supported by
surface sediment stations located further north offshore Chile culture experiments which found out that temperature was
(Saavedra-Pellitero et al., 2010, 2011) as well as to those the most important driver controlling both cellular particu-
found in overlying plankton samples (e.g. Menschel et al., late organic and inorganic carbon content in E. huxleyi (Feng
2016; Saavedra-Pellitero et al., 2019). Some species are iden- et al., 2018). However, differences in the composition of the
tified in both surface sediment and plankton samples (i.e. morphotypes within this species complex may indicate lo-
E. huxleyi, G. muellerae, C. leptoporus and Syracosphaera cally adapted populations with genotypes that have very dif-
spp.), while a few other species are only present in plankton ferent temperature sensitivities. The more common occur-
samples. Emiliania huxleyi is the dominant species present rence of heavily calcified E. huxleyi types A overcalcified
in all the surface sediment samples from the study area, and R offshore Chile (Fig. 5) are well in accordance with ob-
found even in samples in the SZ + CZ and AZ (see Fig. 4). servations with plankton studies from the study area (e.g. von
This species dominates the coccolithophore communities in Dassow et al., 2018; Saavedra-Pellitero et al., 2019) and may
the open-ocean surface waters of the study area (e.g. Char- indicate an adaptation to the physicochemical conditions in
alampopoulou et al., 2016; Saavedra-Pellitero et al., 2019), the CHC. In addition, a similar shift in the morphotype com-
but it was also the dominant coccolith species in sediment position of E. huxleyi assemblages towards morphogroup B
traps of the SAZ and AZ south of Tasmania (Rigual Hernán- in the AZ (Fig. 5) along the Patagonian Shelf and in the Aus-
dez et al., 2018, 2020c) and of the AZ on the Kerguelen tralian sector (Poulton et al., 2011; Cubillos et al., 2007) was
Plateau (Rembauville et al., 2016). Furthermore, it was also interpreted as shift in dominance of different ecotypes. This
the only coccolithophore widely distributed along the fjords highlights the important role of the variation in E. huxleyi
and inner channels of southern Patagonia (Díaz-Rosas et al., morphotypes on the control of coccolith shape and stresses
Biogeosciences, 19, 585–612, 2022 https://doi.org/10.5194/bg-19-585-2022N. M. Vollmar et al.: Coccoliths in surface sediments across the Drake Passage 597 that any morphometrical information should not be inter- plays an important role in shaping the structure of the coc- preted isolated from morphotypic information. colithophore community offshore Chile and broadly north of Calcidiscus leptoporus, G. muellerae and G. ericsonii are the PF. common species in the surface sediments off southern Chile (Fig. 4). While C. leptoporus was often present in relatively 5.2 Distribution of coccoliths in the DP high abundances also in the plankton of the study area up to the PF (Saavedra-Pellitero et al., 2019), G. muellerae South of the PF, coccolith abundances in surface sediments and G. ericsonii have been described mainly further north are strikingly lower than at the Chilean margin, but coccol- in the SAZ (Menschel et al., 2016; von Dassow et al., iths are still relatively common in this area (up to 650 × 2018; Saavedra-Pellitero et al., 2019). These species were 106 Coc/g sed.). It is also noticeable that a decrease in coccol- also secondary components of the coccolith sinking assem- ith diversity is not observed in the present surface sediment blages in sediment traps located in the SAZ south of Tas- samples (Fig. 3). Thus, the situation south of the PF con- mania (Rigual Hernández et al., 2020c). Calcidiscus lepto- trasts with the rapid decline in diversity and coccolithophore porus is generally known as a species with a tendency to be abundance observed in plankton samples in the DP and in found towards cool waters and moderately to highly nutrient- other sectors of the SO (e.g. Gravalosa et al., 2008; Saavedra- rich environments (Boeckel et al., 2006; Baumann et al., Pellitero et al., 2014; Malinverno et al., 2015; Charalam- 2016). Gephyrocapsa muellerae has also been observed in popoulou et al., 2016; Saavedra-Pellitero et al., 2019). At cold and nutrient-rich environments characterized by high the same time, no analogues were found between the species productivity (Saavedra-Pellitero et al., 2010) and temperate assemblages of a subset of surface samples and the near- and mesotrophic regions (Boeckel et al., 2006). The species est plankton samples from Saavedra-Pellitero et al. (2019) was even found at moderate abundances (up to 36 % of to- (see Fig. A3). This discrepancy could be explained by the tal numbers) south of the Falkland Islands and close to the episodic nature of coccolithophore bloom events south of the SAF (Charalampopoulou et al., 2016). Gephyrocapsa eric- PF (Balch et al., 2014; Winter et al., 2014), which might not sonii was linked to cool and fresh surface waters especially in have coincided with the timing of the plankton sampling in upwelling or frontal mixing zones, for example at the Chilean the DP, while the sediment record in surface samples aver- coast (Saavedra-Pellitero et al., 2010) or at the Argentinean ages hundreds or even thousands of years. margin, where the Malvinas Current and the SAF transport Emiliania huxleyi remains the dominant species in the Antarctic waters northward (Boeckel et al., 2006). Thus, the DP and is – as off southern Chile – accompanied not only common abundances of these species in the study area could by G. muellerae and C. leptoporus but also by relatively be explained by their preference for mixed and moderately dissolution-resistant taxa such as G. oceanica and F. pro- to highly nutrient-rich environments, where high productiv- funda. While the latter species are selectively enriched here ity occurs. The slight discrepancy between the continuous due to the dissolution of the smaller and more fragile taxa, presence of C. leptoporus, G. muellerae and G. ericsonii in some other species are not even observed in the overlying sediment and their episodic occurrence in plankton could be plankton samples offshore southern Chile and across the DP. due to the episodic coccolithophore blooming, which might These subordinate taxa found in DP sediments are more typ- not have coincided with the timing of the plankton sampling. ical of lower latitudes where they usually live in warmer sur- This finding is supported by the pronounced seasonality in face waters. For example, one of the taxon found in unusual the coccolith fluxes with marked intensifications during the abundances at these high latitudes is F. profunda, which is peak blooming season in austral summer (Rigual Hernández a typical subtropical–temperate species that dwells in the et al., 2018, 2020c). In this regard, the coccolith content and lower photic zone and is rarely present in high abundance diversity in surface sediments would represent a smoothed at latitudes outside 30◦ N and S (Hernández-Almeida et al., multi-annual signal, being potentially more representative of 2019). Some of these low-latitude species were found in sur- the conditions in the overlying surface ocean. face water samples retrieved via the ship’s water pump sys- Coccolith species occurrence documented in the present tem by Winter et al. (1999) during a cruise in austral autumn SAZ surface sediments is consistent with previous reports on 1992 in the Weddell Sea, east of the DP. Species belonging to coccolithophore assemblage compositions in the surface wa- the genus Syracosphaera were mostly found offshore Chile ters (Findlay and Giraudeau, 2000; Saavedra-Pellitero et al., and in the SAZ, in agreement with previous plankton studies 2014; Malinverno et al., 2015; Charalampopoulou et al., in the DP (Charalampopoulou et al., 2016; Saavedra-Pellitero 2016), sediment traps (Rigual Hernández et al., 2020c) and et al., 2019), but they were also found in the AZ. Although surface sediments (Findlay and Giraudeau, 2000; Saavedra- different authors also found taxa of this genus in the SO Pellitero and Baumann, 2015) and are more diverse than (e.g. Findlay and Giraudeau, 2000; Saavedra-Pellitero et al., those found in the AZ sediment traps (Rembauville et al., 2014), it was never observed so close to Antarctica, except by 2016; Rigual Hernández et al., 2018). Thus, the generally Winter et al. (1999). However, Syracosphaera species have good agreement between (sub-)fossil sediment samples and been described from a very similar setting off southeastern living assemblages indicate that the regional oceanography Greenland (Balestra et al., 2004). There, a quite diverse upper https://doi.org/10.5194/bg-19-585-2022 Biogeosciences, 19, 585–612, 2022
You can also read