Observational needs of sea surface temperature - University ...
←
→
Page content transcription
If your browser does not render page correctly, please read the page content below

Observational needs of sea surface
temperature
Article

Published Version

Creative Commons: Attribution 4.0 (CC-BY)

Open access

O'Carroll, A. G., Armstrong, E. M., Beggs, H. M., Bouali, M.,
Casey, K. S., Corlett, G. K., Dash, P., Donlon, C. J.,
Gentemann, C. L., Hoyer, J. L., Ignatov, A., Kabobah, K.,
Kachi, M., Kurihara, Y., Karagali, I., Maturi, E., Merchant, C.
J., Marullo, S., Minnett, P., Pennybacker, M., Ramakrishnan,
B., Santoleri, R., Sunder, S., Saux Picart, S., Vazquez-
Cuervo, J. and Wimmer, W. (2019) Observational needs of
sea surface temperature. Frontiers in Marine Science, 6. 420.
ISSN 2296-7745 doi:
https://doi.org/10.3389/fmars.2019.00420 Available at
http://centaur.reading.ac.uk/85700/

It is advisable to refer to the publisher’s version if you intend to cite from the
work. See Guidance on citing .
Published version at: https://www.frontiersin.org/articles/10.3389/fmars.2019.00420/full
To link to this article DOI: http://dx.doi.org/10.3389/fmars.2019.00420

Publisher: Frontiers Media S.A.

All outputs in CentAUR are protected by Intellectual Property Rights law,
including copyright law. Copyright and IPR is retained by the creators or other
copyright holders. Terms and conditions for use of this material are defined in
the End User Agreement .

www.reading.ac.uk/centaur

CentAUR

Central Archive at the University of Reading
Reading’s research outputs online

REVIEW
                                                                                                                                            published: 20 August 2019
                                                                                                                                       doi: 10.3389/fmars.2019.00420

                                            Observational Needs of Sea
                                            Surface Temperature
                                            Anne G. O’Carroll 1* , Edward M. Armstrong 2 , Helen M. Beggs 3 , Marouan Bouali 4 ,
                                            Kenneth S. Casey 5 , Gary K. Corlett 1 , Prasanjit Dash 6 , Craig J. Donlon 7 ,
                                            Chelle L. Gentemann 8 , Jacob L. Høyer 9 , Alexander Ignatov 6 , Kamila Kabobah 10 ,
                                            Misako Kachi 11 , Yukio Kurihara 11 , Ioanna Karagali 12 , Eileen Maturi 6 ,
                                            Christopher J. Merchant 13 , Salvatore Marullo 14 , Peter J. Minnett 15 ,
                                            Matthew Pennybacker 6 , Balaji Ramakrishnan 16 , RAAJ Ramsankaran 16 ,
                                            Rosalia Santoleri 15 , Swathy Sunder 16 , Stéphane Saux Picart 17 , Jorge Vázquez-Cuervo 2
                                            and Werenfrid Wimmer 18
                                            1
                                              EUMETSAT, Darmstadt, Germany, 2 NASA Jet Propulsion Laboratory/California Institute of Technology, Pasadena, CA,
                        Edited by:          United States, 3 Bureau of Meteorology, Melbourne, VIC, Australia, 4 Institute of Oceanography, Universidade de São Paulo,
                   Sabrina Speich,          São Paulo, Brazil, 5 NOAA NCEI, Silver Spring, MD, United States, 6 NOAA STAR, College Park, MD, United States, 7 ESA
   École Normale Supérieure, France         ESTEC, Noordwijk, Netherlands, 8 Earth & Space Research, Seattle, WA, United States, 9 Danish Meteorological Institute,
                       Reviewed by:         Copenhagen, Denmark, 10 Earth Observation Research and Innovation Centre, University of Energy and Natural Resource,
                      Gilles Reverdin,      Sunyani, Ghana, 11 Earth Observation Research Center, Japan Aerospace Exploration Agency, Chofu, Japan, 12 Department
     Centre National de la Recherche        of Wind Energy, Technical University of Denmark, Roskilde, Denmark, 13 Department of Meteorology, University of Reading,
         Scientifique (CNRS), France        Reading, United Kingdom, 14 ENEA, ISAC-CNR, Frascati, Italy, 15 Rosenstiel School of Marine and Atmospheric Science,
               Alberto Ricardo Piola,       University of Miami, Miami, FL, United States, 16 Department of Civil Engineering, Indian Institute of Technology Bombay,
        Naval Hydrographic Service,         Mumbai, India, 17 CNRM, Université de Toulouse, Météo-France, CNRS, Lannion, France, 18 Ocean and Earth Science,
                             Argentina      University of Southampton, Southampton, United Kingdom

                 *Correspondence:
                    Anne G.O’Carroll        Sea surface temperature (SST) is a fundamental physical variable for understanding,
           anne.ocarroll@eumetsat.int
                                            quantifying and predicting complex interactions between the ocean and the
                   Specialty section:       atmosphere. Such processes determine how heat from the sun is redistributed across
         This article was submitted to
                                            the global oceans, directly impacting large- and small-scale weather and climate
                   Ocean Observation,
               a section of the journal     patterns. The provision of daily maps of global SST for operational systems, climate
          Frontiers in Marine Science       modeling and the broader scientific community is now a mature and sustained
         Received: 31 October 2018          service coordinated by the Group for High Resolution Sea Surface Temperature
            Accepted: 05 July 2019
         Published: 20 August 2019
                                            (GHRSST) and the CEOS SST Virtual Constellation (CEOS SST-VC). Data streams are
                             Citation:
                                            shared, indexed, processed, quality controlled, analyzed, and documented within a
        O’Carroll AG, Armstrong EM,         Regional/Global Task Sharing (R/GTS) framework, which is implemented internationally
     Beggs HM, Bouali M, Casey KS,
                                            in a distributed manner. Products rely on a combination of low-Earth orbit infrared
      Corlett GK, Dash P, Donlon CJ,
 Gentemann CL, Høyer JL, Ignatov A,         and microwave satellite imagery, geostationary orbit infrared satellite imagery, and
     Kabobah K, Kachi M, Kurihara Y,        in situ data from moored and drifting buoys, Argo floats, and a suite of independent,
    Karagali I, Maturi E, Merchant CJ,
                 Marullo S, Minnett PJ,
                                            fully characterized and traceable in situ measurements for product validation (Fiducial
   Pennybacker M, Ramakrishnan B,           Reference Measurements, FRM). Research and development continues to tackle
         Ramsankaran R, Santoleri R,
                                            problems such as instrument calibration, algorithm development, diurnal variability,
             Sunder S, Saux Picart S,
   Vázquez-Cuervo J and Wimmer W            derivation of high-quality skin and depth temperatures, and areas of specific interest
  (2019) Observational Needs of Sea         such as the high latitudes and coastal areas. In this white paper, we review progress
                 Surface Temperature.
                Front. Mar. Sci. 6:420.
                                            versus the challenges we set out 10 years ago in a previous paper, highlight
     doi: 10.3389/fmars.2019.00420          remaining and new research and development challenges for the next 10 years

Frontiers in Marine Science | www.frontiersin.org                                  1                                              August 2019 | Volume 6 | Article 420
O’Carroll et al.                                                                                                 Observational Needs of Sea Surface Temperature

                                            (such as the need for sustained continuity of passive microwave SST using a 6.9 GHz
                                            channel), and conclude with needs to achieve an integrated global high-resolution SST
                                            observing system, with focus on satellite observations exploited in conjunction with
                                            in situ SSTs. The paper directly relates to the theme of Data Information Systems
                                            and also contributes to Ocean Observing Governance and Ocean Technology and
                                            Networks within the OceanObs2019 objectives. Applications of SST contribute to
                                            all the seven societal benefits, covering Discovery; Ecosystem Health & Biodiversity;
                                            Climate Variability & Change; Water, Food, & Energy Security; Pollution & Human Health;
                                            Hazards and Maritime Safety; and the Blue Economy.
                                            Keywords: sea surface temperature, observations, GHRSST, satellite, in situ, Fiducial Reference Measurements,
                                            operational oceanography, climate data records

INTRODUCTION                                                                      or higher, an accuracy of 0.2◦ C or better, and updated every 6 h
                                                                                  (Smith and Koblinsky, 2001). The establishment of the Group for
Sea surface temperature (SST) is a fundamental variable                           High Resolution Sea Surface Temperature, GHRSST (previously,
for understanding, monitoring and predicting fluxes of heat,                      GODAE High-Resolution Sea Surface Temperature Pilot Project)
momentum and gases at a variety of scales that determine                          addressed these specifications (Donlon et al., 2009). GHRSST is a
complex interactions between the atmosphere and ocean. SST at                     self-organizing group of researchers and operational practitioners
the ocean-atmosphere interface has a significant societal impact,                 working together to improve the accuracy and availability of SST
through, e.g., large ocean gyres and atmospheric circulation cells                fields for all applications.
influencing weather and climate, weather systems and severe                           To achieve the GODAE requirement, GHRSST devised
storms and local scale phenomena, such as the generation of sea                   an integrated approach to develop an SST observing system
breezes and convective clouds.                                                    comprising: (1) improved SST data assembly/delivery;
    Mapping SST is now the responsibility of operational                          (2) quantified SST product accuracy; (3) improved consistency
monitoring and forecasting agencies (Robinson et al., 2012) as                    of SST products; and (4) demonstrated benefits for the improved
accurate knowledge of global SST distribution and temporal                        observing system. Over the past 10 years, GHRSST has continued
variation is a key input to forecasting and prediction systems. SST               to support the delivery of operational SST data to the user
fields constrain upper-ocean circulation and thermal structure on                 community1 and confirmed that the requirements of GODAE
daily, seasonal, decadal and climatic timescales, for the exchange                can be met (with the exception of accuracy). Much progress has
of energy between the ocean and atmosphere in coupled ocean-                      been made on the inter-comparison of SST products, through
atmosphere models, and as boundary conditions for ocean,                          activities such as the SST Quality Monitor (SQUAM2 ; Dash et al.,
weather and seasonal forecasting models. Other applications                       2010), in situ SST quality monitor (iQuam3 ; Xu and Ignatov,
include maritime safety, military operations, ecosystem                           2014), ACSPO Regional Monitor for SST (ARMS4 ) and Felyx5 .
assessment, supporting fisheries and tourism, transport and                       Progress has been also made on SST applications, including
energy, human health, food security and environmental policy.                     assimilation and demonstrating the benefit of the improved
Well-defined and error-quantified measurements of SST are also                    observing system. Many users now assimilate SST in the global
required in the form of climate data records (CDRs) to reveal the                 and regional models to provide continuous data and information
role of the ocean in short and long term climate variability.                     on the physical state, variability and dynamics of the global ocean
    A sustained operational stream of satellite SST measurements                  and marine ecosystems.
has been available since 1981, which together with in situ                            This paper focuses mainly on the progress and challenges
measurements collectively form the modern-era SST observing                       for satellite SSTs over the past decade and continuing into the
system. By 1998, SST data were a mature component of                              next decade. Fiducial Reference Measurements (FRM) and in situ
the observing system with demonstrated capability and data                        data are described with respect to satellite validation activities
products. However, SST product availability was limited to a                      and ensuring traceability for climate records. Centurioni et al.
few data sets that were large, scientific in format and difficult                 (2019), Kent et al. (2019), and Smith et al. (2019) address these
to exchange in near real time (NRT). Furthermore, product                         surface-based observations in more detail. We conclude with a
accuracy was insufficient for the emerging ocean modeling and                     community-consensus vision for the next decade and beyond as
data assimilation communities, while at the same time the                         a set of recommendations.
number of applications requiring accurate spatial high-resolution
SST was growing.                                                                  1
                                                                                    https://www.ghrsst.org/quick-start-guide/
    To address these issues, the Global Ocean Data Assimilation                   2
                                                                                    http://www.star.nesdis.noaa.gov/sod/sst/squam
Experiment (GODAE; Bell et al., 2009) defined a minimum data                      3
                                                                                    http://www.star.nesdis.noaa.gov/sod/sst/iquam
specification for use in operational ocean models, requiring SST                  4
                                                                                    http://www.star.nesdis.noaa.gov/sod/sst/arms/
observations with global coverage, a spatial resolution of 10 km                  5
                                                                                    http://hrdds.ifremer.fr/

Frontiers in Marine Science | www.frontiersin.org                             2                                               August 2019 | Volume 6 | Article 420
O’Carroll et al.                                                                                         Observational Needs of Sea Surface Temperature

SST’S ROLE IN AN INTEGRATED OCEAN                                             the presence of clouds, except where there is heavy rainfall.
OBSERVING SYSTEM                                                              In contrast, satellite IR measurements are strongly influenced
                                                                              by scattering and emission from clouds, with the consequence
Understanding oceanic and atmospheric processes requires                      that only measurements taken through clear atmospheres can
knowledge of the temperature at which these processes occur.                  be used to derive SSTskin . Effective “cloud-screening” algorithms
Processes at the ocean surface include radiative emission peaking             are needed to ensure derived SSTskin values are not tainted
in the infrared (IR), solubility of gasses (including CO2 and                 (Kilpatrick et al., 2001; Merchant et al., 2005). Merging SST
therefore ocean-atmosphere gas fluxes), evaporation (the latent               retrievals from IR and MW sensors together with in situ data on
heat flux), and sensible heat flux associated with the air–sea                any given day is a widely accepted approach to derive global fields
temperature difference (which also influences the momentum                    (e.g., Chin et al., 2017).
fluxes from atmosphere to ocean). The atmospheric and oceanic
vertical temperature profile near the air–sea interface affect the            An Increasing Number and Diversity of
stability and effectiveness of turbulent exchanges, and thus they             Satellite Observations
influence the magnitudes of air–sea fluxes (Lindzen and Nigam,                Since satellite SST observations began in the early 1980s, the
1987; Fairall et al., 2003; Kara et al., 2005). Profiles of temperature       number and diversity of sensors has increased dramatically, and
throughout the ocean depth have indicated a warming of the                    is ever evolving. A combination of IR (onboard both low-Earth
oceans over the past six decades, the period for which such                   orbiters, LEO, and geostationary, GEO, platforms) and PMW
measurements are available (Levitus et al., 2012).                            (LEO only) radiometers provide a comprehensive global SST
   Satellite remote sensing has provided a mechanism for                      constellation, capable of meeting users’ needs across a wide range
deriving SST on global scales over decades and needs to be                    of scales by exploiting their different capabilities and strengths.
sustained, improved, reconciled and extended into the next                    Figure 1 indicates the main satellite missions contributing to the
decade and beyond. The uninterrupted time-series of global,                   current and recent SST constellation. Continuity and redundancy
high resolution (∼4–10 km) SSTs retrieved from satellite IR                   is ensured primarily by meteorological agencies’ space programs,
radiometers extends back to the early 1980s (Kilpatrick et al.,               as well as initiatives such as Copernicus. It is vital to continue
2001), and SSTs from passive microwave (PMW) radiometers                      innovation to improve the resolution and accuracy of the SST
back to late 1997 in the tropics, and 2002 globally. In the                   fields. Table 1 lists the satellite SST measurement constellation at
framework of an integrated ocean observing system, satellite-                 the present time, noting that further changes and developments
derived SST fields provide information on upper ocean variability             are taking place to the constellation over the next decade and are
and processes (e.g., Legeckis, 1977; Cornillon, 1986; Gentemann               summarized in the following sections.
et al., 2008; Liu and Minnett, 2015) and on air–sea interactions
(e.g., Chelton et al., 2001; O’Neill et al., 2012). The current               Polar-Orbit IR SST Capability
constellation of satellites produces global measurements of                   IR radiometers on LEO satellites provide high spatial resolution
SST at accuracies useful for many scientific, operational and                 SST with global coverage of the Earth up to twice daily
climate purposes.                                                             at the equator, and more frequently in the higher latitudes.
                                                                              Current retrieval methods and sensor technologies enable highly
                                                                              accurate IR SST retrievals, yielding global monthly differences
THE SST MEASUREMENT                                                           around 0.2◦ C with standard deviations around 0.4◦ C during
CONSTELLATION                                                                 night-time (e.g., Petrenko et al., 2014; Wang et al., 2016).
                                                                              Progress in IR SST also significantly reduced regional and
Measurements of SST are made in situ with contact thermometers                seasonal differences inherent with non-linear SST (NLSST)
and retrieved from IR and PMW radiometers on satellites                       retrieval algorithms (e.g., Merchant et al., 2009a; Marsouin et al.,
(for example, see Walton et al., 1998; Merchant et al., 2009b;                2015). SST products cover Level 2 (original swath projection,
Gentemann et al., 2010; Koner and Harris, 2016). IR- and PMW-                 with native spatial resolution) to regional and global Level 3
derived SSTs have different and complementary characteristics.                products, remapped and composited over areas and times defined
IR emission at the ocean surface originates in a very thin                    by user needs.
electromagnetic skin layer of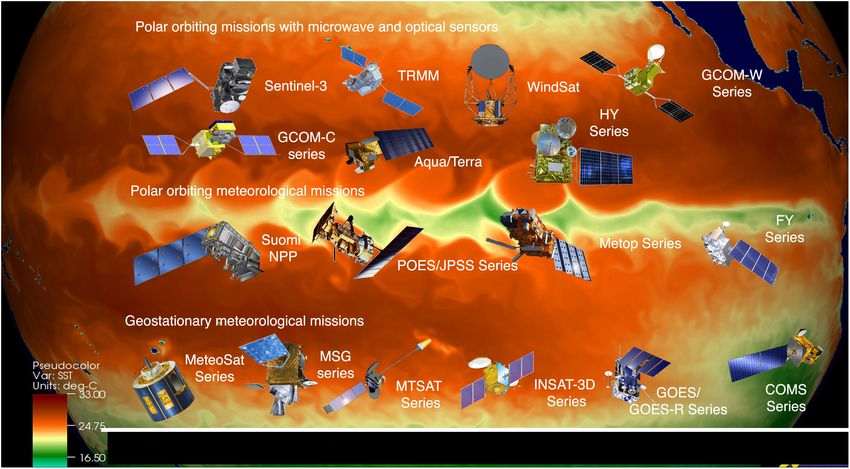
O’Carroll et al.                                                                                                     Observational Needs of Sea Surface Temperature

  FIGURE 1 | The main satellite missions contributing to the current SST constellation. (Reproduced by permission under CC BY 4.0 from http://doi.org/10.6084/m9.
  figshare.7291694.

Organisation for the Exploitation of Meteorological Satellites                          All these new-generation sensors capture IR images every
(EUMETSAT) Polar System (EPS) Meteorological Operational                             10–15 min with 2 km nadir resolution (except FY-4, which
Second Generation (Metop-SG) program will include the visible                        takes images every 30 min with 4 km resolution at nadir)
and infrared imager (METimage, Wallner et al., 2017), which will                     and have multiple spectral bands, sampling in the atmospheric
have 20 spectral bands channels, at 500 m resolution at nadir.                       windows around 3.7, 8.6, and 10–12 µm suitable for SST
In December 2017, Japan Aerospace Exploration Agency (JAXA)                          retrievals. Other currently available GEO sensors with SST
launched the Global Change Observation Mission – Climate                             capability are the Spinning Enhanced Visible and Infrared Imager
(GCOM-C or “Shikisai”) satellite carrying the Second-generation                      (SEVIRI) on Meteosat Second Generation (Meteosat-8, -9, -10,
Global Imager (SGLI) with 19 spectral bands, and switchable                          and -11), and the Multi-Spectral Imager onboard the Insat-
resolution from 250 to 1,000 m at nadir (Urabe et al., 2018).                        3D/3DR. The full constellation of geostationary satellites provides
Other instruments enabling SST retrieval include the Visible and                     nearly global coverage, missing only high latitudes. There should
InfraRed Radiometer (VIRR) on board the Chinese Feng-Yun                             always be a constellation of 5–6 geostationary platforms with
satellites (Dong et al., 2009; Yang A. et al., 2017).                                SST-capable sensors.
                                                                                        An important feature of new generation GEO sensors is their
Geostationary-Orbit Infrared SST Capability                                          capability to take measurements at high temporal resolution
In contrast to LEO, GEO satellites provide many images                               to improve clear-sky masking (e.g., using temporal information
each day over a fixed geographic region. New-generation                              to separate the effects of faster moving clouds and other
GEO sensors include: the Advanced Baseline Imager (ABI;                              atmospheric features from the slower evolving SST fields). This
Schmit et al., 2005, 2017) onboard NOAA GOES-16 and -17                              approach can significantly improve coverage by using SSTs from
(launched in November 2016 and March 2017, respectively,                             successive clear-sky data allowing better characterization of the
and designated as NOAA operational GOES-East and –West                               SST diurnal cycle (Gladkova et al., in review). Moreover, data
satellites in December 2018 and February 2019, respectively);                        volumes can be significantly reduced by providing a product at
the Advanced Himawari Imager (AHI, a twin to ABI; Bessho                             a reduced temporal rate (e.g., hourly) but still sufficient to resolve
et al., 2016), onboard Himawari-8 and -9 (launched in                                the diurnal cycle. Also, the sensitivity of the retrieval algorithm
October 2014 and November 2016, respectively); the Advanced                          to real changes in temperature (Merchant et al., 2009a) is critical
Meteorological Imager (AMI, another ABI twin; Choi and Ho,                           to accurately measure the temporal variability in geostationary
2015) onboard Geo-Kompsat-2A (launched December 2018;                                SSTs, and in particular, to correctly estimate the amplitude of the
Kim et al., 2015); the Advanced Geosynchronous Radiation                             SST diurnal cycle. Additional applications benefiting from high-
Imager (AGRI; Yang J. et al., 2017) onboard the FY-4 series                          frequency SST variability include semi-diurnal tides and their
(FY-4A, launched in November 2016, will be followed by FY-                           impact on shelf sea fronts. An illustration of the footprint and
4B & C in 2019 and 2021, respectively); and the Flexible                             constellation of the global geostationary satellites can be found
Combined Imager (FCI; Durand et al., 2015) to be launched                            from the World Meteorological Organization (WMO)6 .
on EUMETSAT Meteosat Third Generation Imaging satellites
(MTG-I) beginning in 2021.                                                           6
                                                                                         http://www.wmo.int/pages/prog/sat/globalplanning_en.php

Frontiers in Marine Science | www.frontiersin.org                                4                                               August 2019 | Volume 6 | Article 420
Frontiers in Marine Science | www.frontiersin.org

                                                                                                                                                                                                                                                                                  O’Carroll et al.
                                                    TABLE 1 | Current platform and sensor characteristics with capability for sea surface temperature, specifying whether in GEO or LEO; IR or PMW; daily coverage; spatial resolution at nadir; position or orbit and equator
                                                    crossing time; agency and the expected lifetime till.

                                                                                                                                                                        Spatial resolution at                        Position/orbit                               Expected
                                                    Platform                     Sensor             GEO/LEO        IR/PMW                Coverage                       nadir (SST channels)                 (equator crossing time)              Agency          lifetime till

                                                    Meteosat1                     SEVIRI               GEO            IR         Full disk 15 min                                3 km                                     0◦                    EUMETSAT             2024
                                                    GOES-R (S/T/U)                 ABI                 GEO            IR         Full disk 10 min                                2 km                          E:   72.5◦ W   W: 137.2◦ E          NOAA              2036
                                                    Himawari                       AHI                 GEO            IR         Full disk 10 min                                2 km                                   140.7◦ E                   JMA               2031
                                                    FY-2                         S-VISSR               GEO            IR         Full disk 30 min                                5 km                                   86.5◦ E                    CMA               2022
                                                    FY-4                          AGRI                 GEO            IR         Full disk 15 min                                4 km                                    105◦ E                    CMA               2040
                                                    Electro-L                   MSU-GS                 GEO            IR         Full disk 15–30 min                             4 km                                    76◦ E                 RosHydroMet           2039
                                                    GEO-KOMPSAT                    AMI                 GEO            IR         Full disk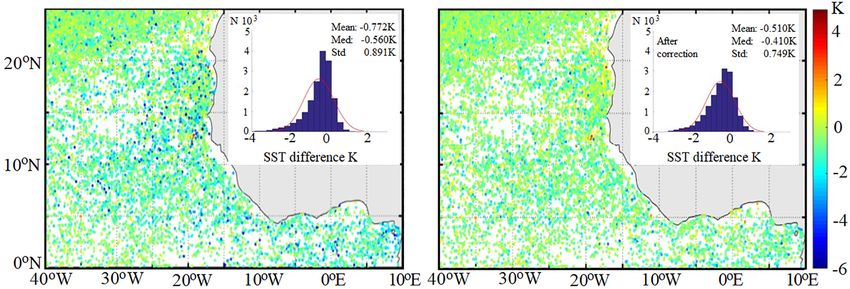
O’Carroll et al.                                                                                     Observational Needs of Sea Surface Temperature

Passive MW Polar-Orbiters and Low                                        forecasting systems, as well as understanding a changing climate,
Inclination Orbiting SST Capability                                      became the main drivers for collecting SST data. This evolution
PMW SST retrievals from LEO satellites (in both sun-                     reflected a change in the method of measurements from mainly
synchronous and non-sun-synchronous orbits) have been                    human operators on voluntary observing ships (VOS) to fully
collected for approximately 20 years, starting with the joint US-        automated measurements from buoys (and satellites). Satellite
Japan Tropical Rainfall Measuring Mission, launched in 1997,             measurements rely on in situ data for retrieval and validation
which carried the TRMM Microwave Imager (TMI; Wentz et al.,              (see section “Improved Methods of Validation”) and both sources
2000). TRMM was in a low inclination orbit so measurements               of SST are used in many applications, such as climate and
were limited to within about 40◦ of the Equator. To sample               weather model boundary conditions (Folland, 2005; Kennedy
the diurnal patterns in rainfall, TRMM was put in a sun-                 et al., 2012) and SST analysis products (e.g., Roberts-Jones et al.,
asynchronous drifting orbit. The NASA satellite, Aqua, launched          2012). Figure 2 shows the changes over time of geographical
in 2002 carried the Advanced Microwave Scanning Radiometer               coverage and method for in situ measurements, illustrating the
for EOS (AMSR-E; Kawanishi et al., 2003). Aqua is in a sun-              constraint of major shipping lanes have on the data collection and
synchronous, polar orbit. The first PMW producing global SSTs            the under-sampling of low and high latitudes.
started in 1978 with SMMR on SeaSat and Nimbus-7. A great                    The change in observation method not only expanded the
advantage of the PMW SSTs is in the cloud penetrating capability         geographical distribution of the in situ SST measurements
of low frequency microwaves to capture SST under most clouds             but also their quality. The changing requirements led to
and through atmospheric aerosols. These capabilities make PMW            international efforts to define a common set of requirements
SSTs an essential data source for producing multi-satellite merged       and standards with the implementation of the climate observing
SST products on a daily basis, though their spatial resolution is        system that is overseen and coordinated by the Global Climate
much coarser than IR SSTs. SST retrievals using PMW imagers              Observing System (GCOS) providing advice and guidance at
are based on low-frequency channels of 6.9 and 10.65 GHz                 national and international levels (e.g., GCOS, 2009, 2010).
that are sensitive to water temperature variations, but the SST          Coordination of specific activities is through the GCOS-affiliated
sensitivity of the 10.65 GHz emission decreases below SSTs colder        expert bodies and panels, such as the WMO/Intergovernmental
than 13◦ C (Gentemann et al., 2010).                                     Oceanographic Commission (IOC) Joint Technical Commission
    The spatial resolution of PMW SSTs depends on the antenna            for Oceanography and Marine Meteorology (JCOMM), Ship
size and satellite altitudes. Larger antennas and lower satellite        Observations Team (SOT), and the Data Buoy Cooperation
altitude result in finer spatial resolution, with the 10.65 GHz          Panel (DBCP) to name a few (Berry and Kent, 2017). Different
measurements having finer footprints than at 6.9 GHz. At                 applications of SST fields have varying accuracy requirements,
present, the finest spatial resolution of 6.9 GHz SST is about           with those for CDR being the most stringent and difficult to
35 × 62 km by AMSR2 on the Japanese GCOM-W satellite                     meet. Continuation of the Global Tropical Moored Buoy Array
launched in 2012, having a 2.0 m diameter antenna and 699 km             (GTMBA; McPhaden et al., 2010) is essential, as it has a major
altitude. The finest spatial resolution of 10.65 GHz SSTs is about       impact on methods to assess the stability of long-term SST data
19 × 32 km provided by Global Precipitation Measurement                  records (e.g., see for example Merchant et al., 2012).
(GPM) Microwave Imager (GMI) onboard the US-Japan joint                      Sea surface temperature is identified by the WMO as an
GPM Core Observatory (launched in 2014 into a low inclination            Essential Climate Variable (ECV7 ), among other parameters
orbit) with a 1.2 m diameter antenna and 402.5 km altitude.              (Bojinski, 2014), and a rigorous approach to data quality
Recent validation indicates the accuracy of PMW SSTs to be               assessment must be followed, such as recommended by Barker
around 0.5◦ C for 6.9 GHz, and 0.6◦ C for 10.65 GHz SSTs                 et al. (2015). Most notably, this means that in situ SST
by AMSR2 (JAXA, 2017). More research and international                   measurements should be accompanied by estimates of their
collaboration is recommended on harmonizing and improving                uncertainty, following formal metrological protocols (Joint
the calibration of low-level PMW observations across all available       Committee for Guides in Metrology (JCGM, 2008). These
missions. Further fundamental observation of and research                specifications should be followed for all SST products but are
into the dependence of sea-surface emissivity at SST-relevant            especially important if satellite-derived SSTs are to be used as a
frequencies on sea-state and wind speed will be crucial to driving       CDR (Minnett and Corlett, 2012). There are several approaches
future improvements in uncertainty in PMW SST.                           to estimate uncertainties of in situ measurements (e.g., Hirahara
                                                                         et al., 2014; Kennedy, 2014; Berry and Kent, 2017; Freeman et al.,
                                                                         2017). Broadly speaking, the uncertainties can be split into two
The Evolving in situ SST Observing                                       groups: uncertainties due to random errors, such as incorrect
System                                                                   readings or rounding errors; and uncertainties due to systematic
Measurements of SST have been made for more than 200 years               errors, such as incorrect calibration or poor positioning of the
for a wide variety of purposes. The earliest measurements of SST         measurement site. Although this is a convenient way to deal with
in the eighteenth century were taken as an aid to navigation.            the uncertainties, inaccuracies in SST measurements generally
Over a time and after the connection between SST and ocean               share characteristics (Kennedy, 2014). Most in situ SST datasets
currents was strengthened, large numbers of measurements were
made for the construction of navigational charts (Kennedy et al.,        7
                                                                          http://www.wmo.int/pages/prog/gcos/index.php?name=
2012). Gradually, data needs for weather and oceanographic               EssentialClimateVariables

Frontiers in Marine Science | www.frontiersin.org                    6                                           August 2019 | Volume 6 | Article 420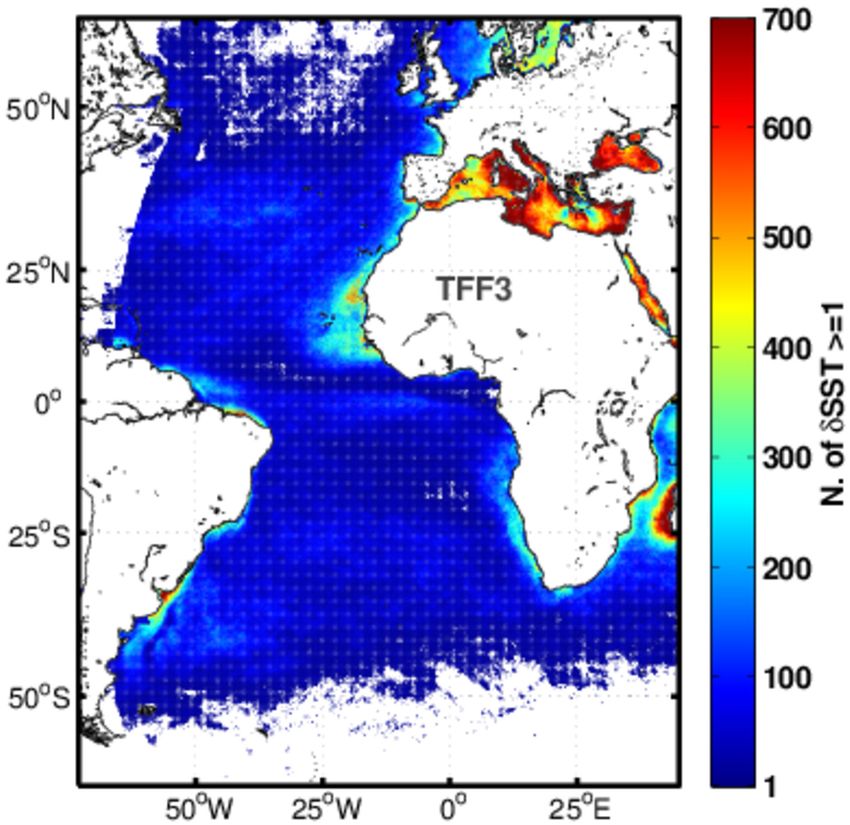
O’Carroll et al.                                                                                                    Observational Needs of Sea Surface Temperature

  FIGURE 2 | Distribution of SST measurements and by method. (A) Shows the spatial distribution of SST measurements as included in the World Ocean Atlas in
  2013. (B) Shows the temporal distribution of SST measurements in the World Ocean Atlas in 2013 (from Freeman et al., 2017). (C) How the measurement methods
  changed over time. ERI are Engine Room Intake measurements, Buoy measurements include drifting and moored buoys (from Rayner et al., 2018). Please note that
  the spatial and temporal time lines are different, 1955–2012 for the spatial distribution shown in plate (A) and 1770–2014 for the temporal distribution shown in
  plate (B).

(e.g., International Comprehensive Ocean-Atmosphere Data Set,                         in situ SST for satellite SST validation in regions lacking in
ICOADS, and the Hadley Centre SST Dataset, HadSST3) include                           drifting or moored buoys, such as coastal regions and in the
an estimate of a correction for the systematic component based                        Australian region (Beggs et al., 2012).
on measurement type (e.g., bucket, engine room intake or buoy),                          While the effort to characterize uncertainties for in situ SST
which can reduce discontinuities in the long time records.                            records is considerable not all of them are SI-traceable, in
Kennedy (2014) states that a typical SST measurement made by                          a metrological sense, which is needed for a CDR. Therefore,
a ship has an uncertainty of around 1.0–1.5◦ C and a drifting                         more recent efforts using ship-based infrared radiometers for
buoy observation a typical uncertainty of around 0.1–0.7◦ C.                          satellite-derived SST validation have shown the value of SI-
Vessels with well-calibrated and suitably located temperature                         traceable measurements, together with rigorous uncertainty
sensors can provide SST measurements with similar uncertainties                       budgets (Barton et al., 2004; Rice et al., 2004; Donlon et al.,
to currently deployed drifting buoys, and can therefore provide                       2008; Minnett, 2010; Wimmer and Robinson, 2016) of 0.14◦ C

Frontiers in Marine Science | www.frontiersin.org                                 7                                              August 2019 | Volume 6 | Article 420
O’Carroll et al.                                                                                      Observational Needs of Sea Surface Temperature

(Theocharous et al., 2016), or better. However, the measurements           dramatically improve cloud masking, by separating fast-moving
are sparse compared to those of drifting buoys. Continued                  atmospheric features from more slowly evolving ocean patterns
studies and activities are needed on the inter-comparison of               (Gladkova et al., in review; see example in Figure 3). While not
FRM (Donlon et al., 2015) with data; the estimation and                    all clouds can be identified in this way, it offers a computationally
provision of the measurement uncertainties; and ensuring                   effective improvement over using only static spatial information.
SI-traceability is established through international collaboration.            All current methods are formulated to deliver either a binary
In an effort to improve the sampling of SI-traceable in situ               mask or a continuous score (e.g., probability of clear sky) that
SSTs, a new generation of drifting buoys is being designed and             can be used to derive quality information. Albeit differently, all
tested through efforts of GHRSST, DBCP, European Union’s                   methods embed prior knowledge of the physical and radiative
Copernicus Programme and EUMETSAT (Poli et al., 2019).                     transfer properties of the surface, clouds and atmosphere. In
These efforts to improve in situ records are continuing and                dynamic and coastal regions of the ocean, and around ice,
require considerable resources to improve the in situ SSTs not             uncertainty in the prior SST is larger, and misclassification more
only as a standalone CDR but also as a verification tool for               likely. In general, dependence on prior information should be
satellite-derived SST fields. It is important that improvements            minimized wherever reliable classification can be made from
in correct metadata provision to in situ records continue                  the satellite observations themselves, which is aided by new SST
to be made. Data from Argo profilers in the near surface                   sensors that provide measurements in more bands, and at higher
layer are used for satellite SST validation, particularly those            spatial and temporal resolution.
specifically designed to acquire SST close to the sea surface. These
data could be further exploited to explore SST at depth and                More Accurate SST Retrieval Through
validate near-surface profiles. Additional in situ measurements,           Aerosol-Laden Atmospheres
and ideally FRM, are required, especially in high-latitude and             Sea surface temperature retrievals from IR measurements are
sea ice regions.                                                           susceptible to forms of aerosol that absorb and scatter IR
                                                                           radiation, particularly mineral dust (such as lofted from the
Improving Current and Future SST                                           Sahara Desert) and stratospheric volcanic aerosol following
Measurements for Users                                                     major SO2 -rich eruptions (the last being Mt. Pinatubo in 1991).
The increased number of SST products and large number                      Many SST algorithms have little robustness to such events
of users makes user-driven developments within the current                 (Blackmore et al., 2012) and will be subject to significant errors.
and future SST products essential. Comments and feedback                   Figure 4 indicates the influence of Saharan dust aerosol outflows
are typically obtained through dedicated science and user                  on satellite SST retrievals, over the Atlantic Ocean and the
meetings (such as the annual GHRSST meeting), which allow                  benefits of a correction algorithm (Luo et al., 2019). Intermittent
data producers to collect information to guide future product              mineral-dust loadings cause variable SST errors, which have
developments. This section presents and discusses necessary                negative implications for prediction of important phenomena
developments to provide improvements highlighted by users                  including monsoonal systems, as well as for other applications
as the most important for their application, such as: cloud                (Atkinson et al., 2013, 2015).
masking, aerosol impact assessment, uncertainty estimation,                   Dual-view SSTs from sensors such as SLSTR are less sensitive
diurnal variability, and validation.                                       to mineral dust than single-view sensors (Merchant et al., 1999).
                                                                           The exploitation of non-traditional SST bands should also help
Improved Cloud Masking of IR Imagery                                       reduce dust-related biases. Microwave SSTs are expected to be
About 80–90% of pixels are fully or partially cloudy in any                unaffected by mineral dust. Nonetheless, improvements in SST
IR imagery of the ocean, and it is critically important to                 retrieval in mineral-dust conditions is possible and is needed,
identify (and remove) these pixels. Clouds are colder and more             and should involve efforts both on single-sensor algorithms and
reflective, more variable in space/time, and have a particular             optimum use of the constellation of sensors.
IR spectral emissivity, compared to clear ocean. Cloud masking                Some current (MODIS and VIIRS) and planned (METimage)
algorithms for SST make use of the spectral, spatial, and temporal         sensors have more than one channel around 3.9 µm. With
characteristics of the sensor brightness temperatures (BTs); solar         the information content of these channels, the potential for
reflectance bands may be additionally employed during daytime.             more accurate SST retrievals in the presence of aerosols arises
Methods currently used are threshold-based (e.g., Saunders and             (Merchant et al., 2006), but this is yet to be widely exploited. It is
Kriebel, 1988; Kilpatrick et al., 2001; Petrenko et al., 2010),            recommended that studies to address this are pursued to improve
probabilistic (based on blending physically and empirically                SST accuracy in areas of mineral dust aerosol and introduce
derived joint probability distributions, in conjunction with Bayes’        resilience to major volcanic eruptions, which although rare will
theorem; e.g., Merchant et al., 2005), or trained using artificial         occur in future.
intelligence (AI) approaches (e.g., Kilpatrick et al., 2019).
    For LEO sensors, an additional spatial pattern recognition             Better Uncertainty and Error Estimation
approach has been found useful (Gladkova et al., 2015). Also,              Users of SST increasingly demand uncertainty information, to
repeated sampling of the same area of the ocean, from different            give greater context for their applications and for quantitative
passes or satellites, may be utilized (Gladkova et al., 2019).             use in systems such as data assimilation (ECMWF Workshop
For GEO, frequent sampling provides a valuable opportunity to              Report, 2018). Good-practice guidance for uncertainty provision

Frontiers in Marine Science | www.frontiersin.org                      8                                          August 2019 | Volume 6 | Article 420
O’Carroll et al. Observational Needs of Sea Surface Temperature FIGURE 3 | An example of using the temporal context information available from the ABI on GOES-16. The image at lower left is the sampled instantaneous SST at 17UTC. At lower right is collated SST, produced using an algorithm described in Gladkova et al. (in review) that examines 6 h of temporal data to detect residual cloud from drop-outs in the SST time series, and to fill short temporal gaps by noise-tolerant curve fitting. The collated product significantly increases clear-sky coverage, and reduces cloud leakages and noise in the imagery. (Reproduced by permission under CC BY 4.0 from http://doi.org/10.6084/m9.figshare.7286267.v2). FIGURE 4 | Night-time differences between SSTskin derived from MODIS on Aqua, and collocated, coincident subsurface temperatures from drifting buoys off West Africa, a region frequently subjected to the influence of Sahara dust aerosol outflows to the west and southwest, after Luo et al. (2019). The temperature differences are indicated by colors, as given on the right-hand scale in K. (A) With the standard MODIS SSTskin atmospheric correction algorithm based on measurements at λ = 11 and 12 µm (Kilpatrick et al., 2015), indicating the predominantly negative differences in the dust outflow area. (B) As at panel (A) but after additional correction for aerosol effects with an algorithm that includes measurements at λ = 3.75 and 8.96 µm. for CDRs (Merchant et al., 2017) offers principles that should be of differences between alternative measured values (such as applied to SST data products in general. satellites versus drifting buoys; e.g., Castro et al., 2008, 2012; The error in a measured value of SST is the difference in O’Carroll et al., 2008; Petrenko et al., 2016; Xu and Ignatov, that value from the unknown true value, and the uncertainty 2016); and uncertainty modeling, in which understanding of the in SST represents the dispersion of error. Although the error instrumental uncertainty, cloud screening, retrieval process and in each point is unknown (otherwise we would correct for it), representativity effects are quantified, propagated and combined there are a variety of techniques for quantifying uncertainty, to form an uncertainty estimate (e.g., Merchant et al., 2014). in a statistical way. These fall into two classes: empirical To gain confidence of users in applying provided uncertainty methods in which uncertainty is deduced from the distribution information, we recommend that uncertainty estimates should Frontiers in Marine Science | www.frontiersin.org 9 August 2019 | Volume 6 | Article 420
O’Carroll et al.                                                                                                        Observational Needs of Sea Surface Temperature

  FIGURE 5 | Example of validation of an uncertainty model for an SST product. Here, SST uncertainty is defined per datum in an SST product, and varies over a
  range of 0.0–1.0 K. Matches to drifting buoys are binned in terms of the SST uncertainty, and the mean and standard deviation of the difference calculated per bin
  (indicated by the red and blue bars respectively). Accounting for an estimate of in situ uncertainty, the green dashed line is the envelope expected if the uncertainty
  estimates are accurate. As we can see from this example, the agreement at night time (A) is very good. However, for day time match-ups (B) the blue bars are within
  the theoretical envelope, indicating they are over estimated as the calculated standard deviation is smaller than the theoretical for much of the distribution.
  (Reproduced by permission under CC BY 4.0 from https://doi.org/10.6084/m9.figshare.7286168.v2).

be developed using both uncertainty modeling and by empirical                            the Mediterranean, Red and Baltic Sea, the region of the
means. Provided a mature forward model exists, agreement                                 Malvinas/Brazil currents (SW Atlantic), the Benguela Current
of results between the two methods amounts to a convincing                               offshore from Namibia and Angola (SE Atlantic) and the
validation of the uncertainty model.                                                     Mozambique Channel (Indian Ocean).
   Approximate empirical methods of estimating uncertainty are                              Different models of diurnal variability have been proposed
presently the approach within GHRSST format SST products.                                (e.g., Filipiak et al., 2010) and evaluated (e.g., Karagali and
These include Sensor Specific Error Statistics (SSES), comprising                        Høyer, 2013, 2014; Karagali et al., 2017; While et al., 2017;
the mean and standard deviation of satellite SSTs differenced                            Zhang et al., 2018). Diurnal SST variability has been quantified
from a matched in situ temperature, such as measured from
drifting buoys. Improved SSES require better quantification
of in situ uncertainty (and preferably its reduction). It is
recommended that understanding of drifting buoy uncertainty is
improved in support of assessing satellite-derived SST accuracies.
As uncertainty modeling methods are more widely developed
for satellite SSTs over coming years, this will also enable
more rigorous validation including validating uncertainties
(see for example Figure 5 and section “Improved Methods
of Validation”).

Better Practical Quantification of Diurnal Variability
Progress in understanding and quantifying diurnal variability
using hourly GEO IR SSTs over European seas and the Atlantic
Ocean (Gentemann et al., 2008; Bellenger and Duvel, 2009;
Marullo et al., 2010, 2016; Eastwood et al., 2011; Karagali
et al., 2012; Karagali and Høyer, 2013), and the Tropical Warm
Pool (Marullo et al., 2010; Zhang et al., 2016a,b), revealed
consistent features regarding the frequency of all such events,
their timing during the day and seasonal patterns. The difference
between a daytime hourly SST value and the corresponding
foundation temperature of the previous night is defined as
diurnal warming (or anomaly), indicated by δSST. Figure 6
shows the number of observations with δSST ≥ 1 K estimated                                FIGURE 6 | Occurrences of diurnal warming of 1 K and larger, estimated from
                                                                                          hourly SEVIRI SST retrievals between 2006 and 2011. (Reproduced by
from hourly SEVIRI SST retrievals between 2006 and 2011.                                  permission under CC BY 3.0 from https://doi.org/10.5194/os-10-745-2014).
Areas with increased occurrences of δSST exceeding 1K include

Frontiers in Marine Science | www.frontiersin.org                                   10                                               August 2019 | Volume 6 | Article 420
O’Carroll et al. Observational Needs of Sea Surface Temperature
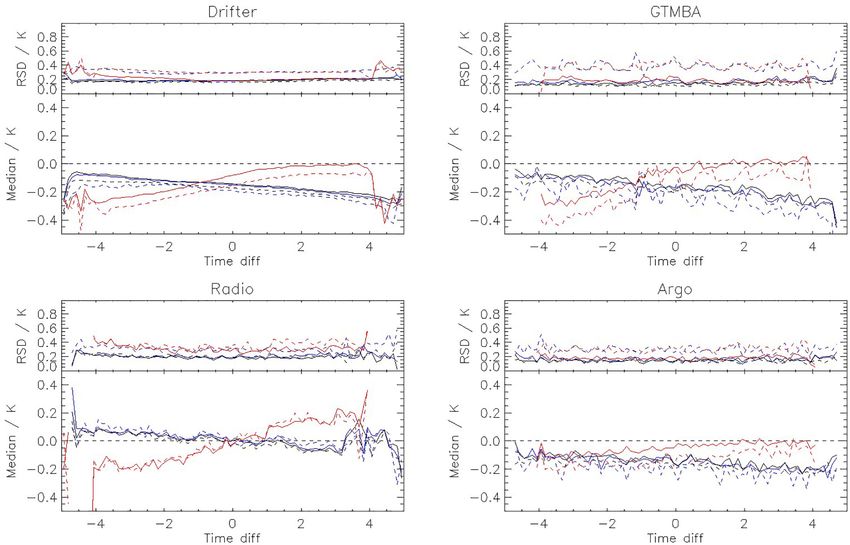
FIGURE 7 | Median (top) and robust standard deviation (bottom) for match-ups between AATSR and (A) drifters, (B) GTMBA, and (C,D) radiometers and Argo
floats. Daytime results are shown in red, nighttime in blue and black; solid lines indicate AATSR dual-view retrievals, dashed lines indicate nadir-only. (Reproduced by
permission under CC BY 4.0 from https://doi.org/10.6084/m9.figshare.7286216.v1).
by satellite (Gentemann et al., 2008) and in situ (Morak- (e.g., in situ SST Quality Monitor, iQuam; Xu and Ignatov, 2014).
Bozzo et al., 2016) observations, yet it is not fully resolved However, the heritage approach to validation does not account
by forced ocean and coupled ocean-atmosphere models. Only for real physical differences between the two measurements
some of the important diurnal variability and cool skin and therefore may not correctly describe the error distribution
effects are parameterized or explicitly represented in models in satellite SSTs. For example, Figure 7 shows the temporal
(e.g., Zeng and Beljaars, 2005; Fallmann et al., 2017). The dependence of differences between match-ups from AATSR and
diurnal cycle is represented in several operational GCMs that four different in situ datasets. The spread of values shown in
distribute hourly products. Here, the mean annual diurnal Figure 7 contributes to the overall standard deviation of the
cycle is well reproduced but extreme events such as diurnal match-ups if not minimized. Also, the uncertainty of the in situ
warming that exceed 1 K are always underestimated (Marullo measurement should be considered, which has been shown
et al., 2014). The implications associated with the lack of a to be larger than expected for drifting buoys (∼0.2 K) from
properly resolved SST daily cycle in atmospheric, oceanic and 3-way analysis methods (O’Carroll et al., 2008; Gentemann, 2014;
climate models have been quantified in terms of heat budget Xu and Ignatov, 2016).
errors in the Tropics (Clayson and Bogdanoff, 2012) and the Corlett et al. (2014) proposed a new approach to satellite SST
Mediterranean Sea (Marullo et al., 2016). The community and validation, by adapting the method of Wimmer et al. (2012) to
users will benefit in the future if consistent methodology is cover all in situ measurement types and represent contributing
developed, and a global study performed to cross-evaluate and terms as uncertainties rather than absolute errors. A benefit of
validate against in situ data, the diurnal variability as seen the Corlett et al. (2014) approach is that it also offers validation of
in various geostationary products (SEVIRIs, GOES, etc.) over the satellite SST uncertainty (see section “Better Uncertainty and
the longest period. Error Estimation” and Figure 5; Lean and Saunders, 2013; Bulgin
et al., 2016; Nielsen-Englyst et al., 2018). A continuing challenge
Improved Methods of Validation is to understand the spatial variability within a satellite SST
The traditional approach to determine errors in satellite SSTs pixel (Castro et al., 2010) in order to justify assumptions in the
is comparison to in situ thermometers (e.g., Llewellyn-Jones treatment of spatial differences between the satellite and in situ
et al., 1984; Strong and McClain, 1984; Kilpatrick et al., 2001; data. Minnett (1991) estimated the variability within a pixel to be
Reynolds et al., 2010; Gentemann and Hilburn, 2015) or ∼0.2 K for AVHRR (which has 1.1 km spatial resolution at nadir)
shipboard radiometers (Kearns et al., 2000; Wimmer et al., 2012; and more recently Castro et al. (2017) estimated a mean value of
Kilpatrick et al., 2015). GHRSST has supported efforts over O(0–0.1) K for MODIS (which has 1 km spatial resolution in the
the past 10 years to unify in situ data for satellite validation thermal IR bands).
Frontiers in Marine Science | www.frontiersin.org 11 August 2019 | Volume 6 | Article 420O’Carroll et al. Observational Needs of Sea Surface Temperature
FIGURE 8 | The SOTO visualization tool (left) showing an overlay of ocean wind satellite tracks over a global Level 4 daily SST map juxtaposed with output from the
HiTide Level 2 subsetter (right) showing two AMSR2 SST swaths overlapping a region of interest off Africa.
EVOLVING THE INTERNATIONAL SST or visualization via additional web service calls. In addition, well
SERVICE TO USERS established web services to access both gridded and non-gridded
data via THREDDS and OPeNDAP have been implemented.
GHRSST began coordination of operational production and Users are also able to access a comprehensive tool set
distribution of satellite SST datasets in 2005 governed by the for GHRSST format data visualization, extraction and quality
foundational system of shared roles and responsibilities known monitoring. For example, the PO.DAAC has developed the State
as the Regional/Global Task Sharing (R/GTS). This framework Of The Ocean (SOTO8 ) for rapid data visualization, overlay,
has been highly successful and continues to operate today. and animation and the HiTide9 Level 2 subsetting service for
However, the international GHRSST community, in response extracting spatial and temporal subset of orbital swath data
to ever-growing data volumes, improved national capabilities, (see Figure 8). Examples of inter-comparison and data quality
and provider-specific data access policies, has established plans tools include SQUAM, iQuam, ARMS and Felyx, previously
to evolve the R/GTS to become a more distributed and mentioned in this paper.
federated framework. Looking forward to the next decade, given the ever-growing
In the evolved R/GTS, multiple organizations around the data volumes and need to utilize SST alongside other large
globe will adhere to an agreed-upon set of data discovery, archive, volume datasets, the international SST service must also evolve to
and access standards, to enable the GHRSST Project Office to include cloud computing, storage and access capabilities as well.
maintain a consolidated one-stop catalog and data discovery Users increasingly seek to bring their algorithms and applications
portal, while eliminating the need to physically consolidate the to the data, rather than following the traditional model of
large and growing data volumes. In this new architecture existing downloading data and processing it locally. Numerous groups
systems will collaborate to migrate and evolve existing data, are actively experimenting with or deploying cloud-based SST
metadata and discovery systems toward this new, distributed services, which are expected to become the new normal over the
system serving the entire community, and to ensure that current course of the coming decade.
and future GHRSST format datasets maintain the required level
of interoperability, discoverability, and metadata compliance.
Much of what this new architecture will require in terms of
APPLICATIONS OF SST
data cataloging, discovery, and access services had already been Satellite derived SST products are used in applications encompas-
implemented using open source software and specifications. For sing a wide range of temporal (diurnal to decadal) and spatial
example, the NASA Physical Oceanography Distributed Active (sub-km to global) scales and are required by many user
Archive Center (PO.DAAC) and the NOAA National Centers for communities with an interest in ocean processes. Daily global
Environmental Information (NCEI) have implemented dataset high-resolution (O’Carroll et al. Observational Needs of Sea Surface Temperature The ability to resolve mesoscale and submesoscale features (Williams et al., 2015). Satellite SST data are assimilated into an is facilitating new applications in coastal regions and frontal ocean model in coupled systems, which then exchanges data detection (e.g., García-Morales et al., 2017; Vazquez-Cuervo et al., with the atmospheric model, including the dynamic evolution 2017). As a result of their rapid sampling, data from GEO of the SST. In the case of the ECMWF IFS system, the 5 km satellites facilitates detecting temperature changes on sub-daily OSTIA SST analysis (Donlon et al., 2012) is used to initialize timescales (Wick et al., 2002). Long-term SST records (some now the coupled model. approaching 40-years in duration) can be used to observe inter- Although the highest spatial resolution global SST analysis annual to decadal scale variability (e.g., Liu and Minnett, 2015; used as a boundary condition for NWP is 5 km OSTIA (Donlon Ferster et al., 2018). et al., 2012), it’s observation correlation length scale is ∼40 km, A full review of all applications of SST would be a review and unable to resolve meso-scale coastal ocean features. Regional paper itself. So, in this section we first focus on two of the more SST analyses have smaller observation correlation length scales established application areas of SST, in support of (1) operational (e.g., 12 km for RAMSSA; Beggs et al., 2011), but suffer from forecast systems and (2) understanding changes to the Earth’s a lack of high resolution IR observations in cloudy regions. climate over time. Then, we look at three evolving user-driven Impact studies are needed to show whether the prediction of application areas, which are driving much of the required SST extreme meteorological events over the ocean or land might be research and development activities for the next 10 years and improved by using either SST analyses that resolve ocean features where SST will play an increasingly more important role. at
O’Carroll et al.                                                                                                       Observational Needs of Sea Surface Temperature

     FIGURE 9 | Daily averaged forecast SST and surface currents in the East Australian Current, centered on April 03, 2019, obtained from the Bureau of Meteorology’s
     operational OceanMAPS ocean model, with a model base time of April 02, 2019 12 UTC. (Sourced from http://www.bom.gov.au/oceanography/forecasts/,
     accessed on April 03, 2019; reproduced by permission of Bureau of Meteorology, © 2019 Commonwealth of Australia).

improving their SST accuracy will significantly benefit ocean                            Application Example 2: The Modern Era
forecasts, particularly in coastal and tropical regions. Improving                       and Historical SST Climate Data Records
temporal coverage and accuracy of SSTs from geostationary
                                                                                         Linking the satellite SST record to the historical in situ SST record
satellites will help to constrain diurnal processes in higher
                                                                                         is important to develop coherent CDRs. This is complicated
resolution ocean models.
                                                                                         by changes over time in both measurement systems. Early
                                                                                         (e.g., 1800s) in situ measurements are from sailing ships and
Seasonal and Inter-Annual Forecasting
                                                                                         now the in situ system is comprised of measurements from
Operational centers also issue seasonal forecasts out to several
                                                                                         ships, drifting and moored buoys, profiling floats and some
weeks to months (Balmaseda et al., 2009). Most seasonal
                                                                                         other elements. Long-term satellite SST records are affected
forecasting systems are based on coupled ocean-atmosphere
                                                                                         by constellation changes (sensors may be replaced, instrument
general circulation models that predict SSTs and their impact
                                                                                         calibration and satellite orbits may drift and instrument channels
on atmospheric circulation, and assimilate SST as part of their
                                                                                         may fail). To assess any impact of variations between sensors
initial conditions. The aim of seasonal forecasts is to predict
                                                                                         on the overall long-term satellite record the GCOS recommends
anomalies from the historical average for the forthcoming
                                                                                         that “continuity of satellite measurements through appropriate
seasons (Balmaseda et al., 2009). The strongest relationship
                                                                                         launch and orbital strategies should be ensured” (GCOS, 2011)
between SST patterns and seasonal weather trends are found
                                                                                         with at least 6-months overlap between successive sensors in
in tropical regions (Beggs, 2010). Although most operational
                                                                                         order to develop homogeneity adjustments. Available satellite
seasonal prediction models have horizontal spatial resolutions
                                                                                         data holdings have not always met this minimum, and a full
over the ocean of the order of 100 to 200 km, recently, higher
                                                                                         annual cycle of overlap would always be more robust. CDR
resolution coupled models have forecast the ocean state at
                                                                                         requirements (Ohring et al., 2005) are very demanding to achieve
weekly temporal resolution and 25 km spatial resolution (e.g.,
                                                                                         and as is demonstrating whether the goals have been met
MacLachlan et al., 2014; Hudson et al., 2017). Seasonal forecasts
                                                                                         (Merchant et al., 2017).
from coupled ocean-atmosphere models can be used to predict
                                                                                            The long-term satellite SST record known as “Pathfinder”
anomalous SST several months in advance12 .
                                                                                         (Casey et al., 2010) utilizes empirical regression algorithms
12
     http://www.bom.gov.au/oceanography/oceantemp/sst-outlook-map.shtml                  (Kilpatrick et al., 2001) tuned to drifting buoys to provide

Frontiers in Marine Science | www.frontiersin.org                                   14                                              August 2019 | Volume 6 | Article 420
O’Carroll et al. Observational Needs of Sea Surface Temperature FIGURE 10 | Annual median and interquartile range of satellite SSTskin versus SSTdepth from drifting buoys for a combined timeseries of AVHRR Pathfinder SSTs from NOAA-7 to -19, MODIS on Terra and Aqua, and S-NPP VIIRS. a self-consistent approach across the series of AVHRRs from MODIS series (Kilpatrick et al., 2015). These more recent satellite NOAA-7 onward. Although there have been some sensor records can then be linked to the longer term records from overlaps in the series, Pathfinder is constructed from a single AVHRR (Figure 10). In addition, new high spatio-temporal AVHRR sensor at any one time, and the tuning to in situ resolution climatologies are required in order to fully understand data is primarily to account for the many instrumental issues air–sea interactions across all relevant scales, for which an observed in the series, including errors in calibration (Mittaz attractive approach will be to combine polar and geostationary et al., 2009). The latest version of Pathfinder is Version 5.3 observations consistently. While research will be required on and future developments of Pathfinder will be found in the newer sensors, the total length of record is a key parameter version 6.0 dataset, including latitudinal banded coefficients to of CDR users, and can be maximized by work to extend the reduce latitudinal biases (Merchant et al., 2009a). In addition satellite SST record back to 1978 (the earliest feasible time). to Pathfinder, other AVHRR-only SST time-series include the It is essential that this early record be addressed with well- NOAA science quality AVHRR GAC Reanalysis-1 (RAN1; characterized uncertainty and stability, taking advantage of Ignatov et al., 2016) and a regional Mediterranean product advances in inter-satellite re-calibration techniques, the full SST- (Pisano et al., 2016). relevant historic observing system and advances in radiative The ATSR Reprocessing for Climate (ARC) project (Merchant transfer and numerical weather reanalysis. et al., 2012) utilized the ATSR series of sensors, which were designed for providing SST suitable for climate studies. ARC User-Driven Priorities for SST differs from Pathfinder and AVHRR RAN in that it maintains Observations Over the Next Decade independence from in situ measurements, has performed a In this section, we summarize three application areas identified careful harmonization of the BTs from successive sensors, and by SST users as being of high priority for SST developments in the employs a physics-based retrieval of SSTskin using a Radiative next decade and focus on one specific priority in each area that Transfer Model (RTM) (Embury et al., 2012a,b). This then allows requires research and development. The application areas are: independent validation of the dataset using in situ measurements, accounting for depth and diurnal effects, both before (Embury (1) Improving SST data quality in the Arctic: Arctic et al., 2012b) and after harmonization of the ATSR BTs. Amplification of the climate change signal requires Merchant et al. (2012) demonstrated how ARC is capable of understanding its cause and improving our ability quantifying inter-annual variability in SST and identifying major to make more accurate predictions, including SST anomalies. However, the timespan of the ATSR series quantification of feedback processes operating in (1991–2012) compared to the AVHRRs is a limitation. The ESA the Arctic Ocean. Included in the Arctic system is a SST_CCI project (Merchant et al., 2014) has pioneered using the temperature feedback (Pithan and Mauritsen, 2014), ATSRs to reduce BT errors in the AVHRRs and in derived SSTs, and better understanding of this requires more accurate providing a stabilized dataset of both ATSR and AVHRR for the SSTs. Coverage from IR sensors is poor mainly due to period they co-exist (1991–2012). The next version product from persistent cloud, so a priority is to improve PMW data SST CCI will extend backward and forward from the ATSR period coverage at high latitudes. using consistent physically based retrievals for all AVHRRs. (2) Improving coastal SST data quality: Coastlines and The possibilities for long-term satellite SST records will coastal communities are under threat so improved increase over the next 10 years, as new sensors such as VIIRS understanding of coastal marine processes is of vital provide a capability to extend existing data records from the importance, and high resolution SST that can reveal Frontiers in Marine Science | www.frontiersin.org 15 August 2019 | Volume 6 | Article 420
You can also read