Does Collaborative Governance Increase Public Confidence in Water Management? Survey Evidence from Aotearoa New Zealand
←
→
Page content transcription
If your browser does not render page correctly, please read the page content below
www.water-alternatives.org                                                                     Volume 13 | Issue 2
Tadaki, M.; Sinner, J.; Stahlmann-Brown, P. and Greenhalgh, S. 2020.
Does collaborative governance increase public confidence in water
management? Survey evidence from Aotearoa New Zealand.
Water Alternatives 13(2): 302-323

Does Collaborative Governance Increase Public Confidence in
Water Management? Survey Evidence from Aotearoa New Zealand
Marc Tadaki
Cawthron Institute, Nelson, New Zealand; marc.tadaki@cawthron.org.nz

Jim Sinner
Cawthron Institute, Nelson, New Zealand; jim.sinner@cawthron.org.nz

Philip Stahlmann-Brown
Manaaki Whenua – Landcare Research, Wellington, New Zealand; brownp@landcareresearch.co.nz

Suzie Greenhalgh
Manaaki Whenua – Landcare Research, Auckland, New Zealand; greenhalghs@landcareresearch.co.nz

ABSTRACT: Collaborative decision-making is widely understood as a democratic corrective to top-down forms of
environmental management; it is a way in which citizens can contribute local knowledge to the policy process and
have a more direct role in shaping policies and rules that affect them and their environments. However, while the
democratic virtues of collaborative governance are often asserted, they are rarely evidenced; this leaves claims of
democratic empowerment open to question. This study used a longitudinal survey of three New Zealand regions (n
= 1350) to identify whether major multi-year investments in collaborative decision-making (2012-2018) are leading
to increased public confidence in the effectiveness, responsiveness and fairness of water management institutions.
Residents in collaborative catchments were found to have scores that were statistically indistinguishable from
residents of non-collaborative catchments on management effectiveness, perceived agreement about water
management, and fairness. Collaborative catchment residents did assign higher scores for water management
responsiveness than did other residents, but the size of this difference was small compared to the effects of gender,
ethnicity, region and level of individuals’ prior engagement in water management. Despite major investments in
collaborative community decision-making exercises, community confidence in the legitimacy, fairness and
effectiveness of environmental management has not improved over the four years documented in our surveys.
Researchers and practitioners should focus on developing ways to assess – and realise – the democratic benefits of
collaborative decision-making for water.

KEYWORDS: Collaborative governance, legitimacy, participation, evaluation, democracy, New Zealand

INTRODUCTION
Environmental management in Aotearoa New Zealand and globally has undergone a shift towards using
participatory approaches including collaborative planning. Often positioned against state-centric and
technocratic forms of environmental decision-making, collaborative governance has been promoted as
an alternative decision-making model that restores power to civil society and generates positive social
and environmental outcomes (Innes and Booher, 2018; Gunningham and Holley, 2016; Bodin, 2017).
Participatory forums and deliberative processes have been proposed to enhance the democratic

Tadaki et al.: Collaborative water governance in Aotearoa New Zealand                                           302
Water Alternatives – 2020                                                             Volume 13 | Issue 2

foundations of environmental management as well as strengthen policy effectiveness by informing
decisions with robust local knowledge (Bulkeley and Mol, 2003; Dietz and Stern, 2008).
    In Aotearoa New Zealand (henceforth New Zealand), 'collaboration' has emerged as a distinct model
for participatory water policy development; in this model, major societal economic and political interests
proceed through a robust sharing of aspirations to create consensus recommendations for the state on
matters of policy (Salmon, 2008; LAWF, 2012; Brower, 2016; Nissen, 2014). Collaboration has been
embedded in policy documents and versions of it have been used by 9 of New Zealand’s 16 regional
councils and unitary authorities (henceforth regional councils) as they generate new objectives and rules
for freshwater management (MfE, 2017b; Tadaki, 2018).
    While participatory regimes of environmental governance are emerging in Australasia, North America
and Europe (Benson et al., 2013; Cook et al., 2013), little is known about whether these regimes are
enhancing the democratic basis of environmental governance. Are they making environmental
management fairer and more responsive to citizens? Are collaborative regimes improving the legitimacy
of environmental decisions? If researchers and governments do not seek or provide answers to these
questions, how will we know whether collaboration is worth the effort?
    In this paper, we report data from a novel survey designed to test whether collaborative governance
arrangements are leading to residents’ increased confidence in the effectiveness, responsiveness and
fairness of water management. In contrast to evaluations of collaborative processes by their participants,
our survey measures how residents of the wider community judge water management institutions both
during and after major collaborative governance initiatives. We focus on collaboration in relation to
policymaking, rather than collaboration on policy implementation. After briefly reviewing the theory and
critique of collaborative environmental governance, we outline our research design and study context.
Our results and analysis explore how confidence in environmental management is related to spatial
proximity, social identity and temporal changes. We interpret the evidence as suggesting that there is
limited-to-no indication that collaboration in any of these regions is significantly improving community
confidence in the fairness, responsiveness and effectiveness of environmental management. In the
discussion, we consider four possible explanations for this result and we conclude by reflecting upon the
implications of our findings for collaborative governance research.

COLLABORATIVE ENVIRONMENTAL GOVERNANCE AND THE NEED FOR DEMOCRATIC EVALUATION
Participatory methods of environmental decision-making are widely promoted as providing a logically
sound and democratically inspired correction to the shortcomings of top-down environmental policy
(Lemos and Agrawal, 2006; Evans, 2012; Gunningham and Holley, 2016; Innes and Booher, 2018; Gunton,
2017). One particular method, collaborative decision-making, occurs when a group of stakeholders is
delegated by the government to deliberate about some policy task and formulate a collective response,
usually in the form of consensus recommendations (Gunton, 2017). By involving citizens in the making of
decisions that affect themselves and their environment, such decisions are thought to be i) more
legitimate, as decisions are directly affected by those governed, and ii) more effective, as decisions can
be informed by knowledge of local environments and communities (Dietz and Stern, 2008; Innes and
Booher, 2018).
   While collaborative decision-making is widely promoted for its potential to foster more legitimate and
effective environmental decision-making, rarely have the effects of collaboration on the wider polity
been assessed (Agger and Löfgren, 2008). The environmental management literature has typically
focused on evaluating the inputs to processes of collaborative decision-making, but it insufficiently
evaluates the ecological, policy, or social outcomes (Conley and Moote, 2003; Carr et al., 2012;
Margerum, 2011).

Tadaki et al.: Collaborative water governance in Aotearoa New Zealand                                303
Water Alternatives – 2020 Volume 13 | Issue 2
Input evaluation assesses the representativeness and inclusiveness of collaborative groups on the
assumption that meaningful inclusion of all interested and significantly affected actors (including
marginalised actors) in decision-making enhances the legitimacy of decisions (Nissen, 2014). Process
evaluation considers how the collaborative decision-making process is experienced by participants and
how the state and other leading actors structure and mediate collaborative dynamics. Emphasis is placed,
for instance, on how disputes between participants are mediated, whether and how learning is
facilitated, and whether and how trust between participants is enhanced during the process (see e.g.
Conley and Moote, 2003; Carr et al., 2012).
Whereas input and process evaluation concern how collaboration is done, outcome evaluation
considers the effects of collaborative decision-making on the environment, community and polity. Such
effects can be studied by assessing the quality of decision outputs (such as a policy or plan) against
theoretical criteria (Blackstock et al., 2012) or by gauging the environmental and social effects of
collaborative decision-making through indicators of improved water quality, improved capacity for
dispute resolution, or "increased trust" (Conley and Moote, 2003; Carr et al., 2012).
Where the democratic outcomes of collaborative governance have empirically been assessed, they
have often been studied by analysing the perceptions of actors who have participated in the collaborative
process itself. Leach (2006), for example, evaluated 76 watershed partnerships in the western United
States via a survey of 1625 participating and non-participating actors. He aggregated participants’ survey
responses to assess each partnership’s inclusiveness and representativeness of the wider polity, the
impartiality, transparency, deliberativeness and lawfulness of the decision-making processes, and the
ability of participating actors to influence decisions rendered by the group. By comparing judgements of
different factions (for example, pro-environment and pro-development actors) for each criterion, Leach
identified which partnerships were perceived as fair by the greatest number of sectors and the greatest
number of participants. But while Leach surveyed both participating and non-participating actors, he did
not compare responses between these groups, an omission which is fairly typical. Cradock-Henry et al.
(2017) solicited the views of participants of several collaborative water groups in New Zealand to identify
key features of 'successful' collaboration, reporting measures of consensus about different aspects of
collaboration in a way similar to Leach (2006). Cradock-Henry et al. (2017) show, for example, that up to
90% of participants in one collaborative water management process in New Zealand ultimately preferred
collaborative decision-making to the status quo, whereas this number was 55% for a contemporaneous
collaborative water management process in a different region.
These two examples illustrate a wider tendency to evaluate the democratic effects of collaboration
by focusing on the perceptions and judgements of participating actors (Conley and Moote, 2003; Carr et
al., 2012; Innes and Booher, 2018; Margerum, 2011; Emerson et al., 2011; Koontz et al., 2020). On its
own, however, participant-focused evaluation implies that collaboration can be declared a success as
long as it benefits those who participate, irrespective of the evaluation of the wider community. This is
problematic, especially as collaborative governance has been criticised for being a mechanism for rule-
by-elites who are unelected and who are often unaccountable to the wider citizenry (Kirk et al., 2017;
Brower, 2016; Nissen, 2014; Swyngedouw, 2009; McNeill, 2016). Given that research has shown that
elites who participate in water management activities often have values and preferences that are
different from those of members of the wider public (Dean et al., 2016; Seymour et al., 2011), there is a
need to hold collaborative decision-making accountable to the wider citizenry. To safeguard against the
risk of elite capture, Marshall and Lobry De Bruyn (2019) argue that measures of community confidence
in water management can provide democratic feedback to water managers. Such legitimacy metrics
could enable managers to assess whether water policy reforms are adequately responding to public
concerns by identifying whether reforms increase or decrease public confidence in environmental
management institutions (see also O’Donnell and Garrick, 2017).
Regarding the proposition that collaborative decision-making enhances public trust in environmental
management, existing evidence is thin and, thus far, negative. Sinner et al. (2015) reported that in focus
Tadaki et al.: Collaborative water governance in Aotearoa New Zealand 304Water Alternatives – 2020 Volume 13 | Issue 2
groups with residents from Canterbury, New Zealand, members of the general public were unaware of
the collaborative processes being undertaken in their area at the time; when prompted, they expressed
scepticism about both the process and the outcomes of the collaborative exercises. In a subsequent
survey of residents across three New Zealand regions that were undergoing collaborative water planning,
Sinner et al. (2016) found no significant differences between people inside and outside collaborative
areas with regard to their assessments of the legitimacy and the effectiveness of water management; in
short, there was no evidence that collaboration was improving community members’ judgements of the
democratic basis of environmental management. However, that survey was undertaken in 2015, when
the collaborative processes being studied were still in progress and had not yet completed their policy
work. This is limiting in two ways. First, it is logical to expect that evaluations of legitimacy and
effectiveness might need to be made after a decision was agreed to by collaborating parties. Second, it
is also logical to expect that once formal decisions are made, it will take some time for altered judgements
about environmental management institutions to diffuse through the local community. Thus, the passage
of some more time could help to identify any changes in community confidence in environmental
management.
If the democratic benefits of collaborative environmental governance are to be realised rather than
merely asserted, the effects of collaboration on community confidence in governance institutions need
to be evidenced. As argued by Lord (2004: 14), democracy must at some level be concerned with the "felt
relationship between rulers and the ruled: whether they feel they have a right to public control which
they exercise as equals" (cited in Agger and Löfgren, 2008). The current focus on evaluation of
collaboration 'from the inside' is important, but it must be accompanied by an assessment of whether
collaborative governance is seen by the wider community to be delivering improved effectiveness,
fairness and legitimacy.
RESEARCH DESIGN, CASE STUDIES AND METHODS
Research design
This study investigates how community attitudes towards water management vary over time and space
in three regions where collaborative decision-making has been utilised. By surveying community
members’ judgements about water management and analysing spatial, temporal and demographic
patterns, we can identify whether collaborative governance is improving the legitimacy of environmental
management as judged by the wider community. We assume that collaborative decision-making
initiatives will generate an increased sense of legitimacy among its participants initially. We hypothesise
that this improved evaluation will diffuse through the wider community through interpersonal
communication between participants and other residents, through media coverage about the process,
and, eventually, through residents experiencing different environmental management outcomes.
We designed our survey to test what we call the 'confidence diffusion hypothesis'. This hypothesis
anticipates that collaborative processes will lead to improved assessments of the effectiveness, fairness
and responsiveness – collectively, the legitimacy – of environmental management by community
residents. This means, specifically, that
• Residents who are most engaged in water management (i.e. those who attend hearings and
submit feedback on resource management plans) will express improved confidence in
environmental management in the near term, that is to say within one to three years;
• Residents within catchments with collaborative decision-making will express greater confidence
than residents from non-collaborative catchments in the near term;
Tadaki et al.: Collaborative water governance in Aotearoa New Zealand 305Water Alternatives – 2020 Volume 13 | Issue 2
• Residents in the same region (but not necessarily the same catchment) undergoing collaborative
decision-making will express greater confidence in environmental management in the medium
term, that is to say three to five years.
To test this hypothesis, we conducted a telephone survey of residents in three New Zealand regions
where environmental authorities were deploying new collaborative decision-making processes for water
management. The 2015 community survey of Sinner et al. (2016) of the Northland, Waikato and Hawke’s
Bay regions was repeated in 2017 and 2019 to see whether four additional years would allow an
improvement in community confidence to become detectable in survey results. By tripling the size of the
dataset, we could also investigate with greater statistical power what demographic factors helped to
predict survey responses. In what follows, we describe the water management context in New Zealand
and the three case study regions, before detailing our survey method.
New Zealand and case study context
Since 2008, New Zealand has undergone a collaborative turn in the way it undertakes freshwater policy
and planning. In 1991, New Zealand enacted the Resource Management Act (RMA), which constituted a
major reform and consolidation of environmental statutes. Considered world-leading environmental
legislation at the time, the RMA led to the development of new freshwater management plans by regional
councils which addressed both quantity and quality issues. By the late 1990s and early 2000s, however,
it had become clear that councils’ freshwater plans were not effectively managing the diffuse pollution
of freshwater, and political agitation by environmental groups led to increased awareness of the
deteriorating condition of New Zealand’s freshwater bodies (Tadaki, 2018; Knight, 2018). When elected
in 2008, the centre-right National Party-led government (2008-2017) inherited a draft national
freshwater policy from the previous Labour government and convened a collaborative group of major
national stakeholders in order to generate consensus-based recommendations on the draft policy. That
stakeholder body, the Land and Water Forum, made over a hundred recommendations during its tenure
(2009-2019), only some of which the government adopted. In 2011, the government gazetted a National
Policy Statement for Freshwater Management (NPSFM), revising it substantially in 2014 and again in 2017
(New Zealand Government, 2011, 2017, 2014). The centrepiece of the 2011 policy – which has endured
through its revisions – is the requirement for regional councils (who have responsibility for water
management) to set objectives and limits for water quality and quantity that are based on the values of
their local communities and to implement measures to achieve these objectives and limits.
The Land and Water Forum, whose creation was inspired by Scandinavian experiences with
collaborative governance (Smith, 2007), in turn recommended that regional councils should be
encouraged to use local collaborative processes as a mechanism to set water quality objectives and rules
(LAWF, 2012). While the government suggested that collaboration was a desirable method of community
engagement (MfE, 2013), collaboration was not embedded as a requirement for councils. And yet,
despite the high upfront cost and non-mandatory status of collaboration as a vehicle for regional councils
to engage with their communities, between 2010 and 2019, 9 of New Zealand’s 16 regional councils chose
to use collaboration as their primary mechanism for soliciting community values and freshwater
objectives (MfE, 2017b).
Regional councils in Northland, Waikato and Hawke’s Bay were among the first to consider using
collaboration to engage with their communities. While all three regions rely heavily on pastoral
agriculture – a major pressure on freshwater ecosystems (MfE and Stats NZ, 2017) – the regions illustrate
a diversity of size, income, demographic composition and ecological context. As Table 1 shows, the
Northland region is one of the poorest regions in the country; a high percentage of its population self-
identifies as Māori and it has poor soils and low productivity (MfE, 2017c). Northland is characterised by
hundreds of short coastal streams, where over-extraction is localised and where it is difficult to monitor
Tadaki et al.: Collaborative water governance in Aotearoa New Zealand 306Water Alternatives – 2020 Volume 13 | Issue 2
and enforce water rules. Here, sediment production and E. coli contamination from pastoral agriculture
are the dominant ecological concerns.
Table 1. Demographic and land use variables for New Zealand’s 16 regions, with the three sampled
regions highlighted in italics.
Region Population Percentage Median income Number of Number of
(2013 census) Māori per week ($) in cattle/km2 sheep/km2
(2013 census) 2013 (2012) (2012)
Northland 151,692 29.6 821 62 35
Auckland 1,415,550 10.1 1325 48 42
Waikato 403,638 20.7 1112 98 74
Bay of Plenty 267,741 25.7 1058 34 27
Gisborne 43,656 45.1 994 (a)
34 185
Hawke’s Bay 151,179 22.9 994(a) 40 231
Taranaki 109,608 16.6 1230 98 60
Manawatū-Wanganui 222,672 19.6 949 47 253
Greater Wellington 471,315 12.4 1424 31 207
Marlborough 43,416 11.0 1080 (b)
12 29
Nelson 46,437 9.0 1080 (b)
7 15
Tasman 47,157 7.3 1080(b) 9 52
West Coast 32,148 9.9 1080 (b)
9 2
Canterbury 539,436 7.8 1209 38 120
Otago 202,467 7.1 1173 20 171
Southland 93,339 12.4 1154 27 140
National 4,242,048 14.1 1218 39 118
Source: Population and percentage Māori data is from Statistics New Zealand (www.stats.govt.nz). Median income per week
data available from Stats NZ (2020). Number of cattle and sheep available from MfE (2015).
Note: (a) = median income per week for Gisborne and Hawke’s Bay regions, calculated together; (b) = median income per week
for the Marlborough, Nelson, Tasman and West Coast regions, calculated together.
The Hawke’s Bay region has a population that is similar to Northland’s but has higher income and
economic production; it also has a more balanced mix of horticulture, pastoral agriculture and forestry.
The Hawke’s Bay region is drier than Northland but has large mountain-sourced rivers that provide
reliable irrigation water (MfE, 2017a). Hawke’s Bay’s water bodies are under several prominent
pressures; these include sediment and E. coli, high demand for irrigation, and low river flows in summer.
The Waikato region has the third-largest population in the country, is heavily reliant on pastoral
agriculture and forestry (MfE, 2017d), has a higher than average median income (Table 1), and was
considered to be ground zero for agricultural intensification and associated freshwater decline through
the 1990s (Tadaki, 2018). The Waikato River – the longest river in the country – provides 10% of New
Zealand’s electric power, as well as municipal water for the cities of Hamilton and Auckland and irrigation
for the region’s dairy farms. The health of the river has been further impacted by sediment and nutrient
runoff from adjacent land. In the 20 years prior to this study, there were three major planning disputes
over abstraction from the river and its headwaters, Lake Taupō, and over water quality; each case ran for
Tadaki et al.: Collaborative water governance in Aotearoa New Zealand 307Water Alternatives – 2020 Volume 13 | Issue 2
several years. In all three regions, agricultural industries in general and pastoral farming in particular
generate a substantial portion of regional economic output.
Compared to the consultative model of freshwater planning previously used by the three regional
councils, collaboration constituted a significant change in community engagement. Within each region,
key local government staff championed collaboration as an option that could generate robust public
support for what could otherwise be costly and politically divisive regulations (Tadaki, 2018). Figure 1
locates these three regions within New Zealand and indicates specific catchments where collaborative
planning processes occurred between 2012 and 2018. Table 2 provides an overview of the number, size,
duration and outputs of the collaborative processes in these regions.
Table 2. Features of collaborative processes in Northland, Hawke’s Bay and Waikato.
Northland Hawke’s Bay Waikato
Time period active 2013-2017 2012-2018 2014-2016
Number of collaborative 5 1 1
processes
Number of meetings held ~15 per catchment 42 30
Number of participants 13-35 (depending on ~30 ~25
catchment)
Policy outcome Consensus-produced Draft plan change with Consensus-produced
non-regulatory some areas of recommendations,
catchment plans, June disagreement, August September 2016
to August 2017 2018
Key water management Sediment, E. coli Sediment, E. coli, Nutrients, sediment
concerns water allocation and
river levels
Source: Regional council websites and correspondence with council staff.
Note: In Northland one additional process was initiated after the 2015 survey; it is not included in this assessment.
Methods
A market survey firm was contracted to administer a telephone survey of residents in the Northland,
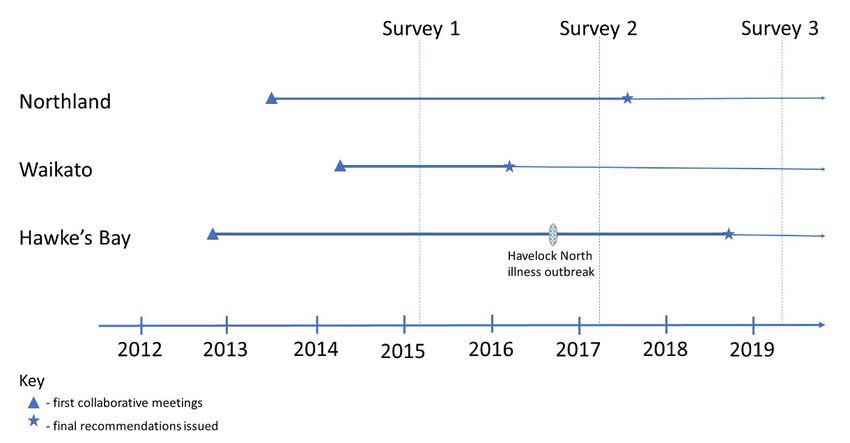
Waikato and Hawke’s Bay regions in 2015, 2017 and 2019. Figure 2 indicates when each survey occurred
in relation to the start and end of each regional collaborative process. Note that the National Policy
Statement for Freshwater Management was first adopted in 2011, before the timeline begins, and that
the three major Land and Water Forum reports were published in 2010 and 2012. A major revision of the
NPSFM was adopted in 2014, at which point some collaborative groups were already underway.
The telephone sampling procedure was as follows. The market survey firm provided a list of telephone
numbers for residences located in the three regions; the research team classified the area-tagged
numbers as residing inside or outside collaborative catchments; the market survey firm then randomly
dialled telephone numbers from each of these groups to administer the survey. In addition to using
quotas for collaborative and non-collaborative catchments, quotas were used to ensure that gender and
age representation matched 2013 census information for these regions. The resulting sample, however,
under-represents Māori in all regions, with 17% Māori survey participation in Northland (compared to
their 30% share of the population as per the 2013 census), 10% in Hawke’s Bay (compared to 23% in the
census) and 9% in Waikato (compared to 21% in the census).
Tadaki et al.: Collaborative water governance in Aotearoa New Zealand 308Water Alternatives – 2020 Volume 13 | Issue 2
Figure 1. The locations of the Northland, Waikato and Hawke’s Bay regions of New Zealand, indicating
surveyed catchments that engaged in collaborative water planning processes between 2012
and 2018.
Source: Maps by Dana Clark.
Note: Waikato had a single collaborative planning process for the whole Waikato River catchment. Hawke’s Bay had a single
collaborative planning process for the Tūtaekurī, Ahuriri, Ngaruroro, and Karamū River catchments. Northland had five
collaborative water planning processes, each of which had different start and end dates. A sixth collaborative planning process
in Northland began later, but we did not include it in our survey.
Tadaki et al.: Collaborative water governance in Aotearoa New Zealand 309Water Alternatives – 2020 Volume 13 | Issue 2
Figure 2. Timing of the three surveys in relation to first meetings and final recommendations of
collaborative groups in each region.
For Northland, the sample included about 30 respondents in each of the five catchments with
collaborative processes, and about 60 residents from non-collaborative catchments. For each of Hawke’s
Bay and Waikato, about 60 residents were sampled from collaborative catchments and about 60 from
non-collaborative catchments. The sample size for each survey round is therefore approximately 450
respondents, with a total of 1350 over the three surveys. There was no attempt to resample the same
people in subsequent surveys; new samples were drawn each time. The survey requested demographic
information; this included binary categories for gender (F/M) and ethnicity (non/Māori), as well as
categorical variables for age, occupation and previous engagement with water management processes.
Respondents were asked to rate their level of agreement with statements about the fairness,
responsiveness and effectiveness of water management on an 11-point Likert scale (Table 3). 1
To investigate how community confidence in the responsiveness, fairness and effectiveness of
environmental management varied across space, across demographics and over time, we first conducted
F-tests on summary statistics to identify significant differences in confidence between catchments and
regions and across years. We then re-analysed the results using a multiple regression tobit model,
controlling for gender, ethnicity, occupation (whether involved in forestry or farming), level of
engagement in water management activities in general, and whether the respondent resided in a
collaborative catchment.
1 Likert scales compare differences in the magnitude of agreement with statements but do not capture differences in reasoning;
for example, Likert-based comparisons treat well-informed judgements the same as less well-informed judgements and cannot
differentiate between respondents who care deeply about a question and those who are indifferent. Despite these limitations,
Likert scales have been found to be valid for capturing a range of social scientific phenomena (Norman, 2010; Willits et al., 2016),
and a 0-to-10 scale provides sufficient resolution to identify meaningful differences between respondents (Cummins and
Gullone, 2000).
Tadaki et al.: Collaborative water governance in Aotearoa New Zealand 310Water Alternatives – 2020 Volume 13 | Issue 2
Table 3. Survey questions and the constructs they describe.
Construct Question
Management Using a scale from 0 to 10 where 0 means very poorly and 10 means very well, in
effectiveness your opinion how well does the regional council manage freshwater bodies?
Agreement Thinking about conflict or agreement between competing interests over water
management in your area, using a scale of 0 to 10 where 0 means lots of conflict
and 10 means strong agreement, would you say there is conflict or agreement
between competing interests over water management in your area?
Fairness Using a scale from 0 to 10 where 0 means not fair at all and 10 means very fair, in
your opinion, how fair do you think the water management processes are in your
catchment?
Responsiveness Using a scale from 0 to 10 where 0 means not confident at all and 10 means very
confident, if you had concerns about how you, your family, or your business was
affected by freshwater management, how confident are you that your interests
and concerns would be taken into account by the regional council?
DOES COLLABORATION INCREASE COMMUNITY CONFIDENCE IN WATER MANAGEMENT?
Based on our confidence diffusion hypothesis, we expected that confidence in water management would
be highest among those most engaged in water management processes, higher in catchments
undergoing collaborative decision-making than in non-collaborative catchments, and that confidence
would improve over time as collaborative processes finished and their outcomes became known. The
2015 survey (Sinner et al., 2016) showed no significant spatial differences in confidence in environmental
management, although at the time of the survey collaborative processes were still ongoing. The
Northland and Waikato processes were close to making their management recommendations by the
2017 survey, and the Hawke’s Bay process made recommendations several months before the 2019
survey (Figure 2).
Our survey results show that, overall, community confidence in water management has not improved
over time; across the 2015, 2017 and 2019 surveys, no survey scores have improved significantly.
Northland scores have remained constant and there has been a statistically significant decrease in
Hawke’s Bay scores on the question of management effectiveness (Figure 3). This decrease in Hawke’s
Bay responses occurred in the 2017 survey, following a major August 2016 outbreak of gastrointestinal
illness in Havelock North. The outbreak was caused by faecal bacterial contamination of a public water
supply and led to 5000 people becoming ill, several of whom died. Both the Hawke’s Bay Regional Council
and the Hastings District Council were criticised for their perceived failure to prevent the outbreak
(Government Inquiry into Havelock North Drinking Water, 2017). Hawke’s Bay respondents’ scores
dropped across all questions over the 2015-2019 period, although the decline is only statistically
significant for management effectiveness. We suggest that the magnitude and significance of this drop
provides some indication that our survey method measures a reliable construct that can and does change
observably across the timescales sampled here.
Tadaki et al.: Collaborative water governance in Aotearoa New Zealand 311Water Alternatives – 2020 Volume 13 | Issue 2
Figure 3. Average scores for residents within each region for the 2015, 2017 and 2019 surveys.
Note: Error bars indicate 95% confidence interval; where error bars do not overlap there is a statistically significant difference
between the means (p < 0.05).
Overall community confidence, therefore, did not improve over time. Furthermore, residents from
collaborative catchments did not assign significantly different scores than residents from non-
collaborative catchments for the responsiveness, effectiveness or fairness of water management (Figure
4). In Waikato, although collaborative catchment residents scored higher for management effectiveness
and concerns addressed, these differences were not statistically significant. Thus, despite major
investments by council and by participating residents in those collaborative processes, there has not been
a significant geographical signal indicating improved confidence of residents in collaborative catchments.
This lack of a spatial signal was observed by Sinner et al. (2016), and our results show that an additional
four years has not led to any significant increase in community confidence.
Within the collaborative subsample, residents did not exhibit significant trends in their scores over
time (Figure 5). There is, in fact, only one instance of significant change between 2015 and 2019: in
Hawke’s Bay, on the question of management effectiveness, scores declined significantly from 2015 to
2019; this mirrored the decline in scores evident among residents from non-collaborative catchments.
Tadaki et al.: Collaborative water governance in Aotearoa New Zealand 312Water Alternatives – 2020 Volume 13 | Issue 2
Figure 4. Mean survey item scores for collaborative catchment residents vs. residents in traditional
decision-making catchments in 2019.
Note: Error bars indicate 95% confidence interval; where error bars do not overlap there is a statistically significant difference
between the means (p < 0.05).
Figure 5. Mean scores for residents within collaborative catchments in each region for the 2015, 2017
and 2019 surveys.
Note: Error bars indicate a 95% confidence interval; where error bars do not overlap there is a significant difference between
the means (p < 0.05).
Tadaki et al.: Collaborative water governance in Aotearoa New Zealand 313Water Alternatives – 2020 Volume 13 | Issue 2
The confidence diffusion hypothesis also predicts higher scores for residents who know the most about
water management. Our survey asked respondents to indicate their participation in a list of water
management activities; from these responses, we constructed a binary variable indicating 'low' vs. 'high'
engagement. High engagement is defined as having attended or spoken at a meeting about water issues
or having contacted a government agency about water management issues, whether formally (in a
submission) or informally. Curiously, the more-engaged residents exhibited temporal trends that were
similar to other residents. Hawke’s Bay drops the most between 2015 and 2017 for all questions and then
remains low in 2019; Northland remains constant and Waikato improves incrementally. The only
significant trend for engaged Hawke’s Bay residents between 2015 and 2019 was a declining trend on the
question of management effectiveness.
Demographic predictors of confidence in environmental management
To ensure that our spatial and temporal results were not confounded by effects related to gender,
ethnicity, age or occupation, our regression model isolated the predictive effects of each variable. When
these demographic factors are held constant, being in a collaborative catchment makes no significant
difference to effectiveness, agreement and fairness scores, and makes a significant-but-small difference
to scores for responsiveness. Residents in collaborative catchments assigned scores for responsiveness
that were 0.26 points higher than residents from non-collaborative catchments.
Other demographic predictors had larger, statistically significant magnitudes. Across the four
questions, engaged residents assigned scores that were 0.8 to 1.0 points lower than less engaged
residents, and Māori residents assigned scores that were 0.5 to 0.9 points lower than non-Māori. Women
assigned scores that were 0.3 and 0.5 points lower than men for management and fairness, respectively.
The coefficient magnitude and significance of each variable is presented in Table 4.
Table 4. Tobit regression coefficients and statistical significance of predictive variables’ influence on
management effectiveness, agreement, responsiveness and fairness.
Variables Management Agreement Responsiveness Fairness
Collaborative catchment -0.007 -0.105 0.263 *
0.186
High engagement -0.792* -1.014* -0.885* -1.112*
Female -0.322* -0.364 -0.494 -0.496*
Farm background 0.219 -0.146 -0.026 0.258
Forest background -0.085 0.368 0.305 0.334
Māori -0.906* -0.497* -0.649* -0.894*
Age = 31-40 0.197 -0.883* 0.115 -0.775
Age = 41-50 0.0177 -1.279* 0.254 -1.083*
Age = 51-60 -0.073 -1.289* -0.202 -1.214
Age = 61-70 0.273 -1.068* -0.297 -0.940
Age = 71+ 1.280* 0.063* 0.859 -0.119
Year = 2017 -0.024 -0.210 0.135 0.262
Year = 2019 -0.200 -0.293 -0.177 -0.0976
Region: Hawke’s Bay -0.610* -1.357* -0.555* -0.772*
Region: Northland -0.376* -0.228* -0.412* -0.602*
Observations (n) 1,035 959 1,223 1,032
Pseudo R-squared 0.021 0.024 0.012 0.025
Note: The coefficient value indicates how much, on average, a given explanatory variable (left column) raises the score given by
respondents for that question (column heading); * = p < 0.05.
Tadaki et al.: Collaborative water governance in Aotearoa New Zealand 314Water Alternatives – 2020 Volume 13 | Issue 2
We found age to have an inconsistent effect; increasing age led to significantly and increasingly lower
scores for agreement until age 70 when scores became significantly higher than in the 21 to 30 default
group. The 41 to 50 age group assigned scores 1.1 points lower than the 21 to 30 age group for fairness,
and the 71+ age group assigned scores 1.3 points higher than the 21 to 30 age group for management
effectiveness. Neither farming nor forestry occupation variables were significant predictors of survey
scores.
Controlling for demographic variables sheds new light on temporal and regional differences. Neither
2017 nor 2019 years had a significant effect on scores once demographics were controlled; regional
differences, in contrast, are significant for all questions. Hawke’s Bay residents assigned scores 0.6 to 1.4
points lower than did Waikato residents, and Northland residents assigned scores 0.2 to 0.6 points lower
than did Waikato residents. This conforms broadly with the summarised statistics shown in Figure 3
above.
Looking across the variables, gender and ethnicity together may indicate broader patterns of
structural economic and cultural inequality in New Zealand; in this sense, it is perhaps unsurprising that
non-Māori men feel better served by environmental management, whereas Māori women feel the least
served by it. This inequality is consistent across the regions (Figure 6).
Figure 6. Scores from Māori women vs. non-Māori men for each region across all years.
Note: Error bars indicate 95% confidence interval; where error bars do not overlap there is a significant difference between the
means (p < 0.05).
Interestingly, residents who are most engaged in water management issues – those who attend or speak
at hearings and contact government agencies – had the lowest confidence in water management. With
the confidence diffusion hypothesis, it might be expected that those 'in the know' (i.e. engaged residents)
would express improved confidence first, followed by the wider catchment residents and then the region.
In contrast, our results demonstrate quantitatively that engaged residents have the least confidence in
Tadaki et al.: Collaborative water governance in Aotearoa New Zealand 315Water Alternatives – 2020 Volume 13 | Issue 2
environmental management (Figure 7); this is so even in 2019 following major investments in
collaborative processes in those areas. As suggested in relation to the 2015 survey (Sinner et al., 2016),
this could be caused by the unhappiness of engaged residents with environmental management due to
their detailed knowledge of its (mal)functioning; alternatively, it could be because residents who are
already unhappy with water management seek to become more engaged in changing it. Regardless of
the cause, it is clear that collaborative governance is not resulting in improved confidence in
environmental management from 'engaged' residents.
Figure 7. Engaged vs. non-engaged residents’ mean scores for four questions in each region (all years of
data).
Note: Error bars indicate 95% confidence interval; where error bars do not overlap there is a significant difference between the
means (p < 0.05).
EXPLAINING CONFIDENCE DIFFUSION FAILURE
This study was designed to identify whether collaborative governance processes are leading to any
improvement in community residents’ confidence in environmental management. The spatially stratified
sampling allowed us to conduct a direct comparison between collaborative and non-collaborative
catchments (following Sinner et al., 2016), and our longitudinal repetition of the survey enables us to see
how observed patterns have changed over time. This survey is, to our knowledge, the first systematic
attempt to measure legitimacy benefits of new collaborative decision-making arrangements as assessed
by the communities affected by those decisions.
It is therefore both intriguing and troubling that collaborative governance processes have not led to
significant improvements in community confidence in environmental management. Not only is this true
of all residents in these regions, but it is specifically true of residents within collaborative catchments and
residents who engage the most with water management. These results provide evidence against the
Tadaki et al.: Collaborative water governance in Aotearoa New Zealand 316Water Alternatives – 2020 Volume 13 | Issue 2
confidence diffusion hypothesis on all three counts. While we did observe a statistically significant
coefficient for collaborative catchments offering higher scores than non-collaborative catchments on one
measure (responsiveness), this coefficient (0.26 on a 0 to 10 scale) is small in comparison to other
predictors such as engagement (about 1.0), ethnicity (about 0.75), or region (about 0.5).
The observed lack of confidence diffusion could result from at least four possible causes:
1. Survey failure: the surveyed measures are not relevant social constructs;
2. Collaboration failure: the collaborative processes 'failed' to generate better policy that would
inspire community confidence;
3. Representation failure: collaborative processes benefitted participating residents but not others;
or
4. Communication failure: collaborative processes generated policy benefits applicable to all, but
these remain known only to a small number of people.
The first possibility is that our survey design was flawed. It only sampled residents with landline
telephones, and so if landline ownership is correlated with confidence in environmental management,
this biases our results; however, although the survey design could not control for telephone ownership,
it did ensure a substantial sample size for residents in collaborative and non-collaborative catchments
within each region, so any bias would be consistent across regions and over time, enabling comparison
of the (potentially biased) sample in a transparent way. It is, even so, still troubling that this large sample
of people from three regional communities did not express improved confidence in water management
four years after a paradigm shift in local government decision-making.
There is also the wording of the survey itself. Did our questions measure the most relevant and reliable
constructs for capturing the idea of 'legitimacy'? The statistically significant drop in management
effectiveness scores in Hawke’s Bay from 2015 to 2017 and the fact of these scores remaining low in 2019
suggests that the survey was measuring something 'real'. The Hawke’s Bay decline was statistically
significant only for management effectiveness, even though scores for other questions also dropped.
Given that it took a major outbreak of water-related illness to produce a significant trend for only one
survey construct, it appears that a large event is required to shift residents’ survey scores.
The use of survey constructs to benchmark the legitimacy of environmental management may thus
be insensitive within the timescales, action domains and communication networks relevant to evaluating
changes to water reform. Although scholars such as Marshall and Lobry De Bruyn (2019) have argued
that legitimacy surveys among the wider community can help identify which governmental actions
improve or decrease legitimacy (and thereby prioritise more legitimate types of governmental action),
our results suggest that such measures may not generate results that can be used to meaningfully
evaluate specific governmental interventions. In advising future efforts, we encourage researchers to
search for a more sensitive construct for legitimacy than that used here, perhaps one that measures
qualitative distinctions in attitudes rather than changes on a quantitative Likert scale.
Collaboration failure is another possibility. It is plausible that the three regions variously failed in their
efforts to create valued policy solutions. This could be because of i) failing to achieve consensus, ii)
reaching consensus but then addressing water management problems inadequately (as judged by the
community), iii) being considered by the community to be elitist and without legitimacy, or iv) consensus
recommendations were of a high objective quality yet did not alter councils’ ultimate decisions, meaning
that collaboration was ineffective. Our Likert scale data cannot differentiate between these reasons but
we can reflect on how they might manifest themselves. All three sets of collaborative processes
generated specific and policy-relevant recommendations for water management, though this does not
guarantee that recommendations were of a high objective quality. The Ministry for the Environment, for
example, considered that Northland’s consensus-recommended freshwater rules were ecologically
permissive (MfE, 2017c), while Hawke’s Bay and Waikato’s consensus recommendations were under
Tadaki et al.: Collaborative water governance in Aotearoa New Zealand 317Water Alternatives – 2020 Volume 13 | Issue 2
threat of formal challenge by participants from the agricultural industry who broke ranks from the group
(MfE, 2017d, a).
Collaborative governance is difficult; in real-world situations it is not reasonable to expect a 'perfect'
collaborative process with perfect outcomes. With this study, we have been interested precisely in
whether a reasonable and good-faith investment into collaboration by regional councils and a broad
swath of participating community actors can lead to improvements in governance legitimacy. Given that
these three collaborative processes have been positively evaluated by central government agencies (MfE,
2017b; Office of the Auditor-General, 2019) and independent researchers (Cradock-Henry et al., 2017;
Dingfelder, 2016; Tadaki, 2018), it is plausible that these are 'reasonably successful' variants of
collaborative decision-making. Interpreted in this way, our results suggest that even reasonably
successful collaborative governance on its own is not sufficient to generate discernible improvements in
public judgements of legitimacy of water management.
Is it also possible that collaboration benefitted those who participated but not the wider community?
The confidence diffusion hypothesis assumes not only that collaborating parties will benefit, but that
their recommendations will benefit the wider community and that the benefit will become known
through networks of information. One might expect that those who are most informed about water
management issues – that is, the most engaged residents – will know about and positively value
environmental management undertaken collaboratively; our results, however, show that engaged
residents have more negative assessments of environmental management than other residents. This
disparity is significant and was consistently observed across 2015, 2017 and 2019, and this result
quantitatively validates the earlier observation of Sinner et al. (2015) that engaged residents were the
most negative in their descriptions of the legitimacy of the collaborative process and its outcomes. This
discrepancy between engaged and less engaged groups could have at least two explanations. One
explanation is that because most 'engaged' residents are not invited to participate in collaborative
processes, they feel personally excluded and proceed to negatively judge (or at least, not positively value)
the legitimacy of those processes; another explanation is that the more and less engaged residents have
different respective channels of information and form their opinions in different ways. Less-engaged
residents, for instance, may form their judgements based on high level media coverage, whereas more-
engaged residents may form their judgements through specific interactions with environmental
management actors, specific policy documents, and ideologically stratified news channels. While our
survey results cannot identify the specific cause of the engaged–disengaged discrepancy in
environmental management attitudes, they do show that collaboration has not significantly ameliorated
this difference over time as might be expected through engaged residents becoming more positive.
A fourth and perhaps most benign possibility is that collaboration succeeded and was beneficial to all,
but that this information has failed to reach the wider public. In the 2015 survey, residents were asked
whether they were aware of collaboration in their catchment (Sinner et al. (2016); only 21% of residents
in collaborative catchments indicated 'yes' and, surprisingly, 15% of residents in non-collaborative
catchments incorrectly indicated that 'yes', they were aware of collaboration in their catchment. It is
possible that these latter residents correctly identified that collaboration was happening at some scale in
their region, but they incorrectly located it within their own catchment. This suggests that information
dissemination occurs through high-level narratives and that it is not realistic to expect nuanced, place-
based details to affect community attitudes more than the high level narratives. The implications of this
for accountability of collaborative decision-making are worrying. If the wider public is only listening to
the high level narrative, then actors who have a disproportionate ability to designate collaboration a
'success' or a 'failure' in the public mind can use this power to legitimise outcomes that align with their
interests, or to delegitimise those that do not. For governance researchers, this highlights the importance
of identifying who controls the high level narrative, and by what means and to what extent public
perceptions have been shaped by these actors.
Tadaki et al.: Collaborative water governance in Aotearoa New Zealand 318Water Alternatives – 2020 Volume 13 | Issue 2
A variation on this communication failure is that there has perhaps still not been enough time for a
confidence signal to emerge. Even though all collaborative groups that were studied here have issued
formal recommendations, these recommendations have not been adopted and implemented through
statutory planning mechanisms. The Waikato recommendations have been incorporated into Healthy
Rivers Plan Change 1, but this change remains subject to legal appeals before it can become operative.
Northland’s and Hawke’s Bay’s collaborative group recommendations have been made and are being
incorporated into draft planning rules that are still out for public consultation. The recommendations
have thus not yet achieved the status of enforceable rules for any of the three regions. It seems
reasonable to expect, however, that given the generally interested and rural nature of these
communities, the legitimacy and quality of the collaborative decision-making process should have
become established and thus be visible by now, at least among engaged residents.
CONCLUSION AND IMPLICATIONS
Our survey is a unique attempt to measure community confidence in water management institutions
over time in response to collaborative decision-making initiatives. Our hypothesis was that collaborative
mechanisms would enhance the responsiveness, effectiveness and fairness of environmental
management as judged by the local community, especially among those who are closest geographically
and topically to water management. The results show, however, that community confidence has not
significantly improved over time and that it has significantly worsened in one region (albeit due to a major
external shock). While our survey results cannot isolate the cause of confidence diffusion failure, we offer
four interrelated explanations that include survey failure, collaboration failure, representation failure,
and communication failure.
These results should give environmental practitioners and researchers pause to reflect on what is
hoped to be achieved by promoting collaborative governance. This survey was designed to isolate and
amplify any signals of improved confidence in environmental management. We compared collaborative
with non-collaborative catchments; we looked across three different regions; we looked at engaged
residents’ scores; and we looked at the effects of other demographics. Residence within a collaborative
catchment is a significant predictor only for a single measure (responsiveness), and the magnitude of this
effect is small compared to other variables. Our approach to assessing the democratic benefits of
collaborative decision-making contrasts with mainstream approaches that use participant assessments
to evaluate these processes (Margerum, 2011; Blackstock et al., 2012; Cradock-Henry et al., 2017), or
which advocate specific emphasis on environmental outcomes (Koontz et al., 2020; Scott, 2015)
The implications of our findings are considerable. If collaboration can produce 'better' decisions only
for those who participate in making those decisions, then are advocates of collaborative governance
complicit in crafting new mechanisms of elite rule? If collaboration is only ever judged by those who
participate in it and never by the wider 'silent majority', then how can we be confident that collaboration
is enhancing democracy?
Evaluating the democratic effects of collaborative governance is not the same as evaluating
collaborative processes themselves. Understanding the views of participants in those processes enables
the identification of the procedural and substantive benefits of any given collaborative process. Such
evaluation can and must proceed but is not enough on its own; it should also be accompanied by a wider
effort to understand whether collaborative governance is improving the real and felt experiences of
political agency of the citizenry (Agger and Löfgren, 2008; Marshall and Lobry De Bruyn, 2019). If
collaboration is not causing the wider community to feel that governance is more effective, responsive
and fair, then advocates (including researchers) must produce compelling explanations for why
collaborative governance is still justified from a democratic perspective.
The survey presented here provides a way of evaluating the claimed benefits of collaborative
governance for democracy. While our survey did not detect the hypothesised changes in community
Tadaki et al.: Collaborative water governance in Aotearoa New Zealand 319You can also read