DrugComb update: a more comprehensive drug sensitivity data repository and analysis portal
←
→
Page content transcription
If your browser does not render page correctly, please read the page content below

W174–W184 Nucleic Acids Research, 2021, Vol. 49, Web Server issue                                                      Published online 1 June 2021
https://doi.org/10.1093/nar/gkab438

DrugComb update: a more comprehensive drug
sensitivity data repository and analysis portal
Shuyu Zheng1 , Jehad Aldahdooh1 , Tolou Shadbahr1 , Yinyin Wang1 , Dalal Aldahdooh1 ,
Jie Bao1,2 , Wenyu Wang1 and Jing Tang 1,*
1
    Research Program in Systems Oncology, Faculty of Medicine, University of Helsinki, Helsinki FI-00290, Finland and
2
    Institute for Molecular Medicine Finland, University of Helsinki, Helsinki FI-00290, Finland

                                                                                                                                                              Downloaded from https://academic.oup.com/nar/article/49/W1/W174/6290546 by guest on 17 December 2021
Received March 24, 2021; Revised April 18, 2021; Editorial Decision April 28, 2021; Accepted May 06, 2021

ABSTRACT                                                                        GRAPHICAL ABSTRACT
Combinatorial therapies that target multiple path-
ways have shown great promises for treating com-
plex diseases. DrugComb (https://drugcomb.org/) is
a web-based portal for the deposition and analy-
sis of drug combination screening datasets. Since
its first release, DrugComb has received continu-
ous updates on the coverage of data resources, as
well as on the functionality of the web server to im-
prove the analysis, visualization and interpretation
of drug combination screens. Here, we report sig-
nificant updates of DrugComb, including: (i) manual
curation and harmonization of more comprehensive                                INTRODUCTION
drug combination and monotherapy screening data,                                Despite the scientific advances in the understanding of
not only for cancers but also for other diseases such                           complex diseases such as cancer, there remains a ma-
as malaria and COVID-19; (ii) enhanced algorithms                               jor gap between the vast knowledge of molecular biol-
for assessing the sensitivity and synergy of drug                               ogy and effective treatments. Next generation sequencing
combinations; (iii) network modelling tools to visual-                          has revealed intrinsic heterogeneity across cancer samples,
ize the mechanisms of action of drugs or drug com-                              which partly explain why patients respond differently to
                                                                                the same therapy (1). For the patients that lack common
binations for a given cancer sample and (iv) state-
                                                                                oncogenic drivers, multi-targeted drug combinations are ur-
of-the-art machine learning models to predict drug                              gently needed, which shall block the emergence of drug re-
combination sensitivity and synergy. These improve-                             sistance and therefore achieve sustainable efficacy (2). To
ments have been provided with more user-friendly                                facilitate the discovery of drug combination therapies, high-
graphical interface and faster database infrastruc-                             throughput drug screening techniques have been developed
ture, which make DrugComb the most comprehen-                                   to allow for a large scale of drug combinations to be tested
sive web-based resources for the study of drug sen-                             for their sensitivity (percentage inhibition of cell growth)
sitivities for multiple diseases.                                               and synergy (degree of interaction) in-vitro (3). Further-
                                                                                more, patient-derived cancer cell cultures and xenograft
                                                                                models have been developed, which make the drug discov-
                                                                                ery closer to the actual patients (4–6).
                                                                                   With the increasing amount of drug sensitivity screening
                                                                                data, the challenge of translating them into actual drug dis-
                                                                                covery remains, as recent studies showed that most of clini-
                                                                                cally approved drug combinations work independently (7),
                                                                                that the efficacy and synergy observed in a pre-clinical set-
                                                                                ting may not be translated into a clinical trial (8,9). The
                                                                                challenge of utilizing the results from drug combination
                                                                                screens largely resides from un-harmonized metrics for syn-

* To   whom correspondence should be addressed. Tel: +35 845 868 9708; Email: jing.tang@helsinki.fi


C The Author(s) 2021. Published by Oxford University Press on behalf of Nucleic Acids Research.
This is an Open Access article distributed under the terms of the Creative Commons Attribution License (http://creativecommons.org/licenses/by/4.0/), which
permits unrestricted reuse, distribution, and reproduction in any medium, provided the original work is properly cited.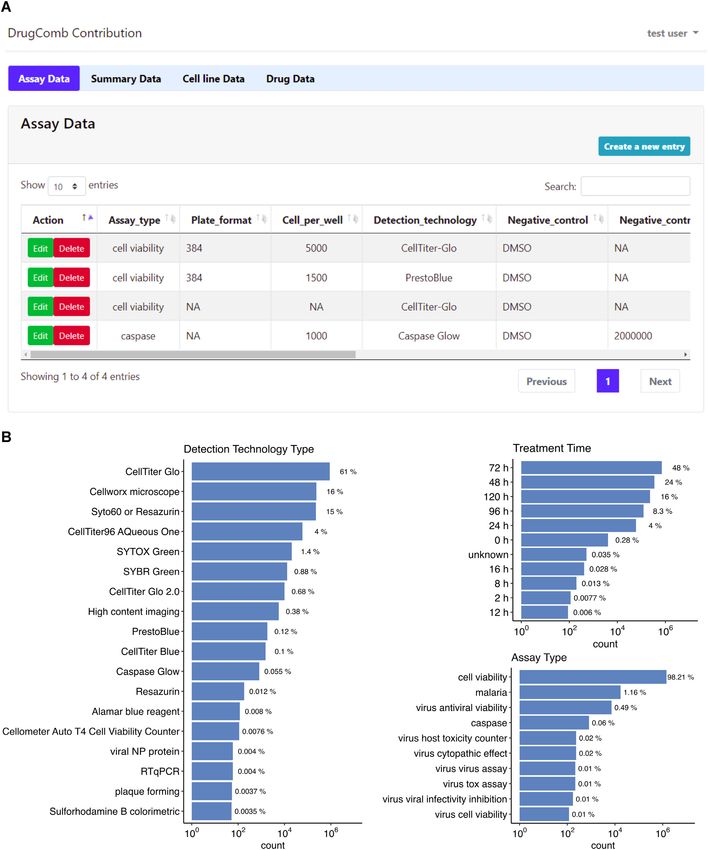
Nucleic Acids Research, 2021, Vol. 49, Web Server issue W175

ergy and sensitivity that are derived from different mathe-         nization framework thus allows a more systematic evalua-
matical models, which are often incompatible for the same           tion of a drug combination in comparison to a single drug.
datasets (10). Another limitation is the lack of standardiza-       In addition, we implement several new modules for the anal-
tion of drug combination experimental design and the in-            ysis of these datasets, including the integration of drug tar-
sufficient level of data curation and deposition to publicly        gets and gene expressions of neighbouring proteins in a sig-
available databases (11). Furthermore, the drug combina-            nalling network, such that the mechanisms of action of a
tion data has not been harmonized with single drug screen-          drug or a drug combination can be annotated systemati-
ing data, partially due to a lack of computational tools to         cally in a specific cellular context. We also provide a baseline
enable a systematic comparison of drug combination effi-            model based on CatBoost to predict the sensitivity and syn-
cacy against single drug efficacy (12).                             ergy of drug combinations, with which the machine learning
   To initialize the efforts for curating drug combination          community may develop novel algorithms to improve our
datasets, and to facilitate a community-driven standard-            understanding of drug responses in cancer cells. Taken to-
ization of evaluation of the degree of synergy and sensi-           gether, the new version of DrugComb features an enhanced

                                                                                                                                       Downloaded from https://academic.oup.com/nar/article/49/W1/W174/6290546 by guest on 17 December 2021
tivity of drug combinations, we have provided DrugComb              web portal to make drug screening data more interpretable
as the very first data portal to harbour the manually cu-           and reusable for various applications such as machine learn-
rated datasets as well as the web server to analyse them (13).      ing, network modelling and experimental validation.
The original version of DrugComb consists of four major
high-throughput studies, which served as a reference dataset        RESULTS
for developing machine learning algorithms to predict drug
combination sensitivity and synergy (14). Different from            Overview of the DrugComb portal
other recent databases including DrugCombDB (15) and                DrugComb portal consists of two major components in-
SynergxDB (16), DrugComb is a unique resource as it is              cluding a database for harbouring the most recent drug
a compendium of database and web application, not only              screening datasets as well as a web server to analyse and vi-
for depositing deeply curated public datasets but also for          sualize these datasets or user-uploaded datasets for the de-
the analysis and annotation of user-uploaded data. Further-         gree of sensitivity and synergy. For retrieving the database,
more, DrugComb provides detailed visualization of drug              users can query by drug names, cell line names as well as
combination sensitivity and synergy, which shall greatly fa-        study names. For utilizing the web server to analyse user-
cilitate the understanding of drug interactions at specific         uploaded datasets, users need to import the data accord-
dose levels. The data from DrugComb has been used to de-            ing to the format of an example file, and the results will be
velop machine learning models for drug combination pre-             shown as both tabular and image displays, which are also
diction (17,18), and synthetic lethality knowledge graph            downloadable. When users plan a drug combination exper-
(14). The analysis tools provided by DrugComb have also             iment, they may utilize the web server to predict the sensi-
helped to explore the mechanism of replication stress re-           tivity and synergy and utilize such information to guide the
sponse in colorectal cancer stem cells (19).                        selection of drugs. The drug targets as well as the gene ex-
   With the development of high-throughput screening                pressions of the signalling pathways for a given cancer cell
techniques, the number of data points for drug combina-             line can be also annotated as a network model. In the fol-
tions has been greatly increased. For example, the recent           lowing, we describe how we have improved the coverage of
Dream Challenge on drug combination prediction has pro-             the database as well as the data analysis modules of the web
vided more than 20k drug combinations in cancer cell lines          server with a range of algorithms, and the new implementa-
(20). Furthermore, drug combination screening has been              tion techniques to accelerate data curation and harmoniza-
extended to other disease models such as malaria and Ebola          tion efficiency (Figure 1).
(21). More recently, drug combination screening studies on
COVID19 have been conducted, providing important clues
                                                                    Data sources
for the treatment of the ongoing pandemic (22). In the new
version of DrugComb, we aim to expand our manual cura-              The initial version of DrugComb consists of four drug com-
tion from cancer to other diseases to improve the data cover-       bination screening studies, covering 437 923 drug combina-
age. On the other hand, drug combinations need to be har-           tion experiments. We have curated much more drug combi-
monized with the monotherapy drug screening data, since             nation experiments for cancer cell lines. Furthermore, we
these treatment options shall be evaluated using the same           have incorporated monotherapy drug screening datasets
endpoint metric (such as progression free survival and over-        and considered them as a subset of a drug combination ex-
all survival) in clinical trials. Therefore, we aim to harmo-       periment, where the other drug is absent. We have also in-
nize the drug combination with monotherapy drug screen-             cluded the drug screening results from patient-derived can-
ing, by providing informatics tools to evaluate their over-         cer samples in haematological malignancies (5). In addi-
all sensitivity in a more systematic manner. For this rea-          tion to multiple cancer types, we have extended the cura-
son, in the new version of DrugComb, we do not limit our-           tion efforts to other diseases such as Ebola, malaria and
selves for curating drug combination data, but rather we in-        COVID-19. The manual curation is under high level of
cluded monotherapy drug sensitivity screening data as well.         quality control, that only those studies that reported the
More importantly, we provide a robust metric to enable a            raw dose-response results will be considered, and thus the
direct comparison of drug combinations and single drugs,            studies that reported only summary-level results including
as monotherapy drug screening can be considered as a sub-           IC50, AUC (area under the dose response curves) or syn-
set of drug combination experiments. The new data harmo-            ergy scores (e.g. combination index) are excluded. We uti-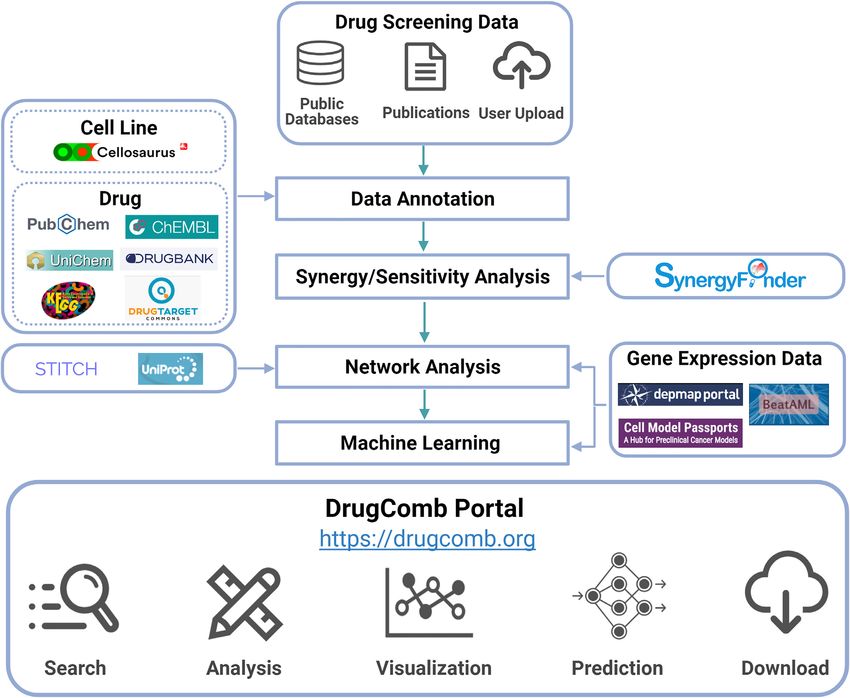
W176 Nucleic Acids Research, 2021, Vol. 49, Web Server issue

                                                                                                                                                             Downloaded from https://academic.oup.com/nar/article/49/W1/W174/6290546 by guest on 17 December 2021
Figure 1. A schematic overview of the DrugComb database and web server pipeline. Drug combination and monotherapy drug screening datasets are
curated from public databases, publications or user-upload. After quality control and pre-processing, the cell information is retrieved from Cellosaurus
(23), while the drug information is retrieved from multiple databases including PubChem (24), ChEMBL (25), UniChem (26), DrugBank (27), KEGG (28)
and DrugTargetCommons (29). The degree of synergy in drug combinations, as well as the sensitivity of drug combinations and single drugs are determined
using the SynergyFinder R package (3). For inferring the mechanisms of action of drugs or drug combinations, their targets as well as interacting proteins
are visualized in a signalling network, retrieved from STITCH (30) and UniProt (31). Furthermore, the gene expressions of these proteins in the given
cancer cells are obtained from DepMap (32) and Cell Model Passports (33), and from BeatAML where the cancer samples were derived from AML (Acute
Myeloid Leukaemia) patients (5). Machine learning algorithms utilize chemical structural and gene expression features to predict drug combination synergy
and sensitivity. The DrugComb portal enables the query and download of curated raw datasets and analysis results, as well as the contribution of new
datasets.

lized SynergyFinder (3) to determine the synergy scores                        tology) (34), that is commonly adopted for major chemical
directly from the raw dose-response data and compared                          biology databases including ChEMBL (25), PubChem (24)
them with those reported in the original publications. Only                    and DrugTargetCommons (29). For the drugs and cell lines
the datasets that have a correlation higher than 0.6 will be                   we provided the cross-database references such that their
included. Furthermore, dose-response matrices containing                       pharmacological and clinical information can be easily ac-
abnormal response values, for example percentage inhibi-                       cessed (Figure 2A and B). As of March 2021, 751 498 drug
tion of cell growth less than −200% or larger than 200%,                       combinations, 717 684 single drug screenings from 37 stud-
were marked as poor-quality data points for which the data                     ies are deposited in DrugComb, corresponding to 21 621
analysis results were not shown in the web interface. We                       279 unique data points spanning 2320 cell lines including
have also standardized the metadata about experimental                         225 cancer types and three infectious diseases. Supplemen-
protocols of these studies so that their differences can be                    tary Table S1 shows the summary of the data points from
evaluated more systematically. The annotation of the bioas-                    the individual studies that are curated and harmonized in
say protocols is based on the BAO (Bioassay annotation on-                     DrugComb.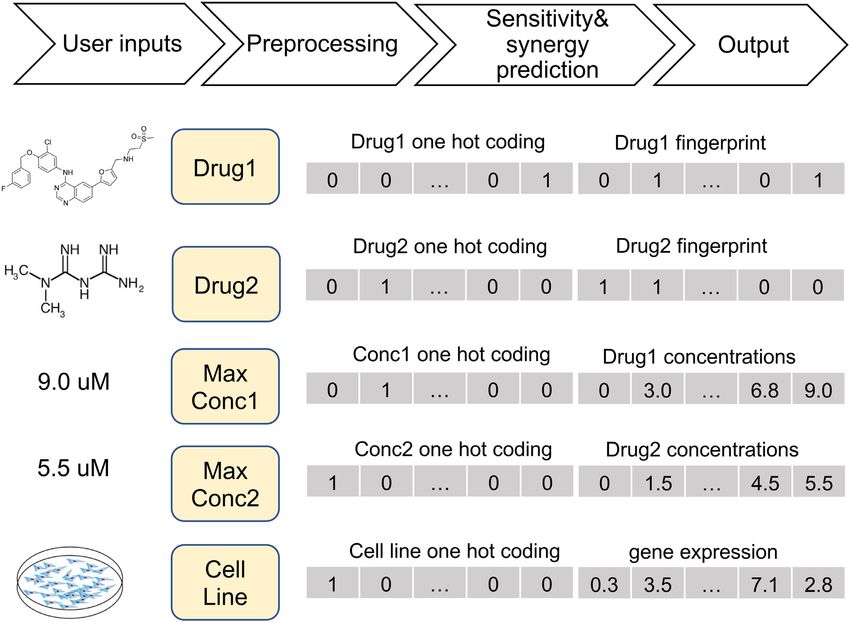
Nucleic Acids Research, 2021, Vol. 49, Web Server issue W177

                                                                                                                                                                Downloaded from https://academic.oup.com/nar/article/49/W1/W174/6290546 by guest on 17 December 2021

Figure 2. Overview of DrugComb data statistics. (A, B) Classifications of cell lines (n = 2320) and drugs (n = 8397). (C) The CSS score for drug combinations
is higher than the RI score for monotherapy drugs, suggesting the general rationale for drug combination studies. (D) The correlations of synergy scores.
(E) An example of SS plot for vorinostat and sorafenib combination across 128 cell lines. DLD-1 is a colon cancer cell line, which has shown strong synergy
and sensitivity to the combination (38). (F) The synergy landscape over the dose-response matrix of vorinostat and sorafenib in DLD-1.
W178 Nucleic Acids Research, 2021, Vol. 49, Web Server issue

Algorithms for assessing sensitivity and synergy                 we provide the boxplots and histograms to show the general
                                                                 distributions of the synergy and sensitivity scores, such that
DrugComb utilizes the SynergyFinder R package to anal-
                                                                 the users may assess the general trend. For example, users
yse drug combination sensitivity and synergy. The single
                                                                 may evaluate whether drug combinations involving a par-
drug sensitivity is characterized as a dose-response curve
                                                                 ticular drug tend to be more synergistic, or a cell line tends
with its IC50 and RI (relative inhibition) values. RI is the
                                                                 to be more sensitive to drug treatment. Note that the ma-
normalized area under the log10 -transformed dose-response
                                                                 jority of the data points (93.2%) that we curated from the
curves, which has shown enhanced robustness to character-
                                                                 literature do not contain replicates, and therefore, we decide
ize drug sensitivity (35). Moreover, RI can be interpreted as
                                                                 not to provide the statistical significance of the synergy and
percentage inhibition, summarizing the overall drug inhibi-
                                                                 sensitivity over a dose-response matrix, as the significance
tion effects relative to positive controls. With the RI met-
                                                                 of individual doses contributing to the overall synergy can-
ric, drug responses of different concentration ranges can be
                                                                 not be systematically assessed. Therefore, we would like to
compared, in contrast to IC50 or EC50, which are usually a
                                                                 highlight the issue of lack of replicates from a typical drug

                                                                                                                                  Downloaded from https://academic.oup.com/nar/article/49/W1/W174/6290546 by guest on 17 December 2021
relative term depending on the tested concentration ranges.
                                                                 combination screening that may likely hinder the transla-
   For drug combination sensitivity, we provide a metric
                                                                 tion of the results into clinical trials.
called CSS (Combination Sensitivity Score), that is based
on the normalized area under the log10 -transformed of
the combination dose-response curve when one of the two          Network modelling for the mechanisms of action
drugs is fixed at its IC50 concentration (12). CSS and RI        Once a drug combination experiment has been conducted,
use the same principle to characterize the overall drug re-      for which the results were analysed with the sensitivity and
sponse efficacy, such that their values can be directly com-     synergy scoring, the next question would be the mechanisms
pared (Figure 2C). For evaluating the drug synergy, we im-       of action of the drug combinations. Network modelling of
plement four major mathematical models including Bliss,          drug combinations have been recently introduced as an ef-
Loewe, HSA and ZIP (36) and provide the visualization of         ficient approach for the interpretation of drug combina-
these scores in the dose-response matrices. Furthermore, we      tions, as well as the identification of predictive biomark-
provide a synergy score called S score that is derived from      ers from molecular profiles of cancer (39–42). In Drug-
the difference between CSS and RI scores of the combina-         Comb, the drugs are annotated with their target profiles,
tion and single drugs respectively (12). Drug combinations       and these profiles were further annotated in the signalling
with synergy scores of zero are considered additive, while a     networks of cancer cells, such that their first and secondary
positive synergy score suggests synergy, and a negative score    neighbour proteins can be also retrieved. We utilize the
suggests antagonism. The five synergy scores are based on        databases including ChEMBL, PubChem and DrugTarget-
different mathematical assumptions such that they do not         Commons for their primary and secondary targets, and re-
necessarily match with each other (Figure 2D). For ex-           trieve STITCH for the signalling networks. Furthermore,
ample, the Bliss model assumes probabilistic independence        we have incorporated the transcriptomics profiles of the
when drugs are non-interactive while the Loewe model as-         cancer cell lines into the network, such that their gene ex-
sumes that the efficacy of non-synergistic drug combina-         pression values can be also displayed (Figure 3A). In ad-
tions is identical to that of a drug combined with itself.       dition, we provide the correlation of the gene expression
The ZIP model, on the other hand, can be considered as           and drug sensitivity such that those neighbouring genes
an Ensembl model as it combines the assumptions of Bliss         for which their gene expressions are highly correlated with
and Loewe (36). In actual clinical trials, approval of a drug    the drug sensitivity will be further identified as potential
combination often is based on the HSA model that simply          biomarkers (Figure 3B).
shows that the drug combination improves patient survival           For user-uploaded drug combinations or single drugs,
compared to monotherapies. To insure the clinical transla-       ideally the InChiKeys of the drugs should be provided.
tion of drug combinations, we encourage the use of all the       This allows the web server to query drug STITCH ID from
major synergy scoring metrics, such that the top hits that       the major drug databases. In case only the drug names are
pass the threshold of all of them can be prioritized (37). On    provided, the web server will query from the major drug
the other hand, there have been biases by focusing solely        databases, for which their targets profiles will be visual-
on the synergy, while the sensitivity of a drug combination      ized in a generic cancer signalling network. In case the cell
might be understudied. It is likely that a drug combination      line names can be matched with the existing gene expres-
produces strong synergy while their overall efficacy is not      sion data, their gene expression values will be displayed as
achieving therapeutic relevance. Therefore, we provide an        coloured nodes. The network modelling results should be
SS (Synergy-Sensitivity) plot to ensure that both of these       interpreted together with the actual drug screening profiles,
two scores can be evenly weighted when interpreting the rel-     such that the drug resistance or sensitivity can be related to
evance of a drug combination (Figure 2E, Supplementary           its target or neighbouring gene expressions (Figure 3B).
Figure S1).
   As a unique feature of DrugComb, we visualize the syn-
ergy scores of a drug combination at each tested dose. The       Machine learning for predicting sensitivity and synergy
so-called synergy landscape allows a rich information dis-       Upon the large volume of drug combination data curated in
play to facilitate the interpretation of the data, for which     DrugComb, we provide the state-of-the-art machine learn-
the most synergistic and antagonistic doses can be identified    ing algorithms to predict the sensitivity and synergy for a
separately (Figure 2F). For a given drug or a given cell line,   user-selected drug combination on a given cancer cell line.
Nucleic Acids Research, 2021, Vol. 49, Web Server issue W179

                                                                                                                                                                 Downloaded from https://academic.oup.com/nar/article/49/W1/W174/6290546 by guest on 17 December 2021
Figure 3. Network modelling of drug combinations. (A) An example of veliparib and 5-fluorouracil combination in A2058 melanoma cell line. Drug targets
and neighbouring proteins are annotated with their gene expression values, some of which can be modulated by other drugs shown as rectangular boxes.
(B) Gene expressions of the neighbouring proteins in A2058 as compared with the correlations of these genes with the drug combination sensitivity across
all the tested cell lines. PARP2 is the primary target of veliparib, which shows top gene expression in A2058 as well as the highest correlation with the drug
combination, suggesting that PARP2 is a potential biomarker for predicting the drug combination sensitivity of veliparib and 5-flurouracil.

Figure 4. Workflow of machine learning prediction of drug combination sensitivity and synergy. Multiple features are integrated in CatBoost including
one-hot encoding of drugs, concentrations and cell lines as well as their specific features including drug chemical fingerprints, drug concentrations and cell
line gene expressions.
W180 Nucleic Acids Research, 2021, Vol. 49, Web Server issue
We utilize the ONEIL data (43) to train a CatBoost model, Table 1. Prediction accuracy of the CatBoost algorithm tested on ONEIL
which has been considered as a reference algorithm for data
many machine learning tasks (44). The ONEIL data con- Correlation R2 RMSE
sists of 583 drug combinations involving 38 drugs tested in
39 cell lines, resulting in 92 208 drug combination experi- INHIBITION 0.98 0.97 7.12
HSA 0.79 0.62 8.03
ments consisting of 2 305 200 data points. The ONEIL data ZIP 0.89 0.80 6.55
has been considered a high-quality dataset, as it contains LOEWE 0.57 0.32 9.68
multiple replicates and has been utilized in previous ma- BLISS 0.87 0.75 7.65
chine learning development (45–47). The CatBoost model
is based on decision-trees that can facilitate the integra-
tion of different types of features including textual, categor- ity of the uploaded information, and then integrate them
ical and numerical values. To build our model, the names into the database via the data analysis and annotation func-
of drugs and cell lines are specified as categories in our
Downloaded from https://academic.oup.com/nar/article/49/W1/W174/6290546 by guest on 17 December 2021
tions (Figure 5A). In addition to the actual data points as
feature vectors. Additionally, the concentrations for drugs an outcome of such a data curation effort, we can also sys-
are considered as both numeric values and categories. The tematically evaluate the differences in the assay protocols
cell line’s gene expression and compound’s structural finger- (Figure 5B), which might provide more insights on assess-
prints (MACCS) are considered as numerical values. More- ing the reproducibility of the drug sensitivity screens (48).
over, in order to accelerate the training process for our Taken together, we believe that the data contribution may
model we consider only top 5% most variant genes (n = 153) greatly facilitate the open access of drug screening data and
across the 39 cell lines (Figure 4). therefore we encourage the users of DrugComb to be part
Among all the CatBoost hyper-parameters, only four of of the community-driven data curation team in the future.
them show high importance for obtaining the best model.
Those hyper-parameters include iterations that indicate the
number of trees used in the model, maximum depth of the Technical aspects
tree, the learning rate used for gradient steps, and the L2
regularization for the loss function. The best values for DrugComb is built using PHP 7.4.14 [Laravel Frame-
mentioned parameters are set and the rest of the hyper- work 6.20.7] for server-side data processing, Javascript EC-
parameters are set to the default values. For drug combina- MAScript 2015 for the frontend, D3.js 5.7.0, Vis.js 4.18.1
tion inhibition and synergy scores, a model has been trained and Plotly library 1.40.0 for the generation of the interac-
separately and the results of the validation accuracy are pre- tive visualizations. Data is stored in MariaDB 10.3.17 with
sented in Table 1. RMariaDB 1.0.6.9000 as the driver for interfacing with R.
To facilitate the prediction, users need only to specify Software development tools including Python 3.6.7, numpy
the names and the maximal concentrations for each of two 1.14.1, pandas 0.23.4, scikit-learn 0.20.2, RDkit 2018.03.4,
drugs, and a cell line name. After receiving the user input, R version 3.5.1, synergyfinder 2.2.4 and tidyverse 1.2.1 are
the MACCS fingerprints of the drugs will be obtained by used in the analytical pipelines. Linux distribution CentOS-
the RCDKlibs package in R, and the cell line gene expres- 8 with the kernel 4.18.0 64-bit running on four processor
sion data will be retrieved internally from DrugComb. The cores and 64 Gb of RAM is used for hosting the web ser-
pre-processed data will be loaded into the trained models vice on a computational cluster.
to predict the inhibition values and synergy scores for a The data portal has been designed in a straightforward
10×10 equally distanced dose matrix within the given max- manner to maximize the user flexibility to retrieve the ex-
imal concentrations. isting datasets as well as to analyse their own datasets. We
provided the API access at http://api.drugcomb.org such
that users can request data as json files. The API is imple-
Data contribution mented using the PHP laravel framework. Instructions of
To facilitate the data curation, we have provided a web each of the modules are provided in their associated web
server for users to upload their drug combination data into pages and the overview of the data portal was summarized
the database. The ‘Contribute’ panel will ask for the anno- as tutorial video available at the home page. We aim to
tation information of the drug combination screening re- continue accommodating new features such as cloud-based
sults, and then the actual data points will be formulated as computing and data infrastructure to facilitate the FAIR-
a tabular format. We have utilized the contribution module ness (Findable, Accessible, Interoperable and Reusable) of
to curate the majority of the literature datasets and found drug screening data analysis. Meanwhile, the community-
that it greatly facilitates the burden of the data contribu- based features such as data contribution and quality control
tors as well as data curators. For example, autofill func- can be developed further.
tions are available when users input the literature citation
and drug names. The cell line annotation is also available by
DISCUSSION
retrieving the Cellosaurus website for its disease classifica-
tion and other cross-reference links. Furthermore, data con- Making cancer treatment more effective is what a com-
tributors are guided to provide critical information about bination therapy aims to achieve. With the advances of
assay protocols, such as detection technologies and culture high-throughput drug screening technologies, an increasing
time. When the data has been successfully uploaded, we will number of drug combinations have been tested. However,
first manually check the format, completeness, and valid- before we can develop robust machine learning and networkNucleic Acids Research, 2021, Vol. 49, Web Server issue W181
Downloaded from https://academic.oup.com/nar/article/49/W1/W174/6290546 by guest on 17 December 2021
Figure 5. (A) The data contribution interface enables a community-driven data curation effort. (B) Statistics about assay protocols.W182 Nucleic Acids Research, 2021, Vol. 49, Web Server issue
modelling algorithms to predict and understand the poten- astrazeneca.com/. The visualization results for sensitivity,
tial drug combinations, the datasets need to be systemat- synergy and network models are downloadable as im-
ically curated and harmonized. Here we report the major ages. The source code for analysing the drug combination
updates of DrugComb, a comprehensive data portal for the datasets is available as the R package SynergyFinder ver-
drug discovery community to access the concurrent high- sion 2.2.4 (https://bioconductor.org/packages/release/bioc/
throughput drug combination as well as monotherapy drug html/synergyfinder.html). We are committed to open data
screening datasets. These datasets have been deeply curated, and welcome any researchers to participate in the develop-
standardized and harmonized with the data analysis tools ment of data curation and harmonization tools for drug dis-
including synergy and sensitivity scoring, such that their po- covery.
tential can be maximized within a unified framework. Fur-
thermore, we have updated the network modelling of the
SUPPLEMENTARY DATA
drug combinations, such that the transcriptomics profiles
of the cancer cell line, and drug target profiles can be inte- Supplementary Data are available at NAR Online.
Downloaded from https://academic.oup.com/nar/article/49/W1/W174/6290546 by guest on 17 December 2021
grated in a signalling network where the protein-protein in-
teractions may provide deeper insights on the mechanisms
ACKNOWLEDGEMENTS
of drugs and drug combinations. In addition, we have pro-
vided a machine learning model to predict a given drug We thank the authors of the drug combination studies to
combination for a cell line at the single dose level. To the share their datasets, especially the AstraZeneca for agree-
best of our knowledge, this is the first drug combination ing the Dream Challenge data to be part of DrugComb.
prediction tool that has been made online with easy acces- We thank also the DepMap consortium and the Cell Model
sibility for drug discovery users. Passports to make the transcriptomics profiles of cancer cell
The four basic modules of DrugComb, i.e. (i) data cura- lines freely available. We thank the NCATS and other insti-
tion, (ii) synergy and sensitivity scoring, (iii) network mod- tutions for making their drug screening datasets easily ac-
elling and (iv) machine learning constitute a workflow of cessible. The data portal is located at the CSC-IT Center for
network pharmacological approaches based on which we Science in Finland.
may gain deeper understanding of drug-drug interactions.
Currently, DrugComb focuses on small molecule drugs
FUNDING
such as cytotoxic and kinase inhibitors, while immunother-
apy and gene therapy drugs are largely missing. Furture European Research Council (ERC) starting grant Drug-
steps of DrugComb will involve constant improvement on Comb (Informatics approaches for the rational selection
the data coverage, for example, by including drugs from of personalized cancer drug combinations) [716063]; Eu-
other classes. Moreover, we will include higher-order com- ropean Commission H2020 EOSC-life (Providing an open
binations that involve more than two drugs (e.g. (21)). In ad- collaborative space for digital biology in Europe [824087];
dition, we will consider the datasets from more recent tech- Academy of Finland Research Fellow grant [317680]; Sigrid
niques of microfluidic-based drug screening (49), as well as Jusélius Foundation. Funding for open access charge: ERC
from patient-derived samples such as 3D organoid-based starting grant DrugComb. WW and JB hold salaried po-
drug screening (50) and patient-derived xenograft mouse sitions funded by University of Helsinki through Doctoral
models (51). These datasets may help identify drug combi- Program of Biomedicine (DPBM); W.W. also receives a per-
nations that are more translational to the clinics compared sonal grant from K. Albin Johanssons stiftelse.
to cell line-based studies (9). Meanwhile, the data analy- Conflict of interest statement. None declared.
sis tools will be also updated to incorporate the new data
types. For example, we will develop mathematical and sta-
tistical methods for analysing and visualizing higher-order REFERENCES
drug combinations. Taken together, we envisage that the 1. Campbell,P.J., Getz,G., Korbel,J.O., Stuart,J.M., Jennings,J.L.,
high-quality data in DrugComb will serve as a benchmark Stein,L.D., Perry,M.D., Nahal-Bose,H.K., Ouellette,B.F.F., Li,C.H.
et al. (2020) Pan-cancer analysis of whole genomes. Nature, 578,
for the development of more robust and predictive machine 82–93.
learning models, for example, to improve the transfer learn- 2. Doroshow,J.H. and Simon,R.M. (2017) On the design of
ing from one study to another study, or to an under-studied combination cancer therapy. Cell, 171, 1476–1478.
tissue (18), as well as accurate network-based models to cap- 3. He,L., Kulesskiy,E., Saarela,J., Turunen,L., Wennerberg,K.,
Aittokallio,T. and Tang,J. (2018) Methods for high-throughput drug
ture the mechanisms of drug combinations that may eventu- combination screening and synergy scoring. Methods Mol. Biol.,
ally lead to predictive biomarkers that warrant patient strat- 1711, 351–398.
ification for maximizing the efficacy of combinatorial ther- 4. Lukas,M., Velten,B., Sellner,L., Tomska,K., Hüellein,J., Walther,T.,
apies. Wagner,L., Muley,C., Wu,B., Oleś,M. et al. (2020) Survey of ex vivo
drug combination effects in chronic lymphocytic leukemia reveals
synergistic drug effects and genetic dependencies. Leukemia, 34,
DATA AVAILABILITY 2934–2950.
5. Tyner,J.W., Tognon,C.E., Bottomly,D., Wilmot,B., Kurtz,S.E.,
The synergy and sensitivity scores in DrugComb are freely Savage,S.L., Long,N., Schultz,A.R., Traer,E., Abel,M. et al. (2018)
available for download. Larger batch downloads of raw data Functional genomic landscape of acute myeloid leukaemia. Nature,
562, 526–531.
are permitted by contacting the authors. The AstraZeneca 6. Palmer,A.C., Plana,D., Gao,H., Korn,J.M., Yang,G., Green,J.,
drug combination datasets are proprietary, and a separate Zhang,X., Velazquez,R., McLaughlin,M.E., Ruddy,D.A. et al. (2020)
agreement is needed, available at https://openinnovation. A proof of concept for biomarker-guided targeted therapy againstNucleic Acids Research, 2021, Vol. 49, Web Server issue W183
ovarian cancer based on patient-derived tumor xenografts. Cancer 26. Chambers,J., Davies,M., Gaulton,A., Papadatos,G., Hersey,A. and
Res., 80, 4278–4287. Overington,J.P. (2014) UniChem: extension of InChI-based
7. Palmer,A.C., Chidley,C. and Sorger,P.K. (2019) A curative compound mapping to salt, connectivity and stereochemistry layers.
combination cancer therapy achieves high fractional cell killing J. Cheminformatics, 6, 43.
through low cross-resistance and drug additivity. eLife, 8, e50036. 27. Wishart,D.S., Feunang,Y.D., Guo,A.C., Lo,E.J., Marcu,A.,
8. Sen,P., Saha,A. and Dixit,N.M. (2019) You cannot have your synergy Grant,J.R., Sajed,T., Johnson,D., Li,C., Sayeeda,Z. et al. (2018)
and efficacy too. Trends Pharmacol. Sci., 40, 811–817. DrugBank 5.0: a major update to the DrugBank database for 2018.
9. Palmer,A.C. and Sorger,P.K. (2017) Combination cancer therapy can Nucleic Acids Res., 46, D1074–D1082.
confer benefit via patient-to-patient variability without drug 28. Kanehisa,M., Furumichi,M., Sato,Y., Ishiguro-Watanabe,M. and
additivity or synergy. Cell, 171, 1678–1691. Tanabe,M. (2021) KEGG: integrating viruses and cellular organisms.
10. Vlot,A.H.C., Aniceto,N., Menden,M.P., Ulrich-Merzenich,G. and Nucleic Acids Res., 49, D545–D551.
Bender,A. (2019) Applying synergy metrics to combination screening 29. Tang,J., Tanoli,Z.U., Ravikumar,B., Alam,Z., Rebane,A.,
data: agreements, disagreements and pitfalls. Drug Discov. Today, 24, Vähä-Koskela,M., Peddinti,G., van Adrichem,A.J., Wakkinen,J.,
2286–2298. Jaiswal,A. et al. (2018) Drug target commons: A community effort to
11. Meyer,C.T., Wooten,D.J., Lopez,C.F. and Quaranta,V. (2020) build a consensus knowledge base for drug-target interactions. Cell
Downloaded from https://academic.oup.com/nar/article/49/W1/W174/6290546 by guest on 17 December 2021
Charting the fragmented landscape of drug synergy. Trends Chem. Biol., 25, 224–229.
Pharmacol. Sci., 41, 266–280. 30. Szklarczyk,D., Santos,A., von Mering,C., Jensen,L.J., Bork,P. and
12. Malyutina,A., Majumder,M.M., Wang,W., Pessia,A., Heckman,C.A. Kuhn,M. (2016) STITCH 5: augmenting protein-chemical interaction
and Tang,J. (2019) Drug combination sensitivity scoring facilitates networks with tissue and affinity data. Nucleic Acids Res., 44,
the discovery of synergistic and efficacious drug combinations in D380–D384.
cancer. PLoS Comput. Biol., 15, e1006752. 31. UniProt,C. (2019) UniProt: a worldwide hub of protein knowledge.
13. Zagidullin,B., Aldahdooh,J., Zheng,S., Wang,W., Wang,Y., Saad,J., Nucleic Acids Res., 47, D506–D515.
Malyutina,A., Jafari,M., Tanoli,Z., Pessia,A. et al. (2019) 32. Tsherniak,A., Vazquez,F., Montgomery,P.G., Weir,B.A., Kryukov,G.,
DrugComb: an integrative cancer drug combination data portal. Cowley,G.S., Gill,S., Harrington,W.F., Pantel,S., Krill-Burger,J.M.
Nucleic Acids Res., 47, W43–W51. et al. (2017) Defining a cancer dependency map. Cell, 170, 564–576.
14. Zhang,B., Tang,C., Yao,Y., Chen,X., Zhou,C., Wei,Z., Xing,F., 33. van der Meer,D., Barthorpe,S., Yang,W., Lightfoot,H., Hall,C.,
Chen,L., Cai,X., Zhang,Z. et al. (2021) The tumor therapy landscape Gilbert,J., Francies,H.E. and Garnett,M.J. (2019) Cell model
of synthetic lethality. Nat. Commun., 12, 1275. Passports-a hub for clinical, genetic and functional datasets of
15. Liu,H., Zhang,W., Zou,B., Wang,J., Deng,Y. and Deng,L. (2020) preclinical cancer models. Nucleic Acids Res., 47, D923–D929.
DrugCombDB: a comprehensive database of drug combinations 34. Visser,U., Abeyruwan,S., Vempati,U., Smith,R.P., Lemmon,V. and
toward the discovery of combinatorial therapy. Nucleic Acids Res., Schürer,S.C. (2011) BioAssay Ontology (BAO): a semantic
48, D871–D881. description of bioassays and high-throughput screening results. BMC
16. Seo,H., Tkachuk,D., Ho,C., Mammoliti,A., Rezaie,A., Madani Bioinformatics, 12, 257.
Tonekaboni,S.A. and Haibe-Kains,B. (2020) SYNERGxDB: an 35. Douglass,E.F., Allaway,R.J., Szalai,B., Wang,W., Tian,T.,
integrative pharmacogenomic portal to identify synergistic drug Fernández-Torras,A., Realubit,R., Karan,C., Zheng,S., Pessia,A.
combinations for precision oncology. Nucleic Acids Res., 48, et al. (2020) A community challenge for pancancer drug mechanism
W494–W501. of action inference from perturbational profile data. biorXiv doi:
17. Shah,K., Ahmed,M. and Kazi,J.U. (2021) The Aurora https://doi.org/10.1101/2020.12.21.423514, 23 December 2020,
kinase/-catenin axis contributes to dexamethasone resistance in preprint: not peer reviewed.
leukemia. NPJ Precis. Oncol., 5, 13. 36. Yadav,B., Wennerberg,K., Aittokallio,T. and Tang,J. (2015)
18. Kim,Y., Zheng,S., Tang,J., Jim Zheng,W., Li,Z. and Jiang,X. (2021) Searching for drug synergy in complex dose-response landscapes
Anticancer drug synergy prediction in understudied tissues using using an interaction potency model. Comput. Struct. Biotechnol. J.,
transfer learning. J. Am. Med. Informatics Assoc. JAMIA, 28, 42–51. 13, 504–513.
19. Manic,G., Musella,M., Corradi,F., Sistigu,A., Vitale,S., Soliman 37. Tang,J., Wennerberg,K. and Aittokallio,T. (2015) What is synergy?
Abdel Rehim,S., Mattiello,L., Malacaria,E., Galassi,C., Signore,M. The Saariselkä agreement revisited. Front. Pharmacol., 6, 181.
et al. (2021) Control of replication stress and mitosis in colorectal 38. Walker,T., Mitchell,C., Park,M.A., Yacoub,A., Graf,M.,
cancer stem cells through the interplay of PARP1, MRE11 and Rahmani,M., Houghton,P.J., Voelkel-Johnson,C., Grant,S. and
RAD51. Cell Death Differ., Dent,P. (2009) Sorafenib and vorinostat kill colon cancer cells by
https://doi.org/10.1038/s41418-020-00733-4. CD95-dependent and -independent mechanisms. Mol. Pharmacol.,
20. Menden,M.P., Wang,D., Mason,M.J., Szalai,B., Bulusu,K.C., 76, 342–355.
Guan,Y., Yu,T., Kang,J., Jeon,M., Wolfinger,R. et al. (2019) 39. Cheng,F., Kovács,I.A. and Barabási,A.L. (2019) Network-based
Community assessment to advance computational prediction of prediction of drug combinations. Nat. Commun., 10, 1197.
cancer drug combinations in a pharmacogenomic screen. Nat. 40. Zhou,Y., Hou,Y., Shen,J., Huang,Y., Martin,W. and Cheng,F. (2020)
Commun., 10, 2674. Network-based drug repurposing for novel coronavirus
21. Ansbro,M.R., Itkin,Z., Chen,L., Zahoranszky-Kohalmi,G., 2019-nCoV/SARS-CoV-2. Cell Discov., 6, 14.
Amaratunga,C., Miotto,O., Peryea,T., Hobbs,C.V., Suon,S., Sá,J.M. 41. Tang,J., Gautam,P., Gupta,A., He,L., Timonen,S., Akimov,Y.,
et al. (2020) Modulation of triple artemisinin-based combination Wang,W., Szwajda,A., Jaiswal,A., Turei,D. et al. (2019) Network
therapy pharmacodynamics by plasmodium falciparum genotype. pharmacology modeling identifies synergistic Aurora B and ZAK
ACS Pharmacol. Transl. Sci., 3, 1144–1157. interaction in triple-negative breast cancer. NPJ Syst. Biol. Applic., 5,
22. Bobrowski,T., Chen,L., Eastman,R.T., Itkin,Z., Shinn,P., Chen,C., 20.
Guo,H., Zheng,W., Michael,S., Simeonov,A. et al. (2021) Synergistic 42. Liu,Q. and Xie,L. (2021) TranSynergy: mechanism-driven
and Antagonistic Drug Combinations against SARS-CoV-2. Mol. interpretable deep neural network for the synergistic prediction and
Ther., 29, 873–885. pathway deconvolution of drug combinations. PLoS Comput. Biol.,
23. Bairoch,A. (2018) The cellosaurus, a cell-line knowledge resource. J. 17, e1008653.
Biomol. Tech., 29, 25–38. 43. O’Neil,J., Benita,Y., Feldman,I., Chenard,M., Roberts,B., Liu,Y.,
24. Kim,S., Chen,J., Cheng,T., Gindulyte,A., He,J., He,S., Li,Q., Li,J., Kral,A., Lejnine,S., Loboda,A. et al. (2016) An unbiased
Shoemaker,B.A., Thiessen,P.A., Yu,B. et al. (2021) PubChem in 2021: oncology compound screen to identify novel combination strategies.
new data content and improved web interfaces. Nucleic Acids Res., Mol. Cancer Ther., 15, 1155–1162.
49, D1388–D1395. 44. Hancock,J.T. and Khoshgoftaar,T.M. (2020) CatBoost for big data:
25. Mendez,D., Gaulton,A., Bento,A.P., Chambers,J., De Veij,M., an interdisciplinary review. J. Big Data, 7, 94.
Félix,E., Magariños,M.P., Mosquera,J.F., Mutowo,P., Nowotka,M. 45. Preuer,K., Lewis,R.P.I., Hochreiter,S., Bender,A., Bulusu,K.C. and
et al. (2019) ChEMBL: towards direct deposition of bioassay data. Klambauer,G. (2018) DeepSynergy: predicting anti-cancer drug
Nucleic Acids Res., 47, D930–D940. synergy with Deep Learning. Bioinformatics, 34, 1538–1546.W184 Nucleic Acids Research, 2021, Vol. 49, Web Server issue
46. Ling,A. and Huang,R.S. (2020) Computationally predicting clinical 49. Eduati,F., Utharala,R., Madhavan,D., Neumann,U.P., Longerich,T.,
drug combination efficacy with cancer cell line screens and Cramer,T., Saez-Rodriguez,J. and Merten,C.A. (2018) A
independent drug action. Nat. Commun., 11, 5848. microfluidics platform for combinatorial drug screening on cancer
47. Julkunen,H., Cichonska,A., Gautam,P., Szedmak,S., Douat,J., biopsies. Nat. Commun., 9, 2434.
Pahikkala,T., Aittokallio,T. and Rousu,J. (2020) Leveraging 50. Du,Y., Li,X., Niu,Q., Mo,X., Qui,M., Ma,T., Kuo,C.J. and Fu,H.
multi-way interactions for systematic prediction of pre-clinical drug (2020) Development of a miniaturized 3D organoid culture platform
combination effects. Nat. Commun., 11, 6136. for ultra-high-throughput screening. J. Mol. Cell Biol., 12, 630–643.
48. Haverty,P.M., Lin,E., Tan,J., Yu,Y., Lam,B., Lianoglou,S., 51. Gao,H., Korn,J.M., Ferretti,S., Monahan,J.E., Wang,Y., Singh,M.,
Neve,R.M., Martin,S., Settleman,J., Yauch,R.L. et al. (2016) Zhang,C., Schnell,C., Yang,G., Zhang,Y. et al. (2015)
Reproducible pharmacogenomic profiling of cancer cell line panels. High-throughput screening using patient-derived tumor xenografts to
Nature, 533, 333–337. predict clinical trial drug response. Nat. Med., 21, 1318–1325.
Downloaded from https://academic.oup.com/nar/article/49/W1/W174/6290546 by guest on 17 December 2021You can also read