Effect of COVID 19 lockdown on regional pollution in Ireland
←
→
Page content transcription
If your browser does not render page correctly, please read the page content below
Air Quality, Atmosphere & Health
https://doi.org/10.1007/s11869-021-01098-4
Effect of COVID‑19 lockdown on regional pollution in Ireland
Teresa K. Spohn1 · Damien Martin1 · Michael Geever1 · Colin O’Dowd1
Received: 27 April 2021 / Accepted: 13 September 2021
© The Author(s) 2021
Abstract
This study examines the regional impact of the COVID-19 lockdown restrictions on pollution in Ireland by comparing the
2020 measurements of ozone (O3), nitrogen dioxide (NO2), and particulate matter (PM) from monitoring stations around
the country to the previous 3-year average. Results indicate that O3 was 5.6% lower and 13.7% higher than previous years
during the lockdown at rural and suburban sites, respectively. NO2 decreased by 50.7% in urban areas, but increased slightly
in agricultural regions, consistent with satellite observations. PM concentrations did not change significantly compared to
previous years; however, a reduction in the signal variability in the smaller size particle measurements may be the result of
different emission sources. The reduction in NO2 likely increased the ratio of volatile organic compounds (VOCs) to NOx
(nitrogen oxides), creating a N
Ox limited environment, which resulted in an initial increase in O
3 in suburban areas, and the
lower than usual levels observed at rural sites. Meteorology showed higher than average wind speeds prior to lockdown,
which likely acted to disperse PM and NO2.
Keywords COVID-19 restrictions · Regional pollution · Ireland
Introduction coastal stations Mace Head, Malin Head, and Carnsore
Point which form the newly established national Atmos-
With the COVID-19 pandemic currently affecting the entire pheric Composition and Climate Change ( AC3) network, in
world, it has been observed in other places such as China, conjunction with available O 3, PM10, and N O2 data (down-
Italy, and the USA that pollution levels have dropped signifi- loaded from the European Environmental Agency website
cantly as a result of less traffic and industry ([Fan et al. 2021; [EEA 2020b]) from sixteen other sites across the country
Altuwayjiri et al. 2021; Goldberg et al. 2020]). Already the operated by the Irish Environmental Protection Agency will
Irish EPA has reported a 50% reduction in nitrogen dioxide be analysed and compared to other studies. This includes
(NO2), which is the primary pollutant emitted by road traf- five urban, nine suburban, and five rural stations.
fic, for Dublin after lockdown restrictions were put in place Meteorology can have a significant impact on N O2, PM,
according to a recent press release [EPA-Ireland 2020]. and O3, as high wind speeds disperse concentrations, pre-
While these changes are most visible in cities and highly cipitation washes out particles, and solar radiation, tempera-
industrial areas, as shown for example by Collivignarelli ture, and humidity influence the chemical production cycle
et al. (2021), who demonstrated that despite the lockdown of O3 from N O2. A recent study by Ordóñez et al. (2020)
restrictions large cities still exceeded NO2 limits, this paper showed that higher than average temperatures and solar radi-
will examine if changes on a regional scale are detectable ation led to increased levels of O3 across central Europe in
in Ireland. In addition to NO2, particulate matter (PM) and 2020, despite varying degrees and time periods of lockdown
ozone (O3) are investigated, as these both are related to N O2 restrictions. Due to a lack of relevant meteorological data at
emissions. In order to do this, measurements from the three the locations chosen, in order to account for meteorology
and seasonal cycles, the average of three previous years of
data will be used to assess changes.
* Teresa K. Spohn After the World Health Organization (WHO) declared the
t.spohn2@nuigalway.ie COVID-19 virus a global pandemic in early March 2020,
1
Centre for Climate and Air Pollution Studies (C‑CAPS),
most countries, including Ireland, began to enforce varying
School of Physics, National University of Ireland Galway, degrees of lockdown restrictions. Ireland’s response was first
University Road, Galway, Ireland
13
Vol.:(0123456789)
Air Quality, Atmosphere & Health
to close all schools and bars as of 16 March. Beginning on solenoid valve and are exposed to ultraviolet light at 254 nm,
28 March, a full lockdown came into effect with all non- and the Beer Lambert Law is applied to calculate the ozone
essential businesses closed, and people working from home concentration from the reference and sample gases [Thermo-
and limiting their movement to within 2 km of their homes Fisher-Scientific 2020].
wherever possible. This lasted until 19 May, when lighter Nitrogen dioxide concentrations were obtained indirectly
restrictions allowed for certain businesses and restaurants from chemiluminescent NOx (nitric oxide + nitrogen diox-
to reopen, as well as a wider range allowed for travel. The ide) monitors. This is done by photometrically measuring
changes resulting from the sharp decrease in traffic during the light intensity at wavelengths greater than 600 nm which
the hard lockdown period will be examined here. occurs when nitric oxide (NO) and ozone react. The process
involves first converting the NO2 from one part of the sam-
ple to NO, representing the total N Ox, and comparing it to
Material and methods another sample which has been allowed to react with ozone.
The difference between the two samples is equivalent to the
Stations and instrumentation NO2 concentration [EPA-US 2002].
A Palas Fidas instrument was used for measuring par-
The stations, their locations, classifications, and measured ticulate matter at the stations. It is an aerosol spectrometer
species for this study are listed in Table 1. Although some capable of simultaneously distinguishing between PM1,
of these stations measure other species as well, only datasets PM2.5, PM4, and PM10 sized particles at a very high time
where sufficient data were available were used. The classi- resolution and, as the only instrument capable of this, is cur-
fications denote distance from sources, mainly traffic, with rently the European standard for fine dust monitoring. The
urban sites being in closest proximity to heavy traffic, and instrument works by measuring the number of scattered light
rural sites being at least 10 km distant. The corresponding impulses produced as particles pass through an optically dif-
map in Fig. 1 provides a visual interpretation of the site ferentiated measurement volume illuminated by white light,
locations, showing the majority of stations within the Dublin and converts them to a mass by multiplying by a correlation
area. factor corresponding to different sources of environmental
Ozone measurements were conducted using Thermo aerosol and applying a separation curve for size distribution
Fisher Scientific O3 Analysers. These work by drawing the [Palas 2019].
air into two sample chambers, one of which is scrubbed of Meteorological measurements were not available for all
ozone and acts as the reference gas, and the other which locations, so data from the nearest Met Eireann stations
becomes the sample gas. These alternately flow through a (Ballyhaise, Co. Cavan; Cork Airport, Co. Cork; Dublin
Table 1 Stations used in this Station Lat/Long Class O3 NO2 PM10
study
Cork City 51° 54′ 39.60″ N, 8° 28′ 30.00″ W Urban X X X
Finglas (Dublin) 53° 23′ 25.08″ N, 6° 18′ 18.72″ W Urban X X
Rathmines (Dublin) 53° 19′ 14.40″ N, 6° 16′ 40.80″ W Urban X X
Ringsend (Dublin) 53° 20′ 30.48″ N, 6° 13′ 35.40″ W Urban X
Woodquay (Dublin) 53° 20′ 52.44″ N, 6° 14′ 37.68″ W Urban X
Ballyfermot 53° 20′ 24.72″ N, 6° 21′ 6.12″ W Suburban X X
Bray 53° 11′ 13.20″ N, 6° 7′ 19.20″ W Suburban X
Clonskeagh (Dublin) 53° 18′ 43.20″ N, 6° 14′ 6.00″ W Suburban X
Cork Bishopstown 51° 53′ 2.40″ N, 8° 31′ 58.80″ W Suburban X X
Dun Laoghaire (Dublin) 53° 17′ 9.60″ N, 6° 7′ 55.20″ W Suburban X
Kilkenny 52° 38′ 20.40″ N, 7° 16′ 4.80″ W Suburban X X
Laois 53° 2′ 9.60″ N, 7° 17′ 20.40″ W Suburban X X
Phoenix Park (Dublin) 53° 21′ 52.56″ N, 6° 20′ 53.16″ W Suburban X
Swords (Dublin) 53° 27′ 47.16″ N, 6° 13′ 19.92″ W Suburban X
Carnsore Point 52° 10′ 14.16″ N, 6° 21′ 20.16″ W Rural X
Mace Head 53° 19′ 28.92″ N, 9° 54′ 11.88″ W Rural X
Malin Head 55° 22′ 55.20″ N, 7° 22′ 24.24″ W Rural X X
Monaghan 54° 3′ 57.60″ N, 6° 52′ 58.80″ W Rural X X
Valentia 51° 56′ 16.80″ N, 10° 14′ 27.60″ W Rural X
13
Air Quality, Atmosphere & Health
Fig. 1 Irish EPA stations (yellow pins) AC3 Network (red pins), image courtesy of Google Maps
Airport, Co. Dublin; Johnstown Castle, Co. Wexford; Mace Observations
Head, Co. Galway; Malin Head, Co. Donegal; and Oak Park,
Co. Wicklow) covering the time period 2017–2020 for the Nitrogen dioxide
months of January through May were evaluated. Solar data
were limited to those from Dublin and Cork airports. Nitrogen dioxide (NO2) is primarily emitted by vehicles,
and therefore a key indicator of traffic-related changes in
pollution. It is measured at five of the sites that also meas-
Methodology ure ozone, only one of which is rural. The comparison with
ozone in Fig. 2 shows that the rural site (Monaghan) has sig-
The method of data analysis employed was based on a nificantly lower N O2 levels than the other stations, although
recent study conducted in the United Kingdom by Lee et al. its ozone levels are about the same as the others. Monaghan
(2020), in which the combined previous 5 years’ average of differed from the other rural sites in that it experienced a
the measurements was compared to 2020 before and after 1.88% increase in ozone during the lockdown period. The
lockdown. However, as most sites in Ireland did not have reduction in NO2 as a result of lockdown is clearly visible
data going back to 2015, only the average of the previous in Fig. 5, especially in the urban area of Rathmines, which
3 years was used. Similar to the UK study, the Irish sites likely experienced the greatest decrease in vehicle emissions.
were classified into urban, suburban, and rural in order to There are five Dublin sites measuring N O2 (but not O 3),
observe how these different environments were affected. which were included here for comparison. Dun Laoghaire
While the UK study focused on nitrogen dioxide (NO2) and and Swords are background suburban sites, whereas Dublin
ozone (O3), this study includes measurements of particu- Ringsend, Woodquay, and Finglas are categorized as urban
late matter (PM) as well. For the purpose of this study, the traffic. As Fig. 3 shows, all stations had lower levels of N
O2
pre-lockdown period will be considered January and Feb- in 2020 than in previous years; however, the difference
ruary, and lockdown will focus on the hard lockdown from increased everywhere except Kilkenny during the lockdown
28 March to 19 May. In the case of ozone, the most visible period. The heaviest traffic area of Dublin Woodquay is asso-
changes occurred in May, and therefore only this month is ciated with the largest decrease (60.6%) compared to the
used in comparing to the pre-lockdown period. previous years’ average during the lockdown period, and the
13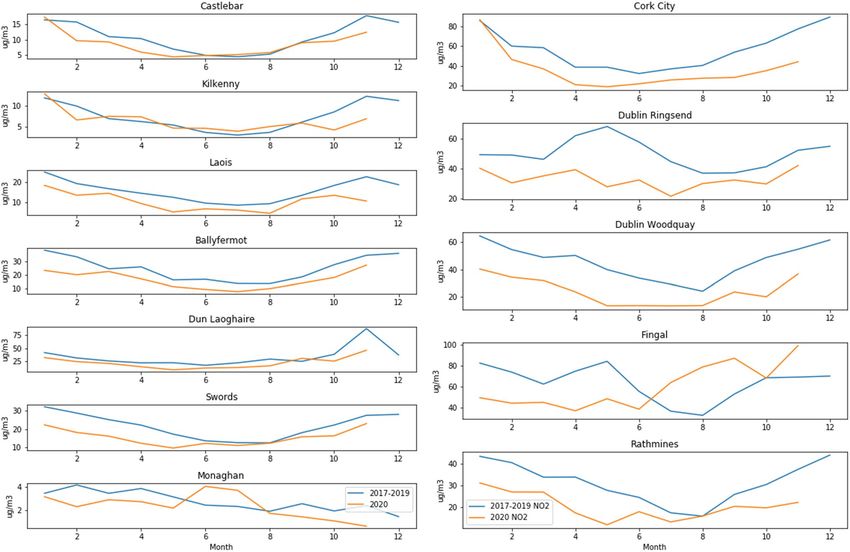
Air Quality, Atmosphere & Health Fig. 2 NO2 and ozone daily averages comparison Fig. 3 Percent change in NO2 between 2020 and the average 2017–2019 13
Air Quality, Atmosphere & Health
average decrease over all Dublin sites was 50.7%, consistent visible upward or downward trend in previous years, and this
with the EPA’s report [EPA-Ireland 2020]. NO2 concentra- holds true for all sites. The plots in Fig. 5 reflect this as well,
tion depends on emissions, chemistry, and meteorology, and with Kilkenny being the only station to show a net increase
the largest source of emissions, traffic, had not changed com- in NO2 during the lockdown. The reason for Kilkenny exhib-
pared to previous years before lockdown, meaning that the iting a different pattern than the other stations is likely local
reduction is likely due to changes in meteorology, which will or regional influences such as agricultural activity.
be looked at in more detail later. The boxplots in Fig. 4 for Satellite images from NASA’s Aura/OMI [NASA 2020]
Dublin Woodquay and Kilkenny indicate that there was no during the lockdown period between 28 March and 19 May
Fig. 4 NO2 boxplots for Dublin Woodquay and Kilkenny
Fig. 5 Suburban background plus rural Monaghan (left) and urban (right) NO2 comparison 2020 to average of 2017–2019
13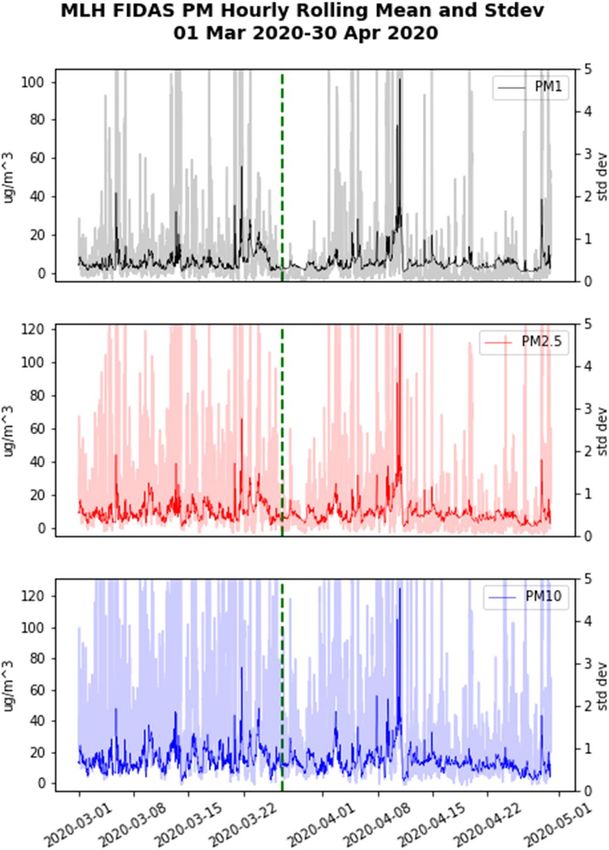
Air Quality, Atmosphere & Health
2020 also show reductions in N O2 compared to previous reduction in these pollutants. It is being measured at the
years of about 27% (± 13% over the time period) overall rural sites Mace Head, Malin Head, Carnsore Point, Valen-
in Dublin This is less than the average decrease in N O2 of tia, and Monaghan, as well as suburban background sites of
50.7% (± 6.2% of the site averages) measured in situ across Bray, Castlebar, Cork Bishopstown, Kilkenny, Laois, and
all the Dublin sites, likely due to the satellite comparison Clonskeagh (Dublin). Cork City and Rathmines (Dublin)
covering a larger time scale for previous years (2015–2019), are classed as urban traffic sites.
and comparison of a point measurement to a spatial foot- Looking at the differences between 2020 ozone concen-
print. The satellite analysis is focused on Dublin; however, trations and the previous 3-year average, some interesting
the maps do show the entire country. Here it is noteworthy patterns emerge. As shown Fig. 6, areas considered suburban
that areas such as Kilkenny seem to have slightly higher than background experienced a slight increase in ozone occurs
usual NO2 concentrations, which is consistent with in situ during lockdown in May, on average 13.7%, whereas in rural
measurements from that station. According to Duffy et al. areas there is an average 5.6% decrease in ozone during the
(2020), transport made up 40.6% of the national total N Ox same time period. The two urban traffic sites in Cork City
in Ireland, but agriculture accounted for 32.4% of NOx emis- and Rathmines (Dublin) showed no clear pattern relating to
sions. As Kilkenny is located in a largely agricultural part of lockdown. By comparison, ozone was slightly higher than
Ireland, it is likely that the 4% increase in NO2 compared to previous years in February (before lockdown), an average
previous years is related to that. of 7.46% across all sites (Fig. 7). The boxplots in Fig. 8
illustrate typical examples of rural and suburban sites and
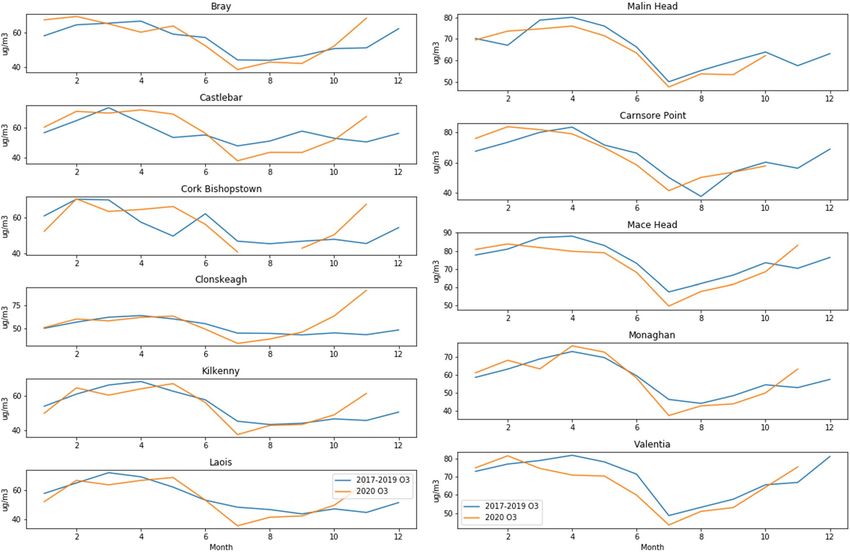
Ozone show that there is no obvious upward or downward trend in
ozone over the years.
Ozone is a harmful secondary pollutant formed by photoly- It is noteworthy that at both suburban background and
sis of vehicular emissions of nitric oxide (NO) and nitro- rural sites, the average monthly ozone is lower than the pre-
gen dioxide (NO2), collectively known as NOx, and volatile vious years’ average for the entire period after lockdown,
organic compounds (VOCs), and so may be affected by a with sharp increases toward the beginning of October when
Fig. 6 Suburban background (left) and rural ozone (right)
13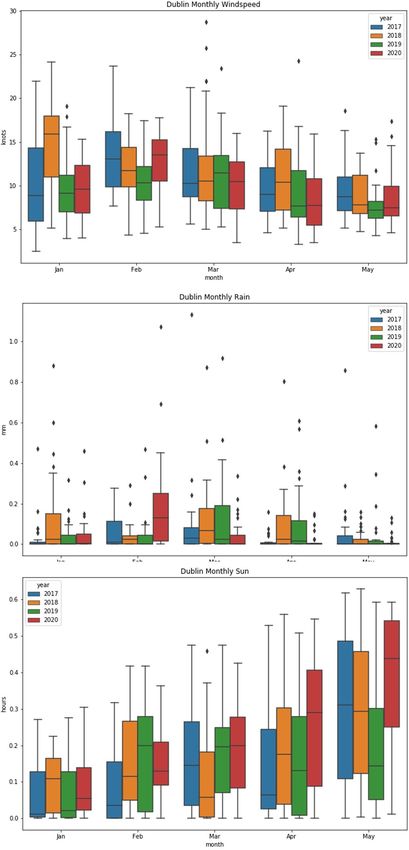
Air Quality, Atmosphere & Health
Fig. 7 Percent change in ozone
between 2020 and average of
2017–2019
Fig. 8 Comparison of rural (Mace Head) and suburban (Clonskeagh) ozone
another lockdown came into effect. Plotting the ozone per- traffic. Especially the amount of ozone titration through NO
cent change by latitude showed no obvious relationship and would have an effect if the NOx concentrations are reduced.
is therefore not shown here. While meteorology plays an This could explain why in high traffic areas (which still
important role in ozone formation, the main factor influenc- experience higher volumes of traffic than suburban areas,
ing whether or not ozone increased or decreased at a par- even during lockdown), fresh NO emissions help to remove
ticular site appears in this case to be its proximity to traffic, ozone, whereas suburban sites no longer have sufficiently
and hence NOx emissions. high concentrations of NO. A recent study [Sicard et al.
One possible reason for the sudden increase in ozone in 2020] showed that the weekend effect could actually have
the suburban areas could be what has become known as the been amplified by the lockdown measures in certain large
“weekend effect”, described by Atkinson-Palombo et al. cities.
(2006) and references therein. This, as the name suggests, As ozone formation in rural areas is more dependent on
mainly occurs on weekends in suburban areas, when ozone VOC concentrations than on NOx, the reduction in ozone is
increases as a result of fewer NOx emissions, and possibly more difficult to explain. As discussed by Kroll et al. (2020),
more sunlight from lower BC and PM levels, associated with there is a complex and non-linear chemistry involved, which
13
Air Quality, Atmosphere & Health
depends on the types of VOCs and their ratio to N Ox, that made up of sea salt, whereas Dublin would have more traf-
determines whether ozone or secondary organic aerosol fic and industry-related PM, but other factors such as an
(SOA) is formed. Without more detailed measurements increase in home heating and decrease in road traffic due
of VOCs, it is impossible to determine if the amount was to lockdown could have resulted in similar levels of PM
reduced or increased due to anthropogenic emissions (less from different sources than usual.
traffic, more cleaning agents), or if this affected the ratio to As the Malin Head Fidas instrument has the ability to
NOx in such a way that SOA formation increased. measure different PM size categories simultaneously, these
data were further evaluated, and showed there were some
Particulate matter clear changes after the lockdown comes into effect in Ire-
land. The time series in Fig. 10 shows a distinct reduction
Although most of the sites do have some available PM10 in the signal variability of PM1 and PM2.5 after lockdown
measurements, only seven of them had consistent enough begins (the average standard deviation for PM1 before lock-
data sets to complete this analysis. These were Dublin down was 1.00 and after lockdown 0.36, for PM2.5 before
Ringsend, Rathmines, Ballyfermot, Phoenix Park, Cork lockdown 1.60 and after lockdown 0.57), which could be
City, and Castlebar. Only four sites measure PM2.5, all related to less local traffic that would otherwise produce BC
Fig. 9 Boxplot of PM10 at suburban site Phoenix Park (Dublin)
of them urban traffic apart from Malin Head, yet due to
insufficient data an analysis could not be conducted. When
comparing the 2020 PM10 measurements from the sta-
tions to the average of 2017–2019, PM10 did not change
considerably before or during lockdown, and there was
no consistent pattern in the percent change. This is likely
due to the complex nature of PM, which has many sources
and varied composition. The boxplots in Fig. 9 show only
April 2019 being anomalously high compared to other
years, which is reflected across all sites. As shown in a
presentation by Coleman et al. (2020), wind speeds in
the months of January and February were higher than the Fig. 10 MLH Fidas PM hourly rolling time series on left axis with
standard deviation in lighter colour on right axis (green dashed line
2016–2019 average for those months, and may have caused
denotes beginning of lockdown in Ireland)
dispersion of PM leading to lower concentrations in most
areas, whereas there was less precipitation in the months
after lockdown began which could mean fewer particles
were washed out. Castlebar on the west coast of Ireland and road dust in the area. PM10 by comparison seems rela-
may have experienced increased sea salt as a result of the tively unchanged with an average standard deviation of 1.05
higher wind speeds. The composition of aerosols will vary before and 1.08 after lockdown, and with Malin Head being
by season and type of site, i.e. Malin Head PM10 is largely
13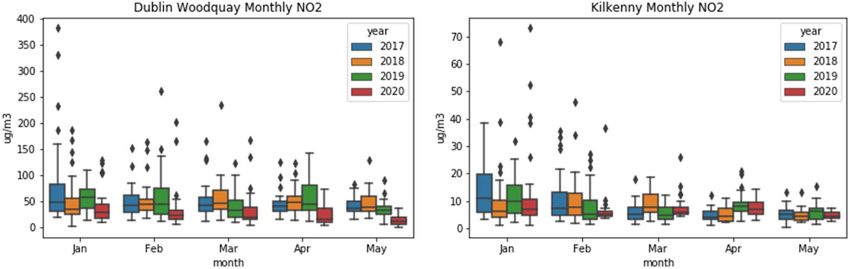
Air Quality, Atmosphere & Health
Fig. 11 Dublin airport wind roses, scale is 0–30 knots for speed, colours represent frequency and occurrence
a coastal station, the sea salt component of these coarse par- roses also show a slight shift in wind direction to the south-
ticles would not be expected to change. west in January and February, which may have had the effect
of bringing more Atlantic background air to Dublin than
Meteorology continental air from the south (Fig. 11). Higher wind speed
would lead to greater dispersion, not only of PM, but also
Meteorology can affect all of the above species, so this was NO2, and could be a factor in the lower N O2 concentrations
evaluated compared to previous years as well, using data before lockdown.
available online from Met Eireann (the Irish meteorology The recent study by Ordóñez et al. (2020) evaluated the
service at https://www.met.ie) from the stations nearest the impact of meteorology on ozone production across Europe
monitoring sites. As most of these sites are within Dublin, by modelling the expected concentrations during lockdown
the main focus was on the Dublin airport data, which also based on climatological data from 1981 to 2010. In this way,
provided information about hourly sun. they were able to quantify how much of the change in ozone
The most noteworthy changes in 2020 were the afore- could be attributed to various factors such as temperature,
mentioned windspeed and precipitation, although the wind solar radiation, humidity, wind speed, and precipitation.
13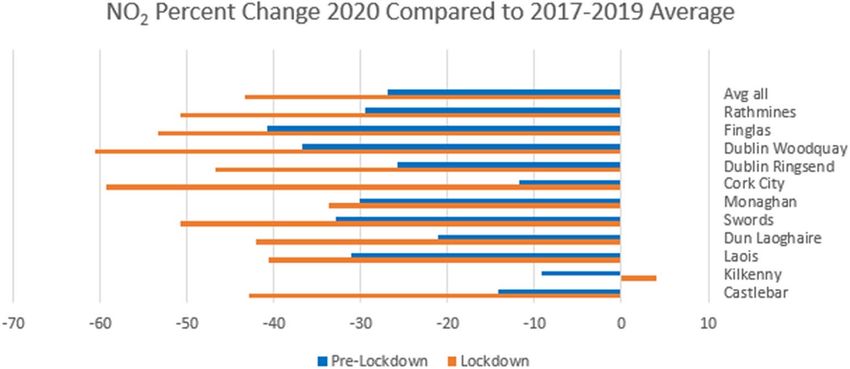
Air Quality, Atmosphere & Health
Although these often act in combination, i.e. higher tem- Analysis
peratures are often the result of increased solar radiation and
less precipitation, it was possible to isolate the main cause Comparison to literature
of the changes in ozone, which varied by region.
As the study by Ordóñez et al. (2020) showed, the great- To put all of these results into perspective, it is informative
est influence on ozone production during lockdown in cen- to look at related measurements and studies. While a pleth-
tral Europe was solar radiation. In Dublin, solar radiation ora of new literature showing reduced emissions in various
remained similar to previous years before lockdown, but parts of the world has emerged in the wake of the pandemic,
was somewhat higher in April and May of 2020, which here the focus will be on two articles which are most relevant
could affect ozone chemistry (Fig. 12). The maps for the to the observations in Ireland.
March–April timeframe in the Ordonez study also seem to A recent study by Lee et al. (2020) examined in situ
show this across the entire country, showing standardised measurements at over 150 monitoring stations across the
anomolies in 2020 of a 0.1–0.5 increase compared to the UK. Using the same methodology applied here of compar-
same period in 1981–2010, but still lower than other parts ing 2020 values to previous years, they were able to show
of Europe, for example Germany, where this increase was an average 11% rise in ozone in urban background areas of
greater than 1.0 . the UK after lockdown came into effect. They also found a
More sunlight (and less precipitation) may also lead to slight increasing trend in ozone over multiple years. Solar
higher temperatures, and as Ordonez et al. (2020) note, the radiation plays a major role in ozone formation, and the UK
main factor influencing the UK’s ozone production during study demonstrated that the southern regions which had
lockdown appears to be higher than usual temperature, lead- more sunlight and warmer temperatures during this period
ing to an observed increase in ozone of 12.3 ± 13.9 percent experienced greater increases in ozone compared to Scotland
in urban areas, and 3.1 ± 6.7 percent in rural areas compared and Northern Ireland.
to 2015–2019, vs. the climatological model which predicts The increase in ozone in the suburban background sites of
only a 4.7 ± 11.4 percent increase in urban, and actually a 13.7% in Ireland agrees well with the UK study by Lee et al.
1.2 ± 5.5 percent decrease in rural areas. Indeed, their maps 2020; however, no upward trend could be discerned over
show a standardised anomaly of a 1.0–1.5 increase compared time, with the more rural stations actually trending slightly
to previous years over the south and central part of England, downward. There was also no correlation between latitude
with a south to north decreasing temperature gradient. This and ozone concentration. These differences are likely due
is similar to that found by Lee et al. (2020) where London, to fewer stations in Ireland with a shorter timeframe of
Bristol, and Cardiff experienced an average increase of 2C measurements.
compared to previous years, whereas Glasgow and Belfast Menut et al. (2020) performed a modelling study com-
did not exhibit significant changes in temperature. The pat- paring “business as usual” emissions to estimated reduced
tern is likely the result of less daylight with increasing lati- emissions based on how many fewer vehicles were on the
tudes at that time of year. road, and calculated that for Ireland this would result in a
Looking at Ireland, the standardised anomaly of the tem- 2.7% reduction in ozone in urban areas, and a 2.34% reduc-
perature difference shown on the maps by Ordóñez et al. tion in ozone in rural areas. They also predicted a 37.3% and
(2020) is at most 0.5, and therefore, the impact on ozone 29.5% decrease in NO2 in urban and rural areas, respectively.
production is probably less than in the UK. Temperature PM2.5 was expected to be 11.1% (urban) and 11.7% (rural)
data from seven Met Eireann stations across Ireland showed lower in Ireland.
that all except Malin Head (the northern-most station) expe- Comparing the results from that study to the observations
rienced a statistically significant increase in 2020 compared in Ireland, the average rural decrease of 5.6% in ozone is
to 2017–2019, between 0.48C in Dublin and 1.16C in Oak slightly higher than predicted for Ireland by Menut et al., yet
Park (nearest station to Kilkenny), but only in April. The close enough to be within the margin of error. While there
increases in ozone concentration in suburban areas occurred was a short-term increase in suburban background ozone
in May, and might be more related to traffic emissions, as in May after the lockdown began, for the most part ozone
other studies [Pusede and Cohen 2012] have shown that did decrease in Ireland both in rural and suburban areas
these tend to have a greater impact on ozone in cities than compared to previous years, though the percentage varies
meteorology. In Kilkenny, the increased temperature could depending on the site’s proximity to traffic. The NO2 predic-
have played a role in the VOC and N Ox chemistry associated tions of the reduced emission modelling scenario match very
with both agricultural and seasonal emissions, and thereby closely with the observations for both rural and urban envi-
led to an increase in NO2 in that region. While it is likely ronments; however, the PM2.5 did not reduce as predicted,
that meteorology did impact ozone production in Ireland, it indicating some other source of PM not related to traffic.
is not possible to quantify how much with the data available.
13Air Quality, Atmosphere & Health
Fig. 12 Dublin airport meteor-
ology
13Air Quality, Atmosphere & Health
Comparison to emission inventory agriculture and industry, covering rural areas of the coun-
try, with increases in urban areas related to road use and
While NO2 was greatly reduced in most places as a result of solvents. Comparing the colour scales for these maps shows
less vehicular traffic during lockdown, O3 appears to have that VOCs are considerably higher than NOx, even in urban
remained fairly constant before and after lockdown, as the areas. Although these are only estimates, and the inventory
daily averages show it to be well within the range of northern is from 2015, this gives the impression that Ireland, with
hemisphere background concentrations reported by Vingar- the exception of some very highly trafficked areas, is NOx
zan (2004) of 20–45 ppb at all stations, even accounting for limited, and would explain why the model study by Menut
the springtime high. Apart from a brief increase in suburban et al. 2020 predicted a decrease in ozone for urban areas.
areas compared to previous years from a possible “weekend The European Environmental Agency (EEA) has created
effect” after lockdown, O 3 was generally lower in 2020 than a tracker system online [EEA 2020a] where the levels of
before. Ozone concentration depends on a number of fac- PM2.5 and PM10 can be observed on a weekly and monthly
tors, with both natural and anthropogenic sources. Its longer basis by country and city. On this website, they note that
lifetime of about 20 days in the troposphere allows it to be PM2.5 has not visibly reduced across much of Europe, due
transported over long distances, which is why there is a fairly to its more varied sources, including agricultural ammo-
constant background level. nia, which would not have been reduced due to COVID-
The production and loss of ozone depends mainly on 19 restrictions. Home heating had also not significantly
meteorology and the ratio of VOC/NOx. This relationship declined during this period, according to the Irish EPA,
is often depicted in the form of an ozone isopleth diagram, likely due to people spending more time in their homes. As
as explained by Division on Earth and Life et al. (2000), the most recent Informative Inventory Report for Ireland
with NOx on the y-axis and VOCs on the x-axis, and lines of [Duffy et al., 2020] shows, transport made up only 8.7%
constant value of ozone (isopleths) plotted as the maximum of the total PM10 in 2018, and 13.8% of PM2.5, making it
resulting from the different combinations of NOx and VOCs. unlikely that a reduction in traffic would have a significant
A diagonal line from the origin at bottom left to top right impact on these measurements.
on these charts is representative of the 8:1 ratio of VOC/ Indeed, the Irish measurements of PM10 and PM2.5 do
NOx, and anything to the right of this line is considered NOx not appear to be greatly impacted by the lockdown. The per-
limited (characteristic of rural or suburban areas, where a cent increase/decrease was within a margin of error both at
reduction in N Ox results in lower ozone), whereas to the rural and urban sites. Even so, small changes were observed
left is VOC limited (in highly polluted inner cities, where in in PM1 at the rural sites. These could be related to other
order to reduce ozone, VOCs must be reduced). Due to the sources, i.e. what would normally have been traffic related
curvature of the isopleths, it is possible in a VOC-limited might now be the result of increased home heating. The
environment for ozone to actually increase when NOx is composition of PM is also very site dependent, as the coastal
lowered, until the ratio crosses to the other side of the ridge sites would be heavily influenced by sea salt.
line which results in reduced ozone. This also is part of the
“weekend effect” in urban areas. Impact of traffic
VOCs are a broad category of chemical compounds,
many of which come from natural sources such as trees. The Traffic Infrastructure Ireland (TII) website [TII 2020]
Without measurements of these compounds, it is impossi- tracks the number and type of vehicles for thousands of loca-
ble to know how the concentrations and composition have tions across Ireland. When comparing various sites before
changed, thus affecting the VOC/NOx ratio. The Informative and after lockdown, there is a roughly 50–60% reduction in
Inventory Report for Ireland [Duffy et al. 2020] estimates the daily amount of traffic, mainly related to passenger vehi-
only 4% of total VOCs are related to transport. This is a very cles. For the Dublin site nearest to Rathmines, where previ-
small amount compared to the over 40% of NOx attributed to ously a daily maximum of 900 vehicles were counted, after
transport, and so it is likely that the reduction in N
O2 would lockdown there were around 300 vehicles during the same
result in a higher VOC/NOx ratio after lockdown, creating late afternoon peak between 15:00 and 17:00. A rural area
a more NOx limited environment which would account for such as Monaghan that previously had about 350 vehicles at
the somewhat lower O3 levels in 2020. the peak afternoon traffic went down to 170 during the same
The MapEire.dk [MapEire.dk 2018] website depicts the period after lockdown. The level of N O2 reduction is directly
Irish emissions inventory according to major sources by spe- linked to the amount of traffic, due to its shorter lifetime
cies on a spatial resolution of 1 × 1 km. The maps on this and higher concentrations closer to the source. Other TII
website show N Ox and VOC emissions from 2015 across sites around Dublin are located on very busy motorways,
Ireland. As NOx is heavily associated with transport, roads such as the M50, where there were over 10,000 vehicles/
and urban areas stand out. VOCs are largely associated with hour prior to lockdown, specifically on the section leading
13Air Quality, Atmosphere & Health
to the airport, and traffic was reduced to just over 3000 vehi- on previous versions of the manuscript. All authors read and approved
cles during the same time of day after lockdown. Monaghan the final manuscript.
on the other hand does not appear to be influenced by traf-
Funding Funding was generously provided by the Irish Research
fic emissions, as seen in the time series plot comparing O3 Council as part of scholarship number GOIPG/2015/2555.
and NO2 at the stations. Of all the rural stations, it was the
only one to show a slight (1.88%) net increase in O3 dur- Availability of data and material Data were obtained from publicly
ing lockdown, small enough and within the margin of error available online sources provided by the Irish Environmental Protec-
to be considered no change, and NO2 remained constant tion Agency, in conjunction with measurements made by the National
University of Ireland Galway.
throughout.
Further analysis of the data showed that the Dublin site, Code availability Data processing was conducted using Python and
in addition to experiencing a 60% reduction in passenger Microsoft Excel applications.
vehicles, also had the same decrease in light goods vehi-
cles, buses, and heavy goods vehicles. Monaghan had a 50% Declarations
decrease in passenger vehicles, yet the number of LGVs,
buses, and HGVs did not decrease. As these types of vehi- Conflict of interest The authors declare no competing interests.
cles tend to emit more pollutants, this is a possible reason
that there is no visible change in NO2 levels measured at that Open Access This article is licensed under a Creative Commons Attri-
bution 4.0 International License, which permits use, sharing, adapta-
station after lockdown. tion, distribution and reproduction in any medium or format, as long
as you give appropriate credit to the original author(s) and the source,
provide a link to the Creative Commons licence, and indicate if changes
were made. The images or other third party material in this article are
Conclusions included in the article's Creative Commons licence, unless indicated
otherwise in a credit line to the material. If material is not included in
In summary, the COVID-19 lockdown did have a noticeable the article's Creative Commons licence and your intended use is not
permitted by statutory regulation or exceeds the permitted use, you will
effect on regional pollution levels in Ireland. Ozone at rural need to obtain permission directly from the copyright holder. To view a
sites was on average 5.6% lower compared to the previous copy of this licence, visit http://creativecommons.org/licenses/by/4.0/.
years’ average, whereas it showed a 13.7% increase in sub-
urban areas likely due to the “weekend effect”. These results
agree with other studies which either showed or predicted References
similar changes. Nitrogen dioxide decreased at all stations
relative to previous years, with the highest trafficked site in Altuwayjiri A, Soleimanian E, Moroni S, Palomba P, Borgini A, De
Woodquay (Dublin) associated with the greatest decrease of Marco C, Ruprecht AA, Sioutas C (2021) The impact of stay-
home policies during Coronavirus-19 pandemic on the chemical
50.7%. The only exception was Kilkenny, which is located in and toxicological characteristics of ambient PM2.5 in the metro-
an agricultural part of the country which experienced higher politan area of Milan. Italy. Sci Total Environ 758:143582. https://
than usual temperatures, and the increase in N O2 there is doi.org/10.1016/j.scitotenv.2020.143582
confirmed also by satellite imagery. Particulate matter did Atkinson-Palombo CM, Miller JA, Balling RC (2006) Quantifying the
ozone “weekend effect” at various locations in Phoenix, Arizona.
not appear to change considerably during this time, although Atmos Environ 40(39):7644–7658. https://doi.org/10.1016/j.
it is possible the composition of particles may be different atmosenv.2006.05.023
than usual, as the combustion sources changed from traffic Coleman L, Ovadnevaite J, Ansari T, Ceburnis D, Lin C, Fossum K,
to residential. Roche P, Khatoon A, Yadav P, and O’dowd C (2020) Advanced
measurements and modelling of the impact of reduced emissions
The methods used in this study carry a lot of uncertainty; on air quality in Dublin during Covid-19, edited
however, they do give a good general impression of the Collivignarelli MC, De Rose C, Abbà A, Baldi M, Bertanza G, Pedraz-
impact of lockdown on Ireland. Future work may include a zani R, Sorlini S, Carnevale Miino M (2021) Analysis of lock-
more complex analysis of the data combined with air mass down for CoViD-19 impact on NO2 in London, Milan and Paris:
what lesson can be learnt? Process Saf Environ Prot 146:952–960.
trajectories which more clearly show regional transport, as https://doi.org/10.1016/j.psep.2020.12.029
well as further investigation into the effects of meteorology. Division on Earth and Life, S., E. a. R. Commission on Geosciences,
O. Committee on Tropospheric, and C. National Research (2000)
Rethinking the ozone problem in urban and regional air pollution,
Author contribution All authors contributed to the study conception National Academies Press. https://doi.org/10.17226/1889
and design. Material preparation, data collection, and analysis were Duffy P, Hyde B, Ryan AM, Murphy J, Quirke B, Fahey D, and Kehoe
performed by Teresa Spohn. Review and editing were conducted by A (2020) Informative inventory report Ireland 2020: air pollutant
Damien Martin. Network data were made available by Michael Geever. emissions in Ireland 1990–2018 reported to the secretariat of the
Supervision was provided by Prof. Colin O’Dowd. The first draft of the UNECE convention on long-range transboundary air pollution and
manuscript was written by Teresa Spohn and all authors commented to the European Union Rep., EPA Ireland
13Air Quality, Atmosphere & Health
EEA (2020a) Air quality and Covid-19, edited, p. Weekly and monthly air quality over western Europe. Sci Total Environ 741:140426.
tracker of pollutants, https://www.eea.europa.eu/themes/air/air- https://doi.org/10.1016/j.scitotenv.2020.140426
quality-and-covid19 NASA (2020) Global nitrogen dioxide monitoring homepage, edited,
EEA (2020b) Download of air quality data, edited, https://discomap. https://so2.gsfc.nasa.gov/no2/no2_index.html, Goddard Space
eea.europa.eu/map/fme/AirQualityExport.htm Flight Center
EPA-Ireland (2020) Recent trends in nitrogen dioxide (NO2) levels in Ordóñez C, Garrido-Perez JM, García-Herrera R (2020) Early spring
air (Ireland) edited, https://w ww.e pa.i e/n ewsan deven ts/n ews/p ress near-surface ozone in Europe during the COVID-19 shutdown:
releases2020/name,69166,en.html meteorological effects outweigh emission changes. Sci Total Envi-
EPA-US (2002) Reference method for the determination of nitrogen ron 747:141322. https://doi.org/10.1016/j.scitotenv.2020.141322
dioxide in the atmosphere (Chemiluminescence)Rep. Office of Air Palas (2019) Fidas 200E, edited, p. https://www.palas.de/en/product/
Quality Planning and Standards fidas200e. Palas GmbH, Karlsruhe, Germany
Fan H, Wang Y, Zhao C, Yang Y, Yang X, Sun Y, Jiang S (2021) Pusede SE, Cohen RC (2012) On the observed response of ozone
The role of primary emission and transboundary transport in the to NOx and VOC reactivity reductions in San Joaquin Valley
air quality changes during and after the COVID-19 lockdown in California 1995-present. Atmos Chem Phys 12(18):8323–8339.
China. Geophys Res Lett n/a(n/a):e2020GL091065. https://doi. https://doi.org/10.5194/acp-12-8323-2012
org/10.1029/2020GL091065 Sicard P, De Marco A, Agathokleous E, Feng Z, Xu X, Paoletti E,
Goldberg DL, Anenberg SC, Griffin D, McLinden CA, Lu Z, Streets Rodriguez JJD, Calatayud V (2020) Amplified ozone pollution
DG (2020) Disentangling the impact of the COVID-19 lock- in cities during the COVID-19 lockdown. Sci Total Environ
downs on urban NO2 from natural variability. Geophys Res Lett 735:139542. https://doi.org/10.1016/j.scitotenv.2020.139542
47(17):e2020GL089269-n/a. https://d oi.o rg/1 0.1 029/2 020G Thermo-Fisher-Scientific (2020) Model 49i ozone analyzer, edited,
L089269 p. https://www.thermofisher.com/order/catalog/product/49I#/49I
Kroll JH, Heald CL, Cappa CD, Farmer DK, Fry JL, Murphy JG, TII (2020) TII traffic data site, edited by T. I. Ireland, https://w ww.n ratr
Steiner AL (2020) The complex chemical effects of COVID-19 afficd ata.i e/c 2/g mapba sic.a sp?s gid=Z
vyVmX
U8jBt 9PJE$ c7UXt6
shutdowns on air quality. Nat Chem 12(9):777–779. https://doi. Vingarzan R (2004) A review of surface ozone background levels and
org/10.1038/s41557-020-0535-z trends. Atmos Environ 38(21):3431–3442. https://doi.org/10.
Lee JD, Drysdale WS, Finch DP, Wilde SE, Palmer PI (2020) UK sur- 1016/j.atmosenv.2004.03.030
face NO2 levels dropped by 42% during the COVID-19 lockdown:
impact on surface O3. Atmos Chem Phys Discuss 2020:1–27. Publisher's note Springer Nature remains neutral with regard to
https://doi.org/10.5194/acp-2020-838 jurisdictional claims in published maps and institutional affiliations.
MapEire.dk (2018) Map Eire spatial results, edited by M. S. Ple-
jdrup, https://projects.au.dk/mapeire/spatial-results/. AARHUS
University
Menut L, Bessagnet B, Siour G, Mailler S, Pennel R, Cholakian A
(2020) Impact of lockdown measures to combat Covid-19 on
13You can also read