ENTSOG
SUMMER SUPPLY OUTLOOK

        2022
←
→
Page content transcription
If your browser does not render page correctly, please read the page content below

ENTSOG
SUMMER SUPPLY OUTLOOK
2022
Summer Supply Outlook 2022
                                                                                                                        SO0035-22
                                                                                                                       11/04/2022

Contents

Executive Summary .................................................................................................................... 3
1.     Introduction ........................................................................................................................ 6
2.     Assumptions ........................................................................................................................ 7
       Infrastructure ..................................................................................................................... 7
       Demand .............................................................................................................................. 7
       Supply ................................................................................................................................. 7
       UGS inventory .................................................................................................................... 9
3.     Modelling results .............................................................................................................. 12
     3.1     Baseline Scenario (Reference Case) - 90% storage target..................................................... 12

     3.2     Sensitivity-analysis – Alternative injection targets (80% and 100% targets) ........................ 15

     3.3     Supply dependence assessment ........................................................................................... 18

Legal Notice .............................................................................................................................. 32
Annex A – Underground storages assumptions ....................................................................... 33
Annex B – Supply assumptions................................................................................................. 34
Annex C – Summary of Summer Supply Outlook 2021 assumptions ...................................... 36
Annex D – Data for Summer Supply Outlook 2021 .................................................................. 37
Annex E – Modelling approach ................................................................................................ 38
Annex F – RESULTS INTERPRETATION AND EXTRAPOLATION ................................................. 39
Annex G – List of Figures and Tables ........................................................................................ 41

                                                                Page 2 of 42
Summer Supply Outlook 2022
S00035-22
11/04/2022
Executive Summary
In line with Art.8(3)(f) of Regulation (EC) 715/2009, ENTSOG has undertaken an assessment of
the European gas network for the upcoming summer (1 April 2022 to 30 September 2022).
Reaching a minimum filling level in the European gas storages at the end of the summer
season is essential for ensuring security of supply in winter. Therefore, the analysis
investigates the possible evolution of the gas supply as well as the ability of the gas
infrastructures to meet the demand, the exports and the storage injection needs during
summer 2022. ENTSOG has run a sensitivity analysis to assess different injection targets
ranging from 80% to 100%.
Furthermore, the invasion of Ukraine by Russia has triggered energy security concerns in
Europe. Therefore, ENTSOG additionally assessed the dependence of the EU on the Russian
supply during summer 2022 to satisfy the gas demand as well as to inject in the gas storages.
Summer Supply Outlook main findings
On 1 April 2022, the EU average storage level (26%) is in the range of previous season,
despite the historically low storage level observed at the beginning of the winter
season. This is partially be explained by the mild temperatures observed in Europe last
winter.
Gas injection has already begun in some storages in February (Latvia, Poland).
Baseline scenario
The European gas infrastructure offers sufficient flexibility to enable market
participants to reach at least a 90% stock level in all underground gas storages by the
end of this summer 2022.
The sensitivity analysis shows that a 100% stock level could as well be achieved in all
countries.
Maintenance can be performed to ensure infrastructure reliability in the long-term.
Exports to Ukraine can be ensured, with volumes comparable to previous summer
seasons.
The EU is dependent on Russian gas for a minimum of 20% of its supply.
To minimise the share of Russian gas in the supply mix, the EU can increase LNG
imports up to 80 bcm over the summer season. However, such import volumes are
significantly higher than the average 50 bcm observed in the past years, and even
higher than the 70 bcm observed in the last winter seasons. Furthermore, should more
LNG supply be available on the global market, infrastructure limitations prevent
additional LNG imports.
Page 3 of 42
Summer Supply Outlook 2022
SO0035-22
11/04/2022
Belarus and Ukraine supply route disruption scenario
Europe can only reach 84% of its total storage capacity (working gas volume). Western
European countries (United Kingdom, Belgium, France, Spain and Portugal) can reach
100% of their storage WGV. However, they cannot provide additional gas to the
Eastern-European countries because of limited capacities which are all used at their
maximum (Belgium to Germany, Belgium to the Netherlands and France to
Switzerland).
Some European storages (Germany and Poland) are withdrawing gas to satisfy the
demand at the beginning of summer (April and May).
Russian supply disruption scenario
In case of supply disruption from Russia starting on 1 April, most European countries
cannot reach the target of 80% stock level with a significant difference between
European countries.
o 90% to 100% (ca. 190 TWh) filling level in Western Europe (UK, BE, FR, ES, PT)
o 30% to 60% (175 to 350 TWh) filling level in 3 European countries (NL, DE, IT)
representing 50% of the total European storage capacities (580 TWh out of
1100 TWh)
o 5% to 35% (17 to 150 TWh) filling level in Eastern Europe (LV, PL, CZ, SK, HU,
AT, HR, RS, RO and BG)
The assessment identifies import capacity limitations in Central Eastern Europe as well
as infrastructure limitations in the North-West and in the South of Europe preventing
additional gas to flow to Central-Eastern Europe and therefore limiting a possible
mitigation of the gas storage deficit.
Additionally, Latvia, Estonia and Finland, are exposed to a risk of demand curtailment
in case of full Russian supply disruption; and storage withdrawals are needed to satisfy
the summer demand in Northern and Central Eastern Europe.
Positive impact of anticipated preparedness
o The rapid implementation of additional capacities in Europe can enhance the
cooperation between Member States in Central-Eastern Europe.
o in case of exceptional political decision, the reverse flow from France to
Germany under certain conditions (e.g., acceptability of odourised gas for
storages and industry consumers), can additionally participate to decreasing
the dependence on Russian gas.
Russian supply dependence assessment
Most European countries do not rely on Russian gas in summer to satisfy their demand
but Latvia, Estonia and Finland. However, most countries rely on Russian gas to reach
the 80% or 90% storage level target on 1 October. The assessment identifies import
Page 4 of 42
Summer Supply Outlook 2022
SO0035-22
11/04/2022
capacity limitations in Central Eastern Europe as well as infrastructure limitations in
the North-West and in the South of Europe preventing gas from alternative sources to
flow from Western to Central-Eastern Europe and thus mitigating the dependence on
Russian supply.
Positive impact of short-term preparedness by European TSOs
o The rapid implementation of additional capacities in Europe can enhance the
cooperation between Member States in Central-Eastern Europe.
o in case of exceptional political decision, the reverse flow from France to
Germany under certain conditions (e.g., acceptability of odourised gas for
storages and industry consumers), can additionally participate to decreasing
the dependence on Russian gas.
Imports of alternative supply sources from Turkey to Bulgaria can additionally reduce
the dependence of the Balkan countries on Russian gas.
Important:
ENTSOG Summer Supply Outlook 2022 is an assessment of the readiness of the gas
infrastructure to cope with the upcoming summer season under different scenarios, but this
assessment is not a forecast of the expected gas supply situation. The actual utilisation of the
gas infrastructure, including the development of the gas storage levels, will be determined by
the decisions of the market participants and influenced by external factors such as policy
decisions.
The simulations of the disruption scenarios have been performed on 1 April and are assuming
a supply disruption starting on 1 April. However, at the date of publication of the Summer
Supply Outlook 2022 report, no supply disruption has been observed and the average storage
level in Europe is 31% compared to the 21% resulting from the simulations. Therefore, when
interpreting the results, it should be considered that in case of a supply disruption happening
during the summer period, the storage levels on 1 October are dependent on the storage
levels at the date of the disruption. Hence, on 27 April, it could be expected that a disruption
occurring on 1 May would allow to fill the gas storages up by an additional 10% compared to
what is presented in this report.
Page 5 of 42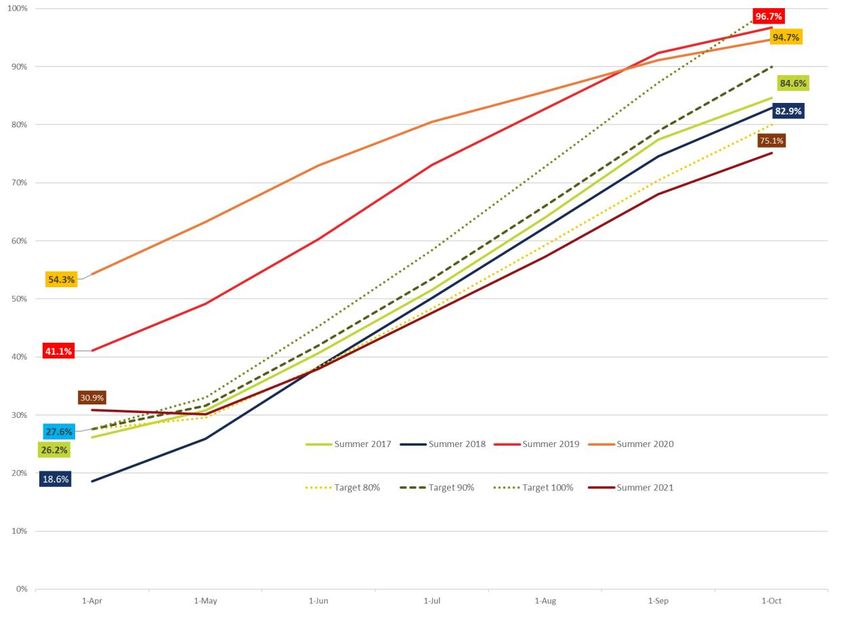
Summer Supply Outlook 2022
                                                                                      SO0035-22
                                                                                     11/04/2022

1. Introduction

This edition builds on previous Summer and Winter Supply Outlooks as well as on the supply
assumptions of the TYNDP. It aims at assessing the ability of the European gas infrastructure
to provide sufficient flexibility to shippers during the storage injection season.

The summer months (from April to September) provide shippers the opportunity to refill
storages in anticipation of the next winter months. The level of injection targeted by shippers
varies from one country to the other and from one season to the other due to climatic, price
and legal parameters.

The Summer Supply Outlook assesses the ability of the European gas infrastructure to provide
sufficient flexibility to inject gas in the underground storages under different scenarios around
a Reference Case (Baseline Scenario) targeting a 90% storage level by 30th September 2022.
Additional sensitivities cover alternative injection targets, in the range of 80% to 100%.

For the first time, given the current exceptional circumstances determined by the invasion of
Ukraine by Russia, the Summer Supply Outlook 2022 assesses the ability of the European gas
network to fill storages in, in case of supply disruption.

The modelling considers as a starting point the actual storage levels as of 1 April 2022.

For an accurate modelling of the storage injection capacities – which vary with the storage
levels - ENTSOG uses injection capacity curves provided by Gas Storage Europe (GSE)
members.

The topology of the network model has been upgraded in order to reflect the firm technical
capacities that are offered for the upcoming summer. However, in the supply disruption
scenario, those capacities may not reflect accurately the situation, as gas flows and pressure
may vary significantly from the usual operational conditions.

                                           Page 6 of 42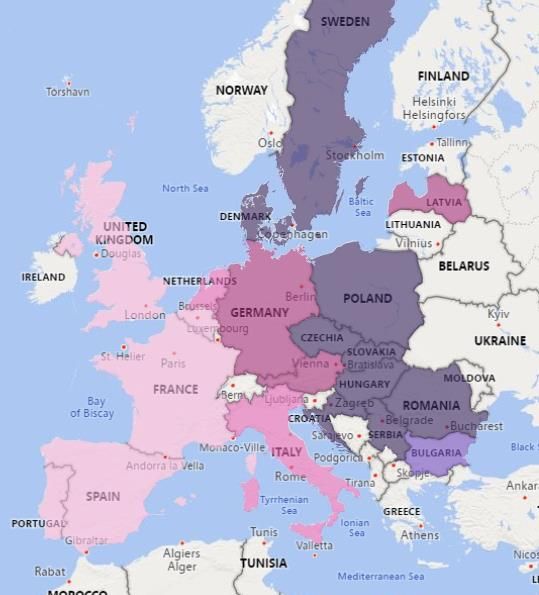
Summer Supply Outlook 2022
                                                                                                       SO0035-22
                                                                                                      11/04/2022

2. Assumptions
The Summer Supply Outlook 2022 is developed based on assumptions specific to the
upcoming summer season and short-term trends as detailed in the annexes. In any case actual
injection and supply mix will result from the decisions of market participants. The demand
data has been provided by TSOs on a monthly granularity level. An average daily demand has
been considered within each month. The modelling tool used for the Summer Supply Outlook
2022 is PLEXOS.

Infrastructure
The simulations consider the existing European gas infrastructure and the maintenance plans
to be completed during the upcoming summer 1 known as of 31st March 2022.

Demand
For comparison purposes, Figure 1 shows the European aggregated demand for the summer
2022 compared to the historical demand over the last ten summers (from April 1st to
September 30th). The demand for this coming summer is forecast to increase by 2.2% (from
9,968 GWh/d in S2021 to 10,190 GWh/d in S2022) being similar to the level from 2019. Despite
this expected marginal increase, the demand is expected to be in the same range as the last
three years.

                     Figure 1. - European daily average demand comparison (forecast for summer 2022).

Supply
The maximum supply potentials of the different sources providing gas to EU (Algeria, Libya,
Norway, Russia and LNG) are based on a five-year history (historical availability). Regarding

1   Technical capacities and maintenance plans are updated by TSOs.

                                                        Page 7 of 42
Summer Supply Outlook 2022
                                                                                              SO0035-22
                                                                                             11/04/2022

different LNG basins, it is based on the maximum supply potential defined in TYNDP 2020. The
detailed data is provided in the annexes.

                                Figure 2. –Maximum supply potential

Regarding the European domestic production, Figure 3 provides a comparison between the
last five seasons and the national production forecasted by the TSOs for summer 2022. The
increase in the summer domestic production is around 6% (387 TWh in Summer 2022 vs 365
TWh in Summer 2021). Nevertheless, domestic production is following the decreasing trend
observed in previous summers due the falling domestic production in the Netherlands,
Denmark and other European countries.

                          Figure 3. - National Production comparison (TWh).

                                            Page 8 of 42
Summer Supply Outlook 2022
                                                                                                 SO0035-22
                                                                                                11/04/2022

UGS inventory
According to AGSI+, the gas storage platform operated by GIE, the maximum daily storage
withdrawals reached 8.63 TWh on the 22nd of December 2021, the highest during the whole
winter and is representative of the last warm winter. This value is lower than the lowest value
of the previous winter (10.8 TWh) and far from the 11.4 TWh reached on 28th February 2018,
which is still the highest value since 2011 due to the cold spell in February-March 2018.

Figure 4 shows the evolution of total working gas volume (WGV) on October 1st and storage
utilization for the last 11 winters. The overall European gas storages’ working gas volume is
stable since 2015 and storages utilization during the winter 2021-2022 is on the lower range
compared to the 7 previous years: 541 TWh in W21-22 versus 717 TWh in W20-21 and 449 in
W18-19. The low utilization rate is mainly due to the mild temperatures observed during the
winter 2021/22

                         Figure 4. - Evolution of total WGV and winter utilisation

                                               Page 9 of 42
Summer Supply Outlook 2022
                                                                                                                       SO0035-22
                                                                                                                      11/04/2022

EU gas storage level on 1 April 2022
On 1 April 2022, the gas stock level is in the lower range of the past 5 seasons with 287 TWh
versus 336.5 TWh in 2021 and 601.4 TWh in 2020.

                      Figure 5. - Evolution of UGS stock level. Winters 2012-2022 (TWh) (Source: AGSI).

For the modelling of the different scenarios, Summer Supply Outlook 2022 considers the
storage inventory level per country on 1 April 2022 as the initial situation as shown in Figure
6.
                                                                                             Gas in Storage (TWh) WGV (TWh) %Full
                                                                         Austria                              12.27     95.50     13%
                                                                         Belgium                               1.33      9.01     15%
                                                                         Bulgaria                              0.99      5.81     17%
                                                                         Czech Republic                        9.49     35.99     26%
                                                                         German (H)                           54.54   209.50      26%
                                                                         Germany (L)                           8.14     22.94     35%
                                                                         Denmark                               3.48      9.08     38%
                                                                         Spain                                19.92     34.25     58%
                                                                         France                               28.49   128.46      22%
                                                                         Croatia                               0.87      4.77     18%
                                                                         Hungary                               9.93     67.70     15%
                                                                         Italy                                58.98   195.47      30%
                                                                         Latvia                                7.62     21.80     35%
                                                                         Netherlands                          29.56   145.31      20%
                                                                         Poland                               23.28     35.79     65%
                                                                         Portugal                              2.86      3.57     80%
                                                                         Romania                               6.42     32.99     19%
                                                                         Serbia                                0.00      4.53      0%
                                                                         Sweden                                0.01      0.01     66%
                                                                         Slovakia                              6.99     36.05     19%
                                                                         United Kingdom                        7.67      9.67     79%
                                                                                     Total                292.8309 1108.2036      26%
     Note: Value for Czech Republic includes SK storage located on the CZ territory, for supply scenarios the storage is assigned to SK
    Figure 6. - Actual storage inventory levels on 1st April 2022 (For some countries, the initial level includes strategic
                                                           stocks).2

2 The gas in storage on 1st April 2022 for each country is based on the AGSI platform. For Serbia, the initial storage is
considered 0% due to no availability of data. The %Full has been calculated using the gas in the storage from AGSI+ platform
and the Working Gas Volume from GSE Storage MAP database; since the last update was January 2018, updated AGSI values
for WGV have been taken into account for those storages with remarkable difference.

                                                              Page 10 of 42
Summer Supply Outlook 2022
SO0035-22
11/04/2022
In terms of absolute volumes in gas storages and considering the higher total capacity of
storages in these countries, the largest volumes on 1st April are stored in Italy and Germany.
The initial average UGS inventory is a little bit lower compared to 2021 (26% vs. 30%3.).
The aggregated European storage level on 1 April is in the average of the previous years.
However, there are substantial differences from one country to the other. Storages in Poland
and the United Kingdom have reached the highest observed levels in history whereas
Germany, Austria, Italy, Czech Republic, Hungary, Slovakia and Bulgaria are still in the lower
range of the last 6 years. These storage levels per country have been used as a starting point
for the Summer Supply Outlook 2022.
3The WGV of the UGS with no firm injection capacity is not considered, but still they can be used by the market participants
and would increase the total volume of gas stored in EU.
Page 11 of 42Summer Supply Outlook 2022
SO0035-22
11/04/2022
3. Modelling results
3.1 Baseline Scenario (Reference Case) - 90% storage target
The overall “summer injection” is defined as the quantity of gas necessary to reach a 90%
stock level of every European storage on 30 September 2022 starting from the above-
mentioned total European stock level of 26% on 1 April 2022.
The distribution of injection and supply along the summer months result from the modelling
and the following assumptions (further detailed in Annex A and B):
• The monthly gas demand estimated by TSOs;
• The monthly national gas production estimated by TSOs;
• The monthly capacities provided by TSOs;
• Exports towards Ukraine4; and
• The storage injection capacities as defined in Annex A and D.
The flexibility given to the model for the definition of the supply potentials derives from the
supply mix of the last five summers (See Annex B-Supply assumptions).
Based on these assumptions, the modelling has been used to check if any physical congestion
or dependence on an import source may limit the injection.
In order to assess the EU dependence on the Russian gas all simulations minimised the use of
this supply to the possible extent. Other supply sources are used therefore in priority.
The simulations show that in case there is no supply disruption, a 90% stock level can be
achieved by 30 September 2022 for all storages.
Figure 7 EU summer storage level evolution - 90% target
4 The exports to Ukraine are assumed to be on the average levels from last 5 summer periods.
Page 12 of 42Summer Supply Outlook 2022
SO0035-22
11/04/2022
Table 1 shows the evolution of the stock level per country as a result of the model for the
Baseline Scenario (Reference case).
Country 1/4/2021 1/5/2022 1/6/2022 1/7/2022 1/8/2022 1/9/2022 30/9/2022
AT 13% 16% 31% 45% 60% 75% 90%
BE 15% 10% 25% 42% 58% 76% 90%
BG 17% 29% 41% 53% 65% 78% 90%
CZ 26% 26% 36% 48% 62% 78% 90%
DE (H) 26% 31% 42% 53% 66% 79% 90%
DE (L) 35% 35% 45% 59% 72% 85% 90%
DK 38% 38% 46% 57% 70% 82% 90%
ES 58% 58% 66% 73% 76% 83% 90%
FR 22% 21% 29% 45% 60% 77% 90%
HR 18% 25% 38% 51% 64% 77% 90%
HU 15% 27% 39% 52% 65% 78% 90%
IT 30% 33% 43% 55% 67% 80% 90%
LV 35% 36% 44% 56% 67% 79% 90%
NL 20% 26% 38% 51% 65% 78% 90%
PL 65% 62% 64% 71% 79% 85% 90%
PT 80% 64% 77% 90% 90% 90% 90%
RO 19% 27% 40% 52% 65% 78% 90%
RS 0% 14% 29% 44% 60% 75% 90%
SE 66% 66% 66% 66% 90% 90% 90%
SK 19% 19% 31% 45% 61% 77% 90%
UK 79% 0% 0% 11% 53% 90% 90%
Table 1. - Storage Evolution Baseline Scenario (Reference Case)5.
The main finding of the Summer Supply Outlook is that the European gas network is capable
to enable market participants to reach at least a 90% stock level in all underground gas
storages by the end of this summer 2022 while TSOs can ensure the proper maintenance of
the gas system.
Figure 8 shows the breakdown of transported gas for each month (average daily values for
each month including exports) for the Baseline Scenario.
Figure 8. - Transported Gas on Baseline Scenario (Reference Case)
5
Note: Values for Czech Republic includes SK storage located on the CZ territory, for supply scenarios the storage
is assigned to SK
Page 13 of 42Summer Supply Outlook 2022
SO0035-22
11/04/2022
Figure 9 shows the level and composition of the supply mix for every month in the Reference
(90%) case. The monthly supply mix is stable over the summer 2022 period and Russian supply
accounts for a minimum of 20% of the total gas supply, while other sources are maximised but
limited by the given network firm capacity.
Figure 9. - Monthly supply mix.
Page 14 of 42Summer Supply Outlook 2022
SO0035-22
11/04/2022
3.2 Sensitivity-analysis – Alternative injection targets (80% and 100% targets)
Given the uncertainty on the stock level at the end of the season resulting from the behaviour
of market participants, two alternative injection targets have been considered: 80% and 100%
on 30 September 2022.
Figure 10 provides the stock level evolution curve as resulting from the modelling of Summer
Supply Outlook 2022 (actual injection curve will follow market decisions) and actual curves of
last five summers. We can observe that, the flexibility of the European gas transmission
system is high enough to allow for different supply patterns while reaching 80%, 90% and
100% stock level at the end of September 2022.
Figure 10. - Stock level development curve (% WGV).
In absolute terms, the target level of 90% represents a quantity of ca. 1000 TWh of gas in the
EU storages at the end of the summer 2022.
Considering the two alternative storage targets, all European gas storages can achieve the
80% and 100% of the WGV.
Still, for many operators the injection season continues in October allowing for further
injection if decided by market participants.
Given the supply constraints detailed in Annex B, the different injection targets are reached
through fluctuation of the supply levels.
Page 15 of 42Summer Supply Outlook 2022
SO0035-22
11/04/2022
Figure 11 compares the maximum and minimum supply potential per source6, with the results
of the supply shares modelled for Summer Outlook 2022.
Figure 11. - Fluctuation of the maximum monthly supply patterns in the sensitivity analysis on the stock level.
Figure 12 shows a comparison between the supply shares in the Reference Case (Baseline
Scenario) and the two alternative stock level targets (on a daily average basis) compared with
historical supplies for five previous seasons. For the purpose of the assessment, the supply
mix resulting from the modelling investigates the minimisation of the Russian supply.
However, the actual supply mix over summer will eventually be the result of the decisions
made by the market participants or policy makers.
Figure 12. - Comparison between the summer supplies in the Reference Case (Baseline Scenario) and the two alternative
stock level targets with historical data (TWh) 7.
6
Supply potentials forecast for year 2020 and 2025 for Caspian gas.
7
The supply utilisation given by the simulation results should not be taken as a forecast. Supply potential values
can be found in the annex B.
Page 16 of 42Summer Supply Outlook 2022
SO0035-22
11/04/2022
The supply utilisation in the baseline scenario and its sensitivities show that when the Russian
supply is minimised, Russian imports represent around 50% of the maximum supply potential,
while all other sources (Norway, Libya, Caspian and Algeria) are imported in a range of 90%
up to 100% of their maximum capacities.
Regarding LNG, the gas system can allow for the seasonal import of 700 to 800 TWh, which
is significantly higher than import levels observed in the past summers (524 TWh) and
winters (700 TWh), representing up to 90% of the maximum monthly import levels observed
in the cold months of winter (ca. 145 TWh/month).
Figure 13 shows the difference between the supply shares in the Reference Case (Baseline
Scenario) and the two alternative stock level targets.
Figure 13. - Summer supply average share.
Page 17 of 42Summer Supply Outlook 2022
SO0035-22
11/04/2022
3.3 Supply dependence assessment
Ukraine and Belarus route disruption
This section investigates the potential impact of the Belarus and Ukraine supply route
disruptions during the entire summer period from 1 April to 30 September.
Scope of the assessment
▪ Curtailment Rate (demand curtailment/Demand)
▪ Infrastructure limitation
▪ Storage levels at the end of summer
The approach for the allocation of demand curtailment is applied according to the Security of
Supply report: all member States withing a risk group as defined in Annex I of Regulation
2017/1938 (SOS2021 update) cooperate by avoiding a demand curtailment to the extent
possible and, be it the case, by sharing the curtailment equally in such a way that they try to
reach the same Curtailment Rate.
The same approach is considered at European level for the filling of storages.
This case considers the disruption of the transit through Ukraine and Belarus. The risk group
is formed of the Ukraine and Belarus risk groups defined for SOS 2021 by Austria, Bosnia and
Herzegovina, Belgium, Switzerland, Bulgaria, Croatia, Czech Republic, Denmark, Germany,
Estonia, Finland, Greece, Hungary, Italy, Latvia, Lithuania, Luxembourg, the Netherlands,
Poland, Romania, Serbia, Slovenia, Slovakia and Sweden.
Figure 14. – Ukraine and Belarus disruption risk group.
The results shows that there is no risk of demand curtailment with Ukraine and Belarus
transit route disruption. Simulations results shows infrastructure limitations for some Import
routes, LNG terminals and interconnections.
Page 18 of 42Summer Supply Outlook 2022
SO0035-22
11/04/2022
Import Routes
The import route from Norway to Germany
and to the Netherlands are used at their
maximum firm technical capacities as well as
the import route from Russia to Germany.
LNG Terminal
LNG terminals in Croatia, Italy, Lithuania, the
Netherlands and Poland are used at their
maximum capacities.
Interconnections
In the north of Europe, Interconnections
from the United-Kingdom to the
Netherlands, from Belgium to the
Netherlands and to Germany, from Germany
to Czechia and from Lithuania to Poland are
used at their maximum capacities. In
Western Europe, the interconnection Figure 15. – Demand Curtailment and capacity limitation
– Ukraine and Belarus disruption.
between France and Switzerland is used at
its maximum.
In the Southern Europe, to maximise imports
from the Caspian region and North Africa,
the internal infrastructure in Italy is used at
maximum capacities and the
interconnections from Serbia to Hungary
and from Bulgaria to Romania are used at
their maximum capacities.
Page 19 of 42Summer Supply Outlook 2022
SO0035-22
11/04/2022
Country End Volume (%)
Austria 81%
Belgium 100%
Bulgaria 100%
Czech Republic 80%
Gemany (H) 82%
Germany (L) 83%
Denmark 80%
Spain 100%
France 98%
Croatia 80%
Hungary 80%
Italy 80%
Latvia 100%
Netherlands 83%
Poland 79%
Portugal 100%
Romania 80%
Serbia 100%
Sweden 80%
Slovakia 80%
United Kingdom 100%
Figure 16. –Ukraine and Belarus disruption – Storage levels at the end of summer
Figure 17. –Ukraine and Belarus disruption – Storage levels evolution
In this scenario, Europe can only reach 84% of its total storage capacity (working gas volume).
Western European countries (United Kingdom, Belgium, France, Spain and Portugal) can reach
100% of their storage WGV. However, they cannot provide additional gas to the Eastern-
European countries because of limited capacities which are all used at their maximum
(Belgium to Germany, Belgium to the Netherlands and France to Switzerland).
Some European storages (Germany and Poland) are withdrawing gas to satisfy the demand at
the beginning of summer (April and May).
Page 20 of 42Summer Supply Outlook 2022
SO0035-22
11/04/2022
Russian supply disruption
This scenario considers the disruption of all the import routes from Russia. As no risk group is
defined in regulation 1938/2017, all European countries cooperate as if they were part of a
single European risk group.
Demand
Finland (10 to 70%) and the Baltic States (10
to 26%) are exposed to demand curtailment.
Import Route
The import route from Norway to Germany
and to the Netherlands are used at their
maximum firm technical capacities, as well
as the import route from Turkey to Greece.
LNG Terminal
LNG terminal in Croatia, Italy, Greece, the
Netherlands, Poland and Lithuania are used
at their maximum firm capacity.
Interconnections
In Northern Europe, Interconnections from
the United-Kingdom to the Netherlands,
from Belgium to Netherlands and to Figure 18. – Demand minimum dependence and capacity
Germany, from the Netherlands to Germany limitation – Russian Dependence
and from Southern Germany to Denmark
are used at their maximum capacity.
Germany is facing internal limitation (South
--> North) and interconnections Estonia -->
Finland and Lithuania --> Latvia are used at
their maximum.
In Western Europe, interconnection
between France and Switzerland is used at
its maximum.
In Southern Europe, in order to maximise
imports from the Caspian region and North
Africa the internal infrastructure in Italy is
used at maximum capacities, as well as the
interconnections towards Austria and
Slovenia. Interconnection between Croatia
to Hungary is also at its maximum to provide
gas coming from the Croatian LNG terminal.
This scenario additionally considers the potential impact of a short-term and coordinated
anticipation of the TSOs to mitigate the impact of a Russian supply disruption by introducing
some quick system modifications, maximising the possibility and potentially increasing gas
Page 21 of 42Summer Supply Outlook 2022
SO0035-22
11/04/2022
flow from West to East. This assessment is based on the ad hoc analysis conducted by
European TSOs on very short term, to provide a first estimate of the actions that can be taken
and their possible impact.
This short-term preparedness allows for more gas to be transported from Belgium and the
Netherlands to Germany. Under these conditions, the improved capacities allow to use the
full supply potential from Norway, and the full supply potential of LNG in France, Belgium and
the Netherlands.
Under these conditions only a part of European Countries will reach the target of 100% of
storage level at the end of summer.
5-35%
30%
50-60%
30-40%
5-30%
90%-100%
15-25%
50-60%
Figure 19. Russian supply disruption scenario – maximum storage level on 1 October
Page 22 of 42Summer Supply Outlook 2022
SO0035-22
11/04/2022
Figure 20. Russian supply disruption scenario – Maximum storage level evolution
In case of Russian supply disruption, European storages can only reach 45% of their total
working gas volume. We can observe that European Western countries (United Kingdom,
Belgium, France, Spain and Portugal) can reach 100% of the storage volume. However, they
cannot provide additional gas to the Eastern European countries since there are limited
capacities and they are all used at their maximum (Belgium to Germany and the Netherlands).
In the south of Europe, internal infrastructure in Italy is used at its maximum capacities so
can’t help more Austria to fill storages. Some European countries (Austria, Czech Republic,
Germany, Poland, Slovakia) are withdrawing a part of their gas stored to satisfy the need of
demand at the beginning of summer (April and May).
In case of additional imports coming from Turkey, additional gas can be stored in Central
Eastern Europe, accounting for an additional 10% of the European total storage capacity
(WGV).
Furthermore, in case of a short-term coordinated preparedness (increased capacities for some
interconnections), European countries can further cooperate to fill storages in Central Eastern
European and can more equally distribute gas through the different storages. However,
Northern countries are limited by import capacity limitations to provide more gas Southwards.
Storages in Eastern Europe increase their filling levels as, in Northern Europe, a lower storage
filling can be observed as a result of this cooperation.
Furthermore, an additional specific anticipation has been tested with interconnection
capacities made available from France to Germany to consider possible reassessment of the
criticality of flowing odorised gas to Germany in a context of gas shortage.
Page 23 of 42Summer Supply Outlook 2022
SO0035-22
11/04/2022
For this assessment, French and German TSOs investigated technical opportunities for a
reverse flow. This flow from France to Germany would be limited to 100 GWh/d in Summer,
but there is no final decision yet, on how to handle an injection of odorized gas in the German
network system.
In this reverse flow scenario combined with the short-term coordinated preparedness, 18.3
TWh (1.63% of WGV) of additional gas can be stored. The most significant increases are in
Germany (+2.7 TWh), Italy (+7.2 TWh), Austria (+2.5 TWh) and the Netherlands (+4.8 TWh).
Therefore, the short-term preparedness can allow for a more even distribution of the
storage filling levels at the end of injection period, so that most Central Eastern Europe
countries can show the same level of preparedness for the next winter. Furthermore,
Additional measures could be investigated to further reduce the dependence on Russian gas,
such as a reverse flow from France to Germany. This would however require lifting legal and
technical provisions on the acceptability of odorised gas in Germany, especially in storages
and in sensitive industrial processes.
Important note: In Germany, transmission system operators are prohibited from passing on
odorised gas to network customers (due to sulphur limits in gas specification G260) in order
to protect sensitive industrial processes. Where odorization is required, this takes place in the
distribution networks, whereas in France, gas is odorized upon entry into the transmission
network. Thus, there is currently no flow of (odorized) gas from France to Germany.
Page 24 of 42Summer Supply Outlook 2022
SO0035-22
11/04/2022
Dependence on Russian gas for winter preparedness
This scenario is meant at assessing the dependence of the EU on Russian gas to fill the storages
up to 90%.
In this specific assessment, all Member States cooperate to minimise the Russian supply at EU
level. The report therefore aims at showing the minimum dependence of the different
Member States on Russian supply to satisfy their demand and filling their storages.
Demand
Finland (10 to 70%) and the Baltic States (10
to 26%) are dependent on Russian supply to
satisfy their demand.
Import Route
The import route from Norway to Germany
and to the Netherlands are used at their
maximum firm technical capacities, as well
as the import route from Turkey to Greece.
LNG Terminal
LNG terminal in Croatia, Italy, Greece, the
Netherlands, Poland and Lithuania are used
at their maximum firm capacity.
Interconnections
In Northern Europe, Interconnections from
the United-Kingdom to the Netherlands, Figure 21. – Demand minimum dependence and capacity
limitations – Russian Dependence
from Belgium to Netherlands and to
Germany, from the Netherlands to Germany
and from Southern Germany to Denmark are
used at their maximum capacity. Germany is
facing internal limitation (South --> North)
and interconnections Estonia --> Finland and
Lithuania --> Latvia are used at their
maximum.
In Western Europe, interconnection
between France and Switzerland is used at
its maximum.
In Southern Europe, in order to maximise
imports from the Caspian region and North
Africa the internal infrastructure in Italy is
used at maximum capacities, as well as the
interconnections towards Austria and
Slovenia. Interconnection between Croatia
to Hungary is also at its maximum to provide
gas coming from the Croatian LNG terminal.
Page 25 of 42Summer Supply Outlook 2022
SO0035-22
11/04/2022
This scenario additionally considers the potential impact of a short-term and coordinated
anticipation of the TSOs to reduce the dependence on Russian supply by introducing some
quick system modifications, maximising the possibility and potentially increasing gas flow from
West to East. This assessment is based on the ad hoc analysis conducted by European TSOs in
very short term, to provide a first estimation on the actions that can be taken and their
possible impact.
This short-term preparedness allows for more gas to be transported from Belgium and the
Netherlands to Germany. Under these conditions, the improved capacities allow to use the
full supply potential from Norway, and the full supply potential of LNG in France, Belgium and
the Netherlands.
Under these conditions only a part of European Countries will reach the target of 100% of
storage level at the end of summer.
85%
35% 55%
85%
0%
35%
60%
Figure 22. –Russian dependence – Share of Russian gas necessary to meet the 90% storage level on 1 October
Page 26 of 42Summer Supply Outlook 2022
SO0035-22
11/04/2022
Figure 23. –Storage dependence on Russian supply to meet the 90% target
The EU gas system can rely on alternative gas supply sources to fill the storages up to 50%-
55% of the total Working Gas Volume (WGV), with an additional 5% increase in case additional
capacities can be made available as part of the short-term coordinated preparedness of the
European TSOs. The EU is dependent on Russian gas to inject the remaining 30% necessary to
meet the 90% target.
Furthermore, an additional specific anticipation has been tested with interconnection
capacities made available from France to Germany to consider possible reassessment of the
criticality of flowing odorised gas to Germany in a context of gas shortage.
For this assessment, French and German TSOs investigated technical opportunities for a
reverse flow. This flow from France to Germany would be limited to 100 GWh/d in Summer,
but there is no final decision yet, onhow to handle an injection of odorized gas in the German
network system.
In this reverse flow scenario combined with the short-term coordinated preparedness, 18.3
TWh (1.63% of WGV) of additional gas can be stored. The most significant increases are in
Germany (+2.7 TWh), Italy (+7.2 TWh), Austria (+2.5 TWh) and the Netherlands (+4.8 TWh).
Therefore, the short-term preparedness can allow for injecting more alternative gas at EU
level under certain conditions, but also allows for a more harmonised access to alternative
supply to fill up the storages, so that most Central Eastern Europe countries can reduce their
dependence on Russian gas. Furthermore, Additional measures could be investigated to
further reduce the dependence on Russian gas, such as a reverse flow from France to
Germany. This would however require lifting legal and technical provisions on the
acceptability of odorised gas in Germany, especially in storages and in sensitive industrial
processes.
Page 27 of 42Summer Supply Outlook 2022
SO0035-22
11/04/2022
Important note: In Germany, transmission system operators are prohibited from passing on
odorized gas to network customers (due to sulphur limits in gas specification G260) in order
to protect sensitive industrial processes. Where odorization is required, this takes place in the
distribution networks, whereas in France, gas is odorized upon entry into the transmission
network. Thus, there is currently no flow of (odorized) gas from France to Germany.
Page 28 of 42Summer Supply Outlook 2022
SO0035-22
11/04/2022
Conclusion
On 1 April 2022, the EU average storage level (26%) is in the range of previous season,
despite the historically low storage level observed at the beginning of the winter
season. This is partially be explained by the mild temperatures observed in Europe last
winter.
Gas injection has already begun in some storages in February (Latvia, Poland).
Baseline scenario
The European gas infrastructure offers sufficient flexibility to enable market
participants to reach at least a 90% stock level in all underground gas storages by the
end of this summer 2022.
The sensitivity analysis shows that a 100% stock level could as well be achieved in all
countries.
Maintenance can be performed to ensure infrastructure reliability in the long-term.
Exports to Ukraine can be ensured, with volumes comparable to previous summer
seasons.
The EU is dependent on Russian gas for a minimum of 20% of its supply.
To minimise the share of Russian gas in the supply mix, the EU can increase LNG
imports up to 80 bcm over the summer season. However, such import volumes are
significantly higher than the average 50 bcm observed in the past years, and even
higher than the 70 bcm observed in the last winter seasons. Furthermore, should more
LNG supply be available on the global market, infrastructure limitations prevent
additional LNG imports.
Belarus and Ukraine supply route disruption scenario
Europe can only reach 84% of its total storage capacity (working gas volume). Western
European countries (United Kingdom, Belgium, France, Spain and Portugal) can reach
100% of their storage WGV. However, they cannot provide additional gas to the
Eastern-European countries because of limited capacities which are all used at their
maximum (Belgium to Germany, Belgium to the Netherlands and France to
Switzerland).
Some European storages (Germany and Poland) are withdrawing gas to satisfy the
demand at the beginning of summer (April and May).
Russian supply disruption scenario
In case of supply disruption from Russia starting on 1 April, most European countries
cannot reach the target of 80% stock level with a significant difference between
European countries.
o 90% to 100% (ca. 190 TWh) filling level in Western Europe (UK, BE, FR, ES, PT)
Page 29 of 42Summer Supply Outlook 2022
SO0035-22
11/04/2022
o 30% to 60% (175 to 350 TWh) filling level in 3 European countries (NL, DE, IT)
representing 50% of the total European storage capacities (580 TWh out of
1100 TWh)
o 5% to 35% (17 to 150 TWh) filling level in Eastern Europe (LV, PL, CZ, SK, HU,
AT, HR, RS, RO and BG)
The assessment identifies import capacity limitations in Central Eastern Europe as well
as infrastructure limitations in the North-West and in the South of Europe preventing
additional gas to flow to Central-Eastern Europe and therefore limiting a possible
mitigation of the gas storage deficit.
Additionally, Latvia, Estonia and Finland, are exposed to a risk of demand curtailment
in case of full Russian supply disruption; and storage withdrawals are needed to satisfy
the summer demand in Northern and Central Eastern Europe.
Positive impact of anticipated preparedness
o The rapid implementation of additional capacities in Europe can enhance the
cooperation between Member States in Central-Eastern Europe.
o in case of exceptional political decision, the reverse flow from France to
Germany under certain conditions (e.g., acceptability of odourised gas for
storages and industry consumers), can additionally participate to decreasing
the dependence on Russian gas.
Russian supply dependence assessment
Most European countries do not rely on Russian gas to satisfy their demand but Latvia,
Estonia and Finland. However, most countries rely on Russian gas to reach the 80% or
90% storage level target on 1 October. The assessment identifies import capacity
limitations in Central Eastern Europe as well as infrastructure limitations in the North-
West and in the South of Europe preventing gas from alternative sources to flow from
Western to Central-Eastern Europe and thus mitigating the dependence on Russian
supply.
Positive impact of short-term preparedness by European TSOs
o The rapid implementation of additional capacities in Europe can enhance the
cooperation between Member States in Central-Eastern Europe.
o in case of exceptional political decision, the reverse flow from France to
Germany under certain conditions (e.g., acceptability of odourised gas for
storages and industry consumers), can additionally participate to decreasing
the dependence on Russian gas.
Imports of alternative supply sources from Turkey to Bulgaria can additionally reduce
the dependence of the Balkan countries on Russian gas.
Important:
Page 30 of 42Summer Supply Outlook 2022
SO0035-22
11/04/2022
ENTSOG Summer Supply Outlook 2022 is an assessment of the readiness of the gas
infrastructure to cope with the upcoming summer season under different scenarios, but this
assessment is not a forecast of the expected gas supply situation. The actual utilisation of the
gas infrastructure, including the development of the gas storage levels, will be determined by
the decisions of the market participants and influenced by external factors such as policy
decisions.
The simulations of the disruption scenarios have been performed on 1 April and are
assuming a supply disruption starting on 1 April. However, at the date of publication of the
Summer Supply Outlook 2022 report, no supply disruption has been observed and the
average storage level in Europe is 31% compared to the 21% resulting from the simulations.
Therefore, when interpreting the results, it should be considered that in case of a supply
disruption happening during the summer period, the storage levels on 1 October are
dependent on the storage levels at the date of the disruption. Hence, on 27 April, it could be
expected that a disruption occurring on 1 May would allow to fill the gas storages up by an
additional 10% compared to what is presented in this report.
Page 31 of 42Summer Supply Outlook 2022
SO0035-22
11/04/2022
Legal Notice
The current analysis is developed specifically for this Summer Supply Outlook. It results from
TSOs experience, ENTSOG modelling and supply assumptions and should not be considered as
a forecast. The actual supply mix and storage level on 30 th September 2022 will depend on
market behaviour and global factors.
ENTSOG has prepared this Summer Supply Outlook in good faith and has endeavoured to
prepare this document in a manner which is, as far as reasonably possible, objective, using
information collected and compiled by ENTSOG from its members and from stakeholders
together with its own assumptions on the usage of the gas transmission system. While
ENTSOG has not sought to mislead any person as to the contents of this document, readers
should rely on their own information (and not on the information contained in this document)
when determining their respective commercial positions. ENTSOG accepts no liability for any
loss or damage incurred as a result of relying upon or using the information contained in this
document.
Page 32 of 42Summer Supply Outlook 2022
SO0035-22
11/04/2022
Annex A – Underground storages assumptions
The total quantity of gas to be injected from 1st April to 30th September 2022 is defined as the
difference between:
• the sum of the working volume of all European UGS times the targeted stock level, and
• the stock level of European UGS on 1st April 20228
This quantity will be split per month by the model based on the temporal optimisation,
considering the limits set by the linearization of the injection curves.
Figure 12 shows the average injection curve, based on the storage profiles provided by GSE
members. Default values are used in case specific country profiles are not available, calculated
based on the WGV-weighted average of the provided ones. The detail of the curves defined
at country level is included in Annex D.
Figure 24. - Injection average curve.
8
The %Full has been calculated using the gas in the storage from AGSI+ platform and the Working Gas Volume from GSE
Storage MAP database; since the last update was January 2018, updated AGSI values for WGV have been taken into account
for those storages with remarkable difference.
Page 33 of 42Summer Supply Outlook 2022
SO0035-22
11/04/2022
Annex B – Supply assumptions
Minimum supply per source: The minimum supply per source, on daily average, is set 0 for all
supply source
Maximum supply per source: The maximum supply per source, on daily average, is set as the
average of maximum monthly supply of the last 6 summers (April to September for years 2016,
2016, 2017, 2018, 2019 and 2021) for each supply source. LNG supply maximum supply used
are TYNDP2020 maximum supply values.
Use of Supplies: Modelling is handled as to ensure use of the different supply sources pro-
rata of their maximum.
The model can access additional flexibility on LNG, Russia and Norway only once all sources
have reached their maximum. This way, the access to higher levels than these maximums will
imply they will only be used by the model when it is necessary to avoid demand disruptions.
Additional Flexibility: The additional flexibility is based on the difference between the
maximum supply per source (calculated as noted above) and the maximum of the maximum
monthly supply of the last 36 summer months. We allow this flexibility only for the sources
that have a difference higher than 150 GWh/d between the average of maximum monthly
supply and the maximum of the maximum monthly supply.
Sources Minimum Maximum (GWh/d) Maximum + Additional Flex (GWh/d)
Caspian 0 350 350
Algeria 0 1,016 1,016
LNG 0 4,745 4,745
Libya 0 190 190
Norway 0 4,153 4,153
Russia 0 4,393 4,393
Table 2. - Minimum, maximum and additional flexibility per supply source.
Page 34 of 42Summer Supply Outlook 2022
SO0035-22
11/04/2022
Figure 25. Minimum, maximum and additional flexibility per supply source.
Note: The gas supplies are a modelling result that depends on the supply assumptions, which
are derived from the Summer Reviews.
Page 35 of 42Summer Supply Outlook 2022
SO0035-22
11/04/2022
Annex C – Summary of Summer Supply Outlook 2021 assumptions
Assumptions Reference case
Demand and National Average monthly demand and production anticipated by
Production TSOs.
European aggregated injection over the summer:
quantity necessary to reach injection target (80%, 90%
Monthly injection or 100%) on 30th September 2022.
Monthly injection (aggregated and per Zone) is a result
of the modelling.
Overall supply Sum of demand and injection for the whole summer.
Supply shares Supply shares is a result of the modelling.
Import routes Split between import routes is a result of the modelling.
Firm technical capacity as provided by TSOs considering
Cross-border capacity
reductions due to maintenance.
Exports towards Ukraine 344.9 GWh/d over the Summer Outlook 2022 period.
Page 36 of 42Summer Supply Outlook 2022
SO0035-22
11/04/2022
Annex D – Data for Summer Supply Outlook 2021
The data for Summer Supply Outlook 2021 is available online as an annex of this report. The
data available is specifically:
• Linearization curves of the injection in the storages (source GSE members).
• Average monthly national production forecast.
• Average monthly demand forecast.
• Average monthly final and power demand forecast.
Page 37 of 42Summer Supply Outlook 2022
S00035-22
11/04/2022
Annex E – Modelling approach
The network used in this report is the up to data collection time and reflect changes in
topology submitted by TSOs.
The following elements are part of the modelling:
• Definition of six temporal periods, representing the months from April to September.
• Temporal optimization means the optimisation of the summer as a whole period in a
single simulation. This implies that the model anticipates an event, adapting the flows in
the previous months and mitigating its impact.
• Use of linearization curves for storage injection capacities, as provided by GSE Members,
to consider the reduction of injection capacity when the stock level increases.
Modelling enables the identification of potential capacity and supply limitations, if any,
preventing the targeted stock level in each European storage by 30 th September 2021 being
reached.
Page 38 of 42Summer Supply Outlook 2022
SO0035-22
11/04/2022
Annex F – RESULTS INTERPRETATION AND EXTRAPOLATION
Relation between Demand and Injection level
When a specific area has no supply flexibility due to infrastructure limitations (bottlenecks) at
its borders, Demand and Storage injection/withdrawal are interdependent.
In such cases, a reduction in demand would allow additional storage injection to the extent
the storage injection capacity is not fully used.
For instance, in case of a disruption scenario, a reduction of the demand (5 TWh) in a specific
area with no additional flexibility could allow to additionally inject the same amount of gas in
the storages of the same area (5 TWh)
Congested
area
Impact of a delayed disruption scenario (not starting on 1 April)
Disruption scenarios are simulated from 1 April to 30 September. However, in case a
disruption would start at a later stage, a combination of the baseline scenario and the
disruption scenario should be considered as a proxy to assess the impact of such a variant
scenario at EU level.
For instance, if the disruption started on 1 May, the baseline scenario could be considered
from 1 April to 1 May, and from 1 May to 30 September, the evolution of the disruption
scenario can be assessed by shifting the storage curve along the y-axis (storage level) so that
the storage levels are aligned on 1 May.
Page 39 of 42Summer Supply Outlook 2022
SO0035-22
11/04/2022
30% on 1 May
Shift to 30%
on 1 May
Page 40 of 42Summer Supply Outlook 2022
SO0035-22
11/04/2022
Annex G – Storage levels on 1 October
Country WGV Level on Level on 1 Level on 1 Level on 1 Level on 1 October
[TWh] 1 April October October October Russian disruption
Russian Short-term Russian with additional
disruption preparedness disruption with import flexibility in
with Russian additional import SEE and short-term
Disruption flexibility in SEE preparedness
Austria 95.5 13% 30% 40% 40% 40%
Belgium 9 15% 100% 100% 100% 100%
Bulgaria 5.8 17% 15% 25% 100% 100%
Czech Republic 35.8 26% 5% 30% 30% 30%
Gemany (H) 209.5 26% 30% 40% 40% 40%
Germany (L) 23 35% 85% 50% 50% 50%
Denmark 9 38% 5% 33% 33% 33%
Spain 35.2 58% 100% 100% 100% 100%
France 130.5 22% 100% 100% 100% 100%
Croatia 4.8 18% 8% 30% 30% 30%
Hungary 67.7 15% 5% 30% 30% 30%
Italy 195.5 30% 55% 55% 60% 60%
Latvia 21.8 35% 30% 30% 30% 30%
Netherlands 58.5 20% 65% 50% 65% 65%
Poland 35.8 65% 5% 33% 33% 33%
Portugal 3.6 80% 100% 100% 100% 100%
Romania 32.8 19% 5% 30% 50% 50%
Serbia 4.5 0% 5% 25% 100% 100%
Sweden 0.01 66% 5% 33% 33% 33%
Slovakia 36 19% 5% 30% 30% 30%
United
Kingdom 12.2 75% 100% 100% 100% 100%
Note: Value for Czech Republic includes SK storage located on the CZ territory, for supply scenarios the storage is assigned to SK
Table 3 – European storage filling levels per country and per scenario
Page 41 of 42Summer Supply Outlook 2022
SO0035-22
11/04/2022
Annex H – List of Figures and Tables
Figures:
Figure 1. - European daily average demand comparison (forecast for summer 2022). ............ 7
Figure 2. –Maximum supply potential ....................................................................................... 8
Figure 3. - National Production comparison (TWh). .................................................................. 8
Figure 4. - Evolution of total WGV and winter utilisation .......................................................... 9
Figure 5. - Evolution of UGS stock level. Winters 2012-2022 (TWh) (Source: AGSI). .............. 10
Figure 6. - Actual storage inventory levels on 1st April 2022 (For some countries, the initial level
includes strategic stocks). ........................................................................................................ 10
Figure 7 EU summer storage level evolution - 90% target ...................................................... 12
Figure 8. - Transported Gas on Baseline Scenario (Reference Case) ....................................... 13
Figure 9. - Monthly supply mix. ................................................................................................ 14
Figure 10. - Stock level development curve (% WGV).............................................................. 15
Figure 11. - Fluctuation of the maximum monthly supply patterns in the sensitivity analysis on
the stock level. ......................................................................................................................... 16
Figure 12. - Comparison between the summer supplies in the Reference Case (Baseline
Scenario) and the two alternative stock level targets with historical data (TWh). ................. 16
Figure 13. - Summer supply average share. ............................................................................. 17
Figure 14. – Ukraine and Belarus disruption risk group. .......................................................... 18
Figure 15. – Demand Curtailment and capacity limitation – Ukraine and Belarus disruption. 19
Figure 16. –Ukraine and Belarus disruption – Storage levels at the end of summer .............. 20
Figure 17. –Ukraine and Belarus disruption – Storage levels evolution .................................. 20
Figure 18. – Demand minimum dependence and capacity limitation – Russian Dependence 21
Figure 19. Russian supply disruption scenario – maximum storage level on 1 October ......... 22
Figure 20. Russian supply disruption scenario – Maximum storage level evolution ............... 23
Figure 21. – Demand minimum dependence and capacity limitations – Russian Dependence
.................................................................................................................................................. 25
Figure 22. –Russian dependence – Share of Russian gas necessary to meet the 90% storage
level on 1 October .................................................................................................................... 26
Figure 23. –Storage dependence on Russian supply to meet the 90% target ......................... 27
Figure 24. - Injection average curve. ........................................................................................ 33
Figure 25. Minimum, maximum and additional flexibility per supply source. ........................ 35
Tables:
Table 1. - Storage Evolution Baseline Scenario (Reference Case)............................................ 13
Table 2. - Minimum, maximum and additional flexibility per supply source. ......................... 34
Page 42 of 42You can also read