Essential Oils Reduce Grey Mould Rot of Apples and Modify the Fruit Microbiome during Postharvest Storage - MDPI
←
→
Page content transcription
If your browser does not render page correctly, please read the page content below

Journal of
             Fungi
Article
Essential Oils Reduce Grey Mould Rot of Apples and Modify
the Fruit Microbiome during Postharvest Storage
Giada Schiavon 1,2 , Marco Garello 1,2 , Simona Prencipe 1 , Giovanna Roberta Meloni 1,2 , Fabio Buonsenso 1,2
and Davide Spadaro 1,2, *

                                         1   Department of Agricultural, Forestry and Food Sciences (DISAFA), University of Turin,
                                             Largo Paolo Braccini 2, 10095 Grugliasco, Italy
                                         2   Centre of Competence for the Innovation in the Agro-Environmental Sector-AGROINNOVA,
                                             University of Turin, Largo Paolo Braccini 2, 10095 Grugliasco, Italy
                                         *   Correspondence: davide.spadaro@unito.it

                                         Abstract: Botrytis cinerea is the causal agent of grey mould rot of apples. The efficacy of biofumigation
                                         with thyme (Thymus vulgaris), savoury (Satureja montana), and basil (Ocimum basilicum) essential oils
                                         (EOs) at 1%, 0.5%, and 0.1% concentrations were tested against B. cinerea. In vitro, the results showed
                                         100% growth inhibition at 1% concentration for all oils. Subsequent biofumigation experiments
                                         on apples of cultivar ‘Opal’ with 1% EOs showed that, after 60 d storage, thyme and savoury EOs
                                         significantly reduced grey mould rot incidence (average incidence 2% for both treatments) compared
                                         to the control (7%). Analyses of quality indicated slightly higher fruit firmness for 1% thyme at 30 d
                                         and slightly higher titratable acidity for 1% thyme and savoury at 60 d. Sampling of the atmosphere
                                         inside the cabinets was performed to characterize and quantify the volatile components of EOs
                                         released through biofumigation. Though thymol and p-cymene were the main components of thyme
                                         EO, the antimicrobial activity was mainly due to the presence of thymol and, to a lower extent, of
                                         carvacrol. In savoury EO, carvacrol and p-cymene were the main components, whereas in basil
                                         EO, linalool and estragole were mainly present. Metabarcoding analyses showed that the epiphytic
                                         microbiome had higher richness and evenness compared to their endophytic counterpart. By the end
Citation: Schiavon, G.; Garello, M.;     of shelf-life, treatments with thyme EO reduced B. cinerea abundance compared to the inoculated
Prencipe, S.; Meloni, G.R.; Buonsenso,   control for both endophytes (from 36.5% to 1.5%) and epiphytes (from 7.0% to 0.7%), while favouring
F.; Spadaro, D. Essential Oils Reduce    a significant increase in Penicillium species both in endophytes (from 0.2% to 21.5%) and epiphytes
Grey Mould Rot of Apples and             (from 0.5% to 18.6%). Results indicate that thyme EO (1%) and savoury EO (1%) are equally effective
Modify the Fruit Microbiome during       in hampering grey mould rot development in vivo.
Postharvest Storage. J. Fungi 2023, 9,
22. https://doi.org/10.3390/             Keywords: natural antifungal compounds; biofumigation; Botrytis cinerea; metabarcoding; postharvest
jof9010022
                                         disease; Malus x domestica; SPME-GC-MS
Academic Editors: Barbara
Blanco-Ulate and Noam Alkan

Received: 7 December 2022
                                         1. Introduction
Revised: 18 December 2022
Accepted: 20 December 2022
                                              Apples (Malus x domestica Borkhausen), rich in vitamins, fibres, minerals, and polyphe-
Published: 22 December 2022
                                         nols [1,2], are among the most-consumed fruits worldwide. Apples are available year-round
                                         and they are stored for several months after harvest. During storage, apples are susceptible
                                         to postharvest pathogens [3]. Controlled conditions and chemical treatments are the most
                                         common strategies used to manage diseases and spoilage in apples after harvest [1,4].
Copyright: © 2022 by the authors.             Grey mould rot, caused by the fungus Botrytis cinerea Persoon: Fries, is one of the
Licensee MDPI, Basel, Switzerland.       diseases that can appear during the postharvest storage of apples. Postharvest diseases
This article is an open access article   have been mainly controlled with chemicals, but nowadays consumers are demanding less
distributed under the terms and          chemical pesticide residues in food. Moreover, the legislation, in particular in the European
conditions of the Creative Commons
                                         Union, is pushing towards a dramatic reduction of pesticide use and a substitution with
Attribution (CC BY) license (https://
                                         more environmentally friendly treatments [5]. Alternative methods to control postharvest
creativecommons.org/licenses/by/
                                         diseases could be based on natural products, such as essential oils [6–8].
4.0/).

J. Fungi 2023, 9, 22. https://doi.org/10.3390/jof9010022                                                       https://www.mdpi.com/journal/jof
J. Fungi 2023, 9, 22                                                                                              2 of 18

                             Plant essential oils are biologically active substances and potentially effective as biopes-
                       ticides for disease management. Many essential oils (EOs) proved their effectiveness against
                       grey mould and brown rot (Monilinia species) on pome and stone fruit, strawberries, and ta-
                       ble grapes [8–11]. On apples, various studies have reported the efficacy of EOs against blue
                       mould (Penicillium expansum) [12–14], grey mould [8,12,15,16], and bitter rot (Colletotrichum
                       species) [17,18], as well as Alternaria and Fusarium rots [17–19]. Different researchers de-
                       scribed the volatile organic compounds (VOCs) present in EOs, such as thymol, eugenol,
                       p-cymene, and carvacrol, which show strong antifungal activity and could be used for grey
                       mould control on fruit [20]. The use of alternative control strategies, such as essential oils,
                       is slowly reaching practical application [21,22].
                             During plant growth and after harvest, microorganisms play an important role and
                       strictly collaborate with their host. High microbiome diversity is valuable for fruit and
                       vegetables and pathogenic fungi can disturb the microbial balance, by creating a dysbiosis
                       state [23,24]. Microorganisms are an intrinsic element of the horticultural products found as
                       endophytes within tissues and as epiphytes on the surface. Most of these microbes are not
                       pathogens. Their ecology, colonization, activity in fruit quality, fitness, and disease protec-
                       tion are generally unexplained [25]. Microbial community dynamics can change due to fruit
                       physiology and other abiotic factors, including storage, and postharvest treatments [26].
                       Variations of microorganisms on the peel are linked to fruit decay during storage [23,27,28].
                             This study aimed to test the efficacy of three EOs during storage (Thymus vulgaris,
                       Satureja montana, and Ocimum basilicum subspecies basilicum) and a thymol formulation
                       against B. cinerea on apples, both in vitro and in vivo. To verify the persistence of EOs
                       during storage, we characterized the volatile components of EOs during two months of
                       storage in cabinets under controlled conditions by using Solid Phase Micro-Extraction
                       and Gas Chromatography combined with Mass Spectrometry (SPME-GC-MS). We also
                       determined the effect of a postharvest application of thyme EO on the composition of the
                       epiphytic and endophytic fungal microbiota of apples during cold storage.

                       2. Materials and Methods
                       2.1. Essential Oils Preparation
                             The EOs of thyme (T. vulgaris), savoury (S. montana), and basil (O. basilicum subspecies
                       basilicum) used in the assays were purchased from Pranarôm Aromaterapia Scientifica
                       (Ghislenghien, Belgium). An experimental thymol-based formulation, supplied by Xeda
                       International (Saint-Andiol, France), was also tested.

                       2.2. In Vitro Biofumigation Test
                            For the in vitro test, EOs of thyme, basil, savoury, and the thymol formulation were
                       used at the concentrations of 1%, 0.5%, and 0.1% to evaluate the growth inhibition of two
                       strains of B. cinerea isolated from apples (BOT1 and BOT2), taken from the collection of
                       the University of Torino (DISAFA). Potato Dextrose Agar medium (PDA, EMD Millipore
                       Corporation, Darmstadt, Germany) was poured into the Petri dish (15 ml per Petri dish)
                       and the percentage of EO tested (1, 0.5 or 0.1% v/v) was added after autoclaving. At
                       the same time, Petri dishes with only PDA medium were inoculated with one mycelium
                       plug (8 mm diameter) taken from cultures grown on PDA for 5 days at room temperature
                       (24 ± 1 ◦ C) for both strains of B. cinerea. Petri dishes with the EOs were placed on the
                       top of the inoculated Petri dishes with a face-to-face orientation to build a sandwich, and
                       subsequently closed with parafilm. Petri dishes were incubated at 20 ± 1 ◦ C for 5 days, and
                       then the diameter of the pathogen mycelium was measured. Controls were set up using
                       a PDA Petri dish on top of inoculated Petri dishes. The assay was performed twice, each
                       time with three biological replicates.

                       2.3. Efficacy of EOs against Grey Mould Rots on Apples
                             Scab-resistant ‘Opal’ apples were used and harvested in Saluzzo (CN), Italy. The
                       tests were set up using the three EOs and the thymol formulation. The preparation of EO
J. Fungi 2023, 9, 22                                                                                             3 of 18

                       diffusors was carried out by adding the EOs (1% v/v) in sterile deionized water (98% v/v)
                       and Tween 20 (1% v/v). The oil and medium suspensions were then poured into Petri dishes
                       (15 ml per Petri dish). For each of the four biofumigation treatments, three replicates of
                       30 apples were set up. Chemical control was inoculated with B. cinerea and treated with the
                       fungicide pyrimethanil (Scala® , 36.8%, BASF) at 0.067% concentration. Fungicide solution
                       was sprayed on the apples, which were then left to dry before subsequent treatments.
                       Control fruits were inoculated with B. cinerea. A healthy control was included, made of
                       healthy fruits. Pathogen inoculation was performed by immersion in a conidial suspension
                       of B. cinerea of 1 × 10⁴ cells/mL. For inoculum preparation, two strains of B. cinerea (BOT1
                       and BOT2) taken from the collection of the University of Torino (DISAFA), were cultured on
                       PDA supplemented with 0.0025 g streptomycin (Merck, Darmstadt, Germany) for 30 days
                       with 12 hours photoperiod. Conidia were collected by pouring a 1% suspension of the
                       surfactant Tween-20 and by scraping it with a Drigalsky spatula. Counting was performed
                       by microscopy using Burker’s chamber. Before inoculation, 20% of the fruits were wounded
                       using a sterile tip to promote pathogen infection. Apples were inoculated by immersion
                       for 3 minutes in the conidial suspension. The fruits were allowed to dry for 1 hour before
                       being placed in the cabinets. Plastic boxes with apples were placed in cabinets with six
                       slow-released diffusors. The diffusors were open inside the cabinets and positioned around
                       the boxes. The fruits were stored for a period of 60 days at 1 ± 1 ◦ C and 95% relative
                       humidity and subsequently kept in shelf-life conditions at 23 ± 1 ◦ C for 10 days. The
                       evaluation of disease incidence was carried out after 30 and 60 days of storage and then
                       after 10 days of shelf-life.
                             Quality analysis, firmness, total soluble solids (TSS), and titratable acidity were mea-
                       sured on three replicates of five apples for each treatment at harvest, after 30 days of storage,
                       and after 60 days of storage. Apples for quality analysis were not inoculated. Firmness
                       was determined using the penetrometer 53200 (Turoni, Italy) with an 11 mm diameter tip
                       that returns a measurement in N/cm2 . Firmness was measured on two opposite sides of
                       the apple after removing the skin and then averaged. For total soluble solids, the NR151
                       refractometer (Rose Scientific Ltd., Edmonton, Canada) was used. Values obtained from
                       the measurement are expressed as total soluble solids content (%) for each apple and
                       subsequently averaged for each replicate. The titratable acidity was determined using the
                       extracted and filtered juice. The juice sample was titrated with a 0.1 M NaOH solution
                       until the neutralization reaction at pH 8.2 using the Five Easy Plus pH meter FP20-Std-Kit
                       (Mettler Toledo, Italy). The total acidity value was calculated using the formula:

                                                        (VNaOH × 0.0067 × 100)/6,                                   (1)

                       where 0.0067 indicates the acidity factor of malic acid and 6 indicatesnthe grams of juice
                       used for the titrating solution.

                       2.4. Characterization of Volatile Compounds of EOs in the Cabinets during Storage
                            Composition of thyme, savoury, and basil essential oils and of thymol formulation
                       was obtained by GC-MS. Characterization of the VOCs of the atmosphere of the cabinets
                       during the storage trial on apples ‘Opal’ was obtained by SPME-GC-MS analysis. The air
                       of the cabinets was sampled at 1, 30, and 60 days of storage. Pure EOs were diluted in vials
                       to 1% in n-hexane (thyme and savoury) or methanol (basil) and injected by direct injection
                       into GC-MS using the split mode (80%). Xedatim was diluted in vials to 0.2% in methanol
                       (WVR, Radnor, PA, USA). Sampling in each cabinet was performed using an SPME fibre
                       assembly polydimethylsiloxane (PDMS) of 30 µm (Supelco Analytical, Bellefonte, PA, USA)
                       for 15 minutes at 1, 30, and 60 days of fruit incubation.
                            Compositional analyses of EOs were performed using a Shimadzu (Kyoto, Japan)
                       GC-2010 Plus gas chromatography coupled to a GCMS-QP2010 Ultra mass spectrometer
                       (Shimadzu, Kyoto, Japan) and a split-splitless injector (Shimadzu, Kyoto, Japan). The
                       gas chromatograph was equipped with a Zebron ZB-5MSi (Phenomenex, Torrance, CA,
                       USA) fused silica capillary column (30 m × 0.25 mm LxID) with 0.25 µm film thickness.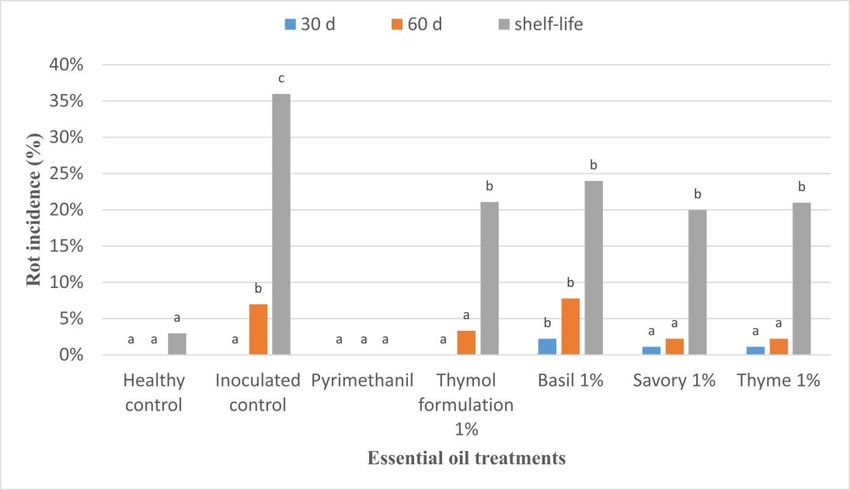
J. Fungi 2023, 9, 22                                                                                            4 of 18

                       Helium was used as the carrier gas using a linear velocity of 37 cm/s with a constant flow
                       rate of 1.0 mL/min. The pressure was 55 kPa and the total flow was 105 mL/min. The
                       spectra of ion-electron impact at 70 eV were recorded in scan mode (30–700 m/z). For
                       savoury EO, the oven program was set with an initial temperature of 50◦ C and held for
                       3 minutes, and the heating ramp for the chromatographic separation was set as follows:
                       50 ◦ C to 70 ◦ C at a speed of 5 ◦ C/min, isothermal for 5 min, from 70 ◦ C to 90 ◦ C with an
                       increment of 1 ◦ C/min, from 90 ◦ C to 150 ◦ C with heating of 5 ◦ C/min, and, finally, up
                       to 270 ◦ C by heating at 40 ◦ C/min and maintained for 5 min. For thyme EO, the same
                       protocol was used without the isothermal phase at 70 ◦ C for 5 min. Chromatographic
                       separation of the components of the basil EO and of the thymol formulation was conducted
                       following a previously established method [29]. The temperature program was as follows:
                       initial temperature of 40 ◦ C for 2 min, increased by 10 ◦ C/min up to 300 ◦ C, which was
                       maintained for 2 min. Desorption of the compounds from the fibre was conducted in the
                       GC injector at the temperature of 250 ◦ C, and the ion source and interface were fixed at
                       280 ◦ C.
                             The relative composition of volatile compounds was calculated by comparing the
                       area of each peak with the area of the total chromatogram. Absolute quantification was
                       calculated for thymol, carvacrol, and estragole by the external calibration method, using a
                       standard calibration curve prepared between 1 and 50 ppm (mg/kg) for each compound.
                       The relative quantification for each VOC was determined using the thymol standard
                       calibration curve for thyme EO and thymol formulation, the carvacrol standard calibration
                       curve for savoury EO, and the estragole calibration curve for basil EO.

                       2.5. Apple Microbiome Sampling
                             Apples for microbiome sampling were collected three times: after harvest, after
                       60 days of storage at 1 ± 1 ◦ C, and after 10 days at 23 ± 1 ◦ C (shelf-life). At each sampling,
                       five biological replicates were collected, each one consisting of 15 apples. Samples were
                       collected from a healthy control, inoculated control, fruits treated with pyrimethanil, and
                       fruits treated with thyme EO.
                             For epiphyte sampling, the surface of the apples was rubbed with sterile cotton swabs,
                       and the tip was deposited in a falcon tube with 8 ml of phosphate-buffered saline (PBS)
                       solution (Merck). The falcon was shaken at 250 rpm for 20 minutes at room temperature,
                       sonicated for 5 minutes at a frequency of 40 kHz and the tips of the cotton swab were
                       squeezed with sterile tweezers and placed in a second falcon, with 4 ml of PBS solution.
                       The falcon was shaken manually, then the tips were squeezed again, and the contents of the
                       two falcons were combined. Falcons were centrifuged at maximum speed for 30 minutes
                       and the supernatant was removed. The pellet was suspended with 2 ml of PBS solution and
                       the liquid was transferred to a new Eppendorf tube. The Eppendorf tube was centrifuged
                       for 30 minutes at maximum speed, the supernatant was removed, and the samples were
                       stored at −20 ◦ C.
                             For endophyte sampling, apples were washed in 5% bleach for two minutes, then
                       in water for two minutes, and finally with water for two more minutes. The surface of
                       the apples was rubbed with ethanol-soaked cotton, and the fruits were allowed to dry on
                       sterile paper. A 1-cm wide section of peel was cut all around the equator of each fruit and
                       placed in a sterile plastic jar. Samples were placed in liquid nitrogen immediately after
                       sampling and then stored at −20 ◦ C.

                       2.6. Genomic DNA Extraction and Sequencing
                             The extraction of epiphyte samples was performed with Wizard Genomic DNA Pu-
                       rification Kit (Promega Biotech AB, Finnboda Varvsväg, Sweden), following the protocol
                       suggested by the producers. The endophyte samples were lyophilized, then the DNA
                       was extracted using the kit DNeasy Power Soil (Qiagen, Hilden, Germany), following
                       the manufacturer protocol with minor modifications. Briefly, 0.10–0.15 g of lyophilized
                       sample and 60 µL of C1 solution were added into PowerBead tubes, which were vortexed.
J. Fungi 2023, 9, 22 5 of 18
The tubes were agitated via Tissue Lyser (Qiagen, Germany) for 30 minutes at maximum
frequency and centrifuged at maximum speed for 2 minutes. The supernatant was trans-
ferred to a 2 mL tube. Next, 500 µL of lysis buffer SL2 (Macherey-Nagel GmbH & Co. KG,
Düren, Germany) was added to PowerBead tubes, which were then vortexed. The tubes
were shaken via Tissue Lyser for 30 minutes at maximum frequency and centrifuged at
maximum speed for 2 minutes. The supernatant was added to the previously obtained
supernatant.
Library preparation, pooling, and sequencing were performed at the Genomics and
Microbiome Core Facility (GMCF) of Rush University (Chicago, IL, USA). Amplicons were
generated using a two-stage PCR amplification protocol [30]. Briefly, genomic DNA was
amplified with primers ITS3-KY02 (GATGAAGAACGYAGYRAA) and ITS4 (TCCTCCGCT-
TATTGATATGC) targeting fungal ITS2 regions [31]. The primers contained 5’ common
sequence tags (known as common sequence 1 and 2, CS1 and CS2; ACACTGACGACATG-
GTTCTACA and TACGGTAGCAGAGACTTGGTCT, respectively). First-stage PCR ampli-
fications were performed in 10 µl reactions in 96-well plates, using repliQa HiFi ToughMix
(Quantabio, Qiagen, Beverly, MA, USA). Primer concentrations were 300 nM. A blocking
oligonucleotide (ATTGATATGCTTAAATTCAGCGGGTAACCCCGCCTGACCTGGGGTC-
GCGTT-C3 spacer [31]) was added to the master mix at a concentration of 1 µM to reduce
amplification of the plant host DNA. Thermal cycler conditions were 98 ◦ C for 2 min,
followed by 28 cycles of 98 ◦ C for 10 s, 78 ◦ C for 1 s, 55 ◦ C for 1 s and 68 ◦ C for 1 s. Sub-
sequently, a second PCR amplification was performed in 10 µl reactions in 96-well plates
using repliQa HiFi ToughMix. Each well received a separate primer pair with a unique
10-base barcode, obtained from the Access Array Barcode Library for Illumina (Fluidigm,
San Francisco, CA, USA). One microliter of PCR product from the first stage amplification
was used as the template for the second stage, without clean-up. Cycling conditions were
98 ◦ C for 2 min, followed by 8 cycles of 98 ◦ C for 10 s, 60 ◦ C for 1 s and 68 ◦ C for 1 s.
Libraries were then pooled and sequenced with a 15% phiX spike-in on a MiSeq V3 flow
cell (2 × 300 paired-end reads).
2.7. Bioinformatics
Sequence analysis was performed using the QIIME2 suite [32] and custom python
scripts. Adapter contamination was removed with the Cutadapt plugin [33], then forward
and reverse reads were trimmed to 230 and 200 bases, respectively, based on quality
profiles and overlap constraints. Read merging, ASVs generation, and chimera filtering
were performed using DADA2 [34]. A Naive-Bayes predictor was trained on the UNITE
8.3 global database [35], integrated with other ITS sequences from the NCBI nucleotide
database [36] and used to classify the previously generated ASVs. Reads not belonging to
fungi and reads that present a global abundance of less than 0.05% of total sequences and
reads that appeared in less than four replications were removed.
The normalization of samples for alpha and beta diversity analyses was performed
using the scaling with the ranked subsampling (SRS) approach implemented in the module
by the same name [37], with a normalisation value of 9753. The Shannon diversity index
and number of observed features were selected as alpha diversity metrics, while the Bray-
Curtis dissimilarity index was chosen as the beta diversity metric. Statistical analyses of
alpha diversity results were performed using the non-parametric Kruskal-Wallis test, with
alphaJ. Fungi 2023, 9, 22 6 of 18
2.8. Statistical Analysis
Statistical analysis was performed using IBM SPSS software version 27.0 (SPSS Inc.,
Chicago, IL, USA). Data obtained in all experiments were analysed by analysis of variance
(ANOVA). The results of the treatments on in vitro inhibition, in vivo efficacy, and on
fruit quality analyses were separated at the level of 5% significance level (p < 0.005) using
Tukey’s test.
3. Results
3.1. EOs Efficacy Tests against Botrytis Cinerea
The results obtained from the in vitro test showed 100% growth inhibition for both
strains of B. cinerea tested and for all treatments using 1% concentration, except the strain
BOT1 treated with a thymol formulation (96.9% growth inhibition). Both thyme and
savoury EOs at 0.5% completely inhibited the fungal growth. EOs at 0.1% concentration
resulted in reduced growth inhibition (88.7–89.5% for thyme EO, 78.4–81.7% for savoury
EO, 0.9–14.9% for basil EO and 25.6–31.7% for the thymol formulation) compared to the
other considered concentrations, and for this reason, were dropped from the subsequent
analyses (Table 1).
Table 1. Effect of volatiles released by EOs on mycelial growth (diameter, cm) of two strains of
B. cinerea in sandwich plate experiments.
B. cinerea BOT1 B. cinerea BOT2
Treatment Concentration
Mean Diameter (mm) ± SD
1% 0.0 ± 0.0 a 0.0 ± 0.0 a
Thyme 0.5% 0.0 ± 0.0 a 0.0 ± 0.0 a
0.1% 8.8 ± 0.4 bc 8.1 ± 0.5 b
1% 0.0 ± 0.0 a 0.0 ± 0.0 a
Basil 0.5% 2.0 ± 1.1 a 0.0 ± 0.0 a
0.1% 65.5± 1.8 f 76.3 ± 0.4 e
1% 0.0 ± 0.0 a 0.0 ± 0.0 a
Savoury 0.5% 0.0 ± 0.0 a 0.0 ± 0.0 a
0.1% 16.6 ± 0.2 d 14.1 ± 0.5 c
1% 2.4 ± 0.2 ab 0.0 ± 0.0 a
Thymol formulation 0.5% 10.3 ± 1.1 cd 8.5 ± 0.4 bc
0.1% 52.6 ± 1.6 e 57.3 ± 1.1 d
Control Not appliable 77.0 ± 0.0 g 77.0 ± 0.0 e
EOs were applied at different concentrations (0.1, 0.5, and 1.0%). Petri dishes were grown at 20 ◦ C ± 1 ◦ C for
5 days. Different letters (a–g) indicated a significant difference determined by Tukey’s multiple comparison test
(p < 0.05). Values are indicated as mean ± standard deviation (SD).
3.2. Efficacy of EOs against Grey Mould Rot on Apples
The EOs efficacy tests against grey mould on apples showed the efficacy of the EOs
of thyme, savoury, and of a thymol formulation in reducing grey mould rots caused by
B. cinerea (Figure 1). After 30 days of storage at 1 ± 1◦ C, no observable rot developed in the
apples treated with the thymol formulation at 1%. The incidence of rot in the basil treatment
was 2%, and in the savoury and thyme EOs treatments it was 1%. After 60 days of storage
at 1 ± 1 ◦ C, the treatments with thyme at 1% and savoury at 1% were statistically different
from the inoculated control (p < 0.05) showing efficacy in the control of rot development.
Rot reduction was 42% for the thyme EO at 1% treatment and 44% for the savoury EO at
1% treatment.
No statistical difference was observed when comparing the incidence of rots for the
basil EO at 1% and thymol formulation at 1% treatments to the inoculated control (p > 0.05),
showing inefficacy in the control of grey mould.different from the inoculated control (p < 0.05) showing efficacy in the control of rot de-
velopment. Rot reduction was 42% for the thyme EO at 1 % treatment and 44 % for the
savoury EO at 1 % treatment.
No statistical difference was observed when comparing the incidence of rots for the
J. Fungi 2023, 9, 22 7 of 18
basil EO at 1 % and thymol formulation at 1 % treatments to the inoculated control (p >
0.05), showing inefficacy in the control of grey mould.
Figure 1. Grey mould incidence on apples ‘Opal’ treated with essential oil biofumigation and stored
Figure 1. Grey mould incidence on apples ‘Opal’ treated with essential oil biofumigation and stored
at 1 ± 1°C◦and 95 % relative humidity for 60 days and kept in shelf-life at 23 ± 1 °C for 10 days. Values
at 1 ± 1 C and 95% relative humidity for 60 days and kept in shelf-life at 23 ± 1 ◦ C for 10 days.
at the same time point, followed by the same letter, are not statistically different by Tukey’s test (p<
Values
0.05). at the same time point, followed by the same letter, are not statistically different by Tukey’s
test (p < 0.05).
3.3.
3.3. Quality
Quality Analyses
Analyses onon Fruits
Fruits
Quality parameters (firmness,total
Quality parameters (firmness, totalsoluble
soluble solids,
solids, andand titratable
titratable acidity)
acidity) werewere ana-
analysed
lysed on apples
on apples immediately
immediately after harvest,
after harvest, as wellasaswell
afteras30
after
and30 60and
days60ofdays of storage.
storage. An-
Analysing
alysing the data obtained from 'Opal' apples treated with EOs at 1 %, no
the data obtained from ‘Opal’ apples treated with EOs at 1%, no statistically significant statistically sig-
nificant difference was observed for the values of total soluble solids, and titratable
difference was observed for the values of total soluble solids, and titratable acidity (p > 0.05) acidity
(p > 0.05)
after after 30atof1 storage
30 of storage at 1 ± 1 °C
± 1 ◦ C compared to compared to the values
the values obtained obtainedapples
for untreated for untreated
(Table 2).
apples (Table 2). A statistically significant difference is observed for apples
A statistically significant difference is observed for apples treated with 1% thyme EO, treated withas1
%
thethyme
latter EO, as the to
are found latter are found
be firmer thantothebe control
firmer than
afterthe control
30 days after 30 at
of storage days
1 ±of1 storage
◦ C. No
at 1 ± 1 °C.
statistical No statistical
difference difference
was observed forwas observed
the values for the values
of firmness, of firmness,
and total and total
soluble solids after
soluble solids after 60 ◦
of storage at 1 ± 1 °C compared to the values obtained
60 of storage at 1 ± 1 C compared to the values obtained for untreated apples (Table 2). for untreated
apples
A (Table 2).
statistically A statistically
significant significant
difference difference
is observed is observed
for apples treatedfor apples
with treatedand
1% thyme with1%1
% thyme and 1 % savoury EOs, compared to the values obtained for the
savoury EOs, compared to the values obtained for the control after 60 of storage at 1 ± 1 C. control after ◦60
of storage at 1 ± 1 °C.
Table 2. Firmness, total soluble solids, and titratable acidity of apples ‘Opal’ treated with essential oil
Table 2. Firmness,
biofumigation and total
storedsoluble
at 1 ± solids, and95%
1 ◦ C with titratable acidity
relative of apples
humidity for 60‘Opal’
days. treated with essential
oil biofumigation and stored at 1 ± 1 °C with 95% relative humidity for 60 days.
Total Soluble
Firmness
Time Point Treatment 2 ] ± SD *
[N/cmFirmness
Total Soluble Titratable
Solids (TSS)
Acidity
Titratable
[%] ± SD *
Time Point Treatment [%] ± SD(TSS)
Solids * Acidity [%] ±
[N/cm 2] ±SD*
± 4.01
At harvest 43.91 [%]±±1.19
14.09 SD* ± 0.06
0.60SD*
a a
At harvest Thymol formulation (1%) 39.33 ± 2.84±ab
43.91 4.01 15.03 ± 0.82
14.09 ± 1.19 0.60± ±0.02
0.42 0.06
Thyme (1%) 40.83 ± 4.52 b ab 15.32 ± 0.85 a a 0.44 ± 0.04 aa
30 days Thymol formulation
Savoury (1%) (1 %)38.06
39.33 ± 2.84
± 3.13 ab 15.03
15.24 ± 0.82
± 1.25 a 0.42±±0.09
0.45 0.02a
30 days Thyme
Basil (1%)(1 %) 40.83
38.38 ± ab
± 1.98 4.52b 15.32
15.30 ± 0.85
± 1.25 a a 0.44±±0.12
0.40 0.04a a
Control (1 %) 34.40 ± 0.88 a 14.54 ± 0.41 a 0.40 ± 0.03 a
Savoury 38.06 ± 3.13ab 15.24 ± 1.25a 0.45 ± 0.09a
Thymol formulation (1%) 34.30 ± 2.66 a 15.12 ± 0.83 a 0.36 ± 0.02 a
Thyme (1%) 38.17 ± 7.66 a 15.33 ± 0.98 a 0.42 ± 0.04 b
60 days Savoury (1%) 34.79 ± 5.10 a 15.38 ± 0.85 a 0.43 ± 0.01 c
Basil (1%) 34.08 ± 4.31 a 15.59 ± 1.36 a 0.35 ± 0.03 a
Control 30.58 ± 4.12 a 15.09 ± 0.89 a 0.36 ± 0.03 a
Each value of firmness, total soluble solids, and titratable acidity is the mean of n = 3 replicates with five fruits.
Values at the same time point, followed by the same letter, are not statistically different in acoordance with Tukey’s
test (p < 0.05). * Values are expressed as a mean of five replicates ± standard deviation (SD).J. Fungi 2023, 9, 22 8 of 18
3.4. Chemical Composition of Essential Oils and Characterization of the Storage Atmosphere
3.4.1. Characterization of Thymol Formulation
The characterization of the atmosphere of the cabinet containing the thymol formula-
tion showed that thymol, the main component of the formulation, was the only volatile
organic compound (VOC) present (Table 3). Except for propylene glycol, the other com-
ponents (74.31%) have a high boiling point and consequently low volatility. The thymol
concentration was 4.02 ppm on the first day of storage and decreased to 0.64 ppm at 60 days
of storage.
Table 3. Composition of thymol formulation and characterization of the atmosphere of cabinet during
the storage trial on apples ‘Opal’ obtained by GC-MS and SPME-GC-MS analysis, respectively. Air in
the cabinet was sampled at 1, 30, and 60 days of storage.
Days of Storage
EO Composition
VOCs 1 Day 30 Days 60 Days
(%)
ppm ± SD *
Thymol 18.81 4.02 ± 0.23 1.39 ± 0.05 0.64 ±0.03
Propylene glycol 6.87
Other compounds 74.32
* Values are expressed as a mean of five replicates ± standard deviation (SD).
3.4.2. Characterization of Thyme Essential Oil (1%)
Air sampling with SPME fibres in the cabinet during storage, where 1% thyme EO
was used, showed that the three most abundant VOCs were thymol, the most abundant
component of thyme EO (Table 4), followed by p-cymene and terpinene. The values of the
three compounds decreased during storage (Table 4): thymol passed from 13.38 ppm at
1 day to 3.85 ppm at 60 days, and during the same period p-cymene moved from 11.4 ppm
to 2.61 ppm and terpinene from 6.16 ppm to 0.38 ppm.
Table 4. Composition of thyme essential oil and characterization of the atmosphere of cabinet during
the storage trial on apples ‘Opal’ obtained by GC-MS and SPME-GC-MS analysis, respectively. Air in
the cabinet was sampled at 1, 30, and 60 days of storage.
Days of Storage
EO Composition
VOCs 1 Day 30 Days 60 Days
(%)
ppm ± SD *
Borneol 1.77 0.00 ± 0.00 1.08 ± 0.19 0.20 ± 0.00
Camphene 0.72 0.00 ± 0.00 0.00 ± 0.00 0.00 ± 0.00
β-Caryophyllene 1.46 4.21 ± 0.52 0.31± 0.12 0.31 ± 0.11
Carvacrol 4.77 0.57 ± 0.18 0.27 ± 0.13 0.21 ± 0.01
Eucalyptol 0.86 0.00 ± 0.00 0.00 ± 0.00 0.00 ± 0.00
Limonene 0.56 0.00 ± 0.00 0.00 ± 0.00 0.00 ± 0.00
Linalool 6.42 2.06 ± 0.12 0.80 ± 0.01 0.00 ± 0.00
O-Methylthymol 0.43 0.00 ± 0.00 0.39 ± 0.10 0.41 ± 0.07
β-Myrcene 1.59 0.00 ± 0.00 0.50 ± 0.05 0.00 ± 0.00
α-Pinene 1.89 1.30 ± 0.01 1.05± 0.02 0.00 ± 0.00
β-Pinene 1.77 1.77 ± 0.01 1.16 ± 0.06 0.00 ± 0.00
p-Cymene 20.39 11.40 ± 1.82 26.24 ± 4.90 2.61 ± 0.18
γ-Terpinene 6.64 6.16 ± 1.03 2.59 ± 0.09 0.38 ± 0.06
Terpinen-4-olo 0.64 0.00 ± 0.00 0.00 ± 0.00 0.00 ± 0.00J. Fungi 2023, 9, 22 9 of 18
Table 4. Cont.
Days of Storage
EO Composition
VOCs 1 Day 30 Days 60 Days
(%)
ppm ± SD *
α-Terpineol 0.50 0.00 ± 0.00 0.00 ± 0.00 0.00 ± 0.00
α-Terpinolene 1.47 0.00 ± 0.00 0.00 ± 0.00 0.00 ± 0.00
Thymol 45.95 13.38 ± 2.20 5.13 ± 0.32 3.85 ± 0.57
α-Thujene 0.56 0.00 ± 0.00 0.00 ±0.00 0.00 ± 0.00
Other compounds 1.61 0.00 ± 0.00 0.00 ± 0.00 0.00 ± 0.00
* Values are expressed as a mean of five replicates ± standard deviation (SD).
3.4.3. Characterization of Savoury Essential Oil (1%)
Gas chromatography coupled with mass spectrometry of savoury EO showed that
the most abundant VOCs were carvacrol, the main component of savoury EO, followed
by p-cymene and γ-terpinene. The concentrations of these three compounds in the cabinet
atmosphere decreased during storage (Table 5): carvacrol passed from 8.64 ppm at day 1,
to 3.34 ppm at day 60. At 30 days, p-cymene showed an increase and then passed from
4.69 ppm (day 1), to 25.04 ppm (day 30), it then decreased to 3.95 ppm at the end of storage
and finally, γ-terpinene passed from 5.34 ppm at day 1 to 0.90 ppm at day 60.
Table 5. Composition of savoury essential oil and characterization of the atmosphere of cabinet
during the storage trial on apples ‘Opal’ obtained by GC-MS and SPME-GC-MS analysis, respectively.
Air in the cabinet was sampled at 1, 30, and 60 days of storage.
Days of Storage
EO Composition
VOCs 1 Day 30 Days 60 Days
(%)
ppm ± SD *
Borneol 0.74 0.00 ± 0.00 1.60 ± 0.03 0.00 ± 0.00
β-Caryophyllene 1.20 0.00 ± 0.00 0.00 ± 0.00 0.00 ± 0.00
Carvacrol 60.33 8.64 ± 0.27 34.28 ± 3.90 3.34 ± 0.30
p-Cymene 17.07 4.69 ± 0.91 25.04 ± 2.76 3.95 ± 0.56
β-Myrcene 1.70 0.27 ± 0.04 0.90 ± 0.08 0.16 ± 0.01
α-Pinene 1.40 0.03 ± 0.00 0.37 ± 0.07 0.00 ± 0.00
β-Pinene 0.60 0.00 ± 0.00 0.00 ± 0.00 0.00 ± 0.00
γ-Terpinene 6.80 5.34 ± 0.42 5.61 ± 0.24 0.90 ± 0.07
Terpinen-4-ol 1.26 0.00 ± 0.00 2.27 ± 0.74 0.26 ± 0.01
α-Terpineol 0.60 0.00 ± 0.00 0.00 ± 0.00 0.00 ± 0.00
Terpinolene 0.72 0.00 ± 0.00 0.00 ± 0.00 0.00 ± 0.00
α-Thujene 0.66 0.00 ± 0.00 0.06 ± 0.00 0.00 ± 0.00
Thymol 5.52 0.31 ± 0.02 1.98 ± 0.13 0.24 ± 0.02
Other compounds 1.40 0.00 ± 0.00 0.00 ± 0.00 0.00 ± 0.00
* Values are expressed as a mean of five replicates ± standard deviation (SD).
3.4.4. Characterization of Basil Essential Oil (1%)
From the SPME-GC-MS analysis of the atmosphere of the cabinets, when apples were
treated with basil EO, the major VOCs released were estragole (the main component of the
basil EO), followed by linalool and α-farnesene (Table 6). Estragole moved from 128.60 ppm
at day 1, to 31.42 ppm at the end of storage. Similarly, linalool moved from 57.76 ppm at
day 1, to 0.66 ppm at day 60. On the contrary, α-farnesene increased over time, with a peakJ. Fungi 2023, 9, 22 10 of 18
at 40 days: it moved from 24.68 ppm at day 1, to 111.44 ppm at day 30, and 31.15 ppm at
the end of storage.
Table 6. Composition of basil essential oil and characterization of the atmosphere of cabinet during
the storage trial on apples ‘Opal’ obtained by GC-MS and SPME-GC-MS analysis, respectively. Air in
the cabinet was sampled at 1, 30, and 60 days of storage.
Days of Storage
EO Composition
VOCs 1 Day 30 Days 60 Days
(%)
ppm ± SD *
p-Anisaldehyde 2.68 0.88 ± 0.02 1.01 ± 0.17 0.49 ± 0.03
t-α-Bergamotene 0.47 6.60 ± 8.63 1.11 ± 0.08 0.49 ± 0.03
α-Bisabolene 1.15 0.00 ± 0.00 0.59 ± 0.06 0.00 ± 0.00
β-Bisabolene 1.23 0.00 ± 0.00 0.27 ± 0.20 0.00 ± 0.00
Borneol 0.54 0.00 ± 0.00 0.00 ±0.00 0.00 ± 0.00
β-Cedrene 0.28 0.00 ± 0.00 0.00 ± 0.00 0.00 ± 0.00
α-Citral 0.16 0.21 ± 0.00 0.00 ± 0.00 0.00 ± 0.00
β-Citral 0.27 0.00 ± 0.00 0.00 ± 0.00 0.00 ± 0.00
Estragole 57.79 128.60 ± 5.53 32.07 ± 1.98 31.42 ± 4.04
α-Farnesene 5.03 24.68 ± 0.34 111.44 ± 14.78 31.15 ± 3.82
Fenchone 5.21 0.00 ± 0.00 0.00 ± 0.00 0.00 ± 0.00
α-Humulene 0.13 0.45 ± 0.06 0.17 ± 0.02 0.48 ± 0.09
Linalool 15.34 57.76 ± 4.36 2.68 ± 3.05 0.66 ± 0.05
cis-Linanool oxide 5.40 0.00 ± 0.00 0.00 ± 0.00 0.36 ± 0.05
Menthol 0.40 0.00 ± 0.00 0.00 ± 0.00 0.00 ± 0.00
Terpinen-4-ol 0.66 0.00 ± 0.00 0.00 ± 0.00 0.00 ± 0.00
α-Terpineol 0.88 0.00 ± 0.00 0.00 ± 0.00 0.00 ± 0.00
Other compounds 2.38 0.00 ± 0.00 0.00 ± 0.00 0.00 ± 0.00
* Values are expressed as a mean of five replicates ± standard deviation (SD).
3.5. Microbial Diversity and Composition
Figure 2A–C show the Shannon Index and number of observed features values based
on tissue, time point, and treatment, respectively. Statistically significant differences
between tissues are present for both considered metrics, with higher values for epiphytic
samples compared to endophytic samples. For a time point, there are no statistically
significant differences in the number of observed features, while the Shannon index shows
statistically lower values for storage and shelf-life, compared to harvest. Finally, there are
no statistically significant differences for both considered metrics when treatment is taken
into account.
Similarly, Figure 3A–C are Principal Coordinates Analysis (PCoA) plots based on
Bray-Curtis dissimilarity index values for tissue, time point, and treatment, respectively.
Samples from different tissues cluster apart from each other, while samples from different
treatments and different time points cluster together.
PERMANOVA results on the same data are shown in Table 7. Tissue is the factor
associated with the highest explained variance (13%), followed by the sampling time point
(8%) and treatment (6.5%). Overall, considered parameters and their interactions are shown
to explain little more than 40% of the total variance.J. Fungi 2022, 8, x FOR PEER REVIEW 11 of 20
J. Fungi 2023, 9, 22 11 of 18
there are no statistically significant differences for both considered metrics when treat-
ment is taken into account.
Figure2.2.Box
Figure Boxand
andwhisker
whiskerplot
plotfor
forthe
thevalues
valuesof
ofthe
theShannon
Shannonindexindex(left)
(left)and
andnumber
numberof ofobserved
observed
features (right),
features (right), with
with samples
samples grouped
grouped according
according to
to tissue
tissue (A),
(A), time
time point
point (B),
(B), and
and treatment
treatment (C).
(C).
Upper and lower box bounds are associated with the 75 th and 25th percentile of the distribution,
Upper and lower box bounds are associated with the 75th and 25th percentile of the distribution,
while upper and lower whisker are associated with the 91st and 9th percentile of the distribution,
while upper and lower whisker are associated with the 91st and 9th percentile of the distribution,
respectively. For each metric, different letters indicate statistically significant differences between
respectively. For each metric, different letters indicate statistically significant differences between
groups (p < 0.05).
groups (p < 0.05).
Similarly, Figures 3A, 3B, and 3C are Principal Coordinates Analysis (PCoA) plots
Table 7. PERMANOVA analysis results for fungi. The R2 value indicates the total variance fraction
based on Bray-Curtis dissimilarity index values for tissue, time point, and treatment, re-
explained by the parameter or combination of parameters, while Pr (>F) is the FDR-adjusted p-value
spectively. Samples from different tissues cluster apart from each other, while samples
using the Benjamini-Hochberg method. For significance levels, ** = p < 0.01, *** = p < 0.001, and
from different treatments and different time points cluster together.
n.s. = not significant.
Parameter R2 Pr (>F)
Sampling time point 0.081 ***
Treatment 0.066 ***
Tissue 0.135 ***
Botrytis inoculum 0.029 ***
Sampling time point × Treatment 0.030 **
Sampling time point × Botrytis inoculum 0.009 n.s.
Sampling time point × Tissue 0.040 **
Treatment × Tissue 0.035 ***
Botrytis inoculum × Tissue 0.009 n.s.
Sampling time point × Treatment × Tissue 0.016 n.s.
Sampling time point × Botrytis inoculum × Tissue 0.008 n.s.
Residuals 0.541 /
Total 1.000 /
Composition data for epiphytic and endophytic samples are shown in Figure 4. In
endophytic populations, the most abundant clade at harvest consists of unknown Cer-
aceosorales (35%), which are not encountered in the subsequent time points. In samples
inoculated with Botrytis cinerea, the genus Botrytis showed an appreciable presence after
storage (6.5%) and shelf-life (36.5%) only in the absence of treatment. The genus OculimaculaJ. Fungi 2023, 9, 22 12 of 18
is the most abundant (28.5%) clade in inoculated samples treated with thyme oil at the
end of storage, whereas it is the second most abundant (20.6%) clade after shelf-life, just
behind the genus Penicillium (21%). Inoculated samples treated with pyrimethanil have
Alternaria as the predominant genus (18.3%) during storage, while during shelf-life the
genus Penicillium becomes predominant (16.5%). The genera Alternaria, Cladosporium, and
Vishniacozyma appear in all samples, albeit with a variable presence. Other notable genera
include Fusarium, which has a significant presence (4.9%) during storage in inoculated
J. Fungi 2022, 8, x FOR PEER REVIEW 12 of 20
samples treated with pyrimethanil, and Neofabraea, which has a significant presence in
particular in inoculated control samples after shelf-life (19%).
Figure3.3.PCoA
Figure PCoAanalysis
analysisofofBray-Curtis
Bray-Curtisdissimilarity index
dissimilarity results,
index based
results, on tissue
based (A), (A),
on tissue timetime
pointpoint
(B),
(B), treatment
and and treatment
(C). (C).
In epiphytic populations,
PERMANOVA results onthe thetaxonomical composition
same data are appears
shown in Table more diverse
7. Tissue com-
is the factor
pared to the endophytic samples. Yeast genus Vishniacozyma is the main component
associated with the highest explained variance (13 %), followed by the sampling time in all
storage and shelf-life groups, with the exception of samples inoculated with B.
point (8 %) and treatment (6.5 %). Overall, considered parameters and their interactionscinerea and
treated withtothyme
are shown explain Botrytis
oil.little moredevelopment
than 40 % ofduring storage
the total can be observed in inoculated
variance.
samples, both untreated (6.5%) and treated with thyme oil (4.5%), while it is almost absent
Table 7. PERMANOVA analysis results for fungi. The R2 value indicates the total variance fraction
explained by the parameter or combination of parameters, while Pr ( > F) is the FDR-adjusted p-
value using the Benjamini-Hochberg method. For significance levels, ** = p < 0.01, *** = p< 0.001, and
n.s. = not significant.J. Fungi 2023, 9, 22 13 of 18
J. Fungi 2022, 8, x FOR PEER REVIEW 14 of 20
in chemically treated samples (0.6%). In shelf-life samples, Botrytis species maintain a
similar presence in untreated samples (7%), but not in thyme-oil treated samples, where
Penicillium becomes the main genus (18.6%).
Figure 4. Taxa composition of epiphytic and endophytic fungal communities. The “Other” category
Figure 4. Taxa
includes composition
all taxa with less of epiphytic
than and presence
1% relative endophytic fungal
in all communities.
considered groups.The “Other” category
includes all taxa with less than 1% relative presence in all considered groups.
4. Discussion
InWe
epiphytic
assayedpopulations, the taxonomical
the effect of biofumigation composition
with EOs againstappears more
Botrytis diverse
cinerea com-
in vitro and
pared to the
in vivo. Allendophytic samples.savoury,
three EOs (thyme, Yeast genus Vishniacozyma
and basil) is the main
and the thymol component
formulation in all
used at a
storage and shelf-life groups, with the exception of samples inoculated with B. cinerea and
treated with thyme oil. Botrytis development during storage can be observed in inoculatedJ. Fungi 2023, 9, 22 14 of 18
concentration of 1% and thyme and savoury EOs at 0.5%, were effective in inhibiting the
growth of B. cinerea in vitro. Similarly, in a previous study [41], the EO of Ocinum basilicum
and Thymus kotschyanus, used by spray application showed a high inhibitory effect on the
mycelial growth of B. cinerea and p. expansum in pears. Our results are in agreement with
other studies about the use of biofumigation with thyme and savoury EOs in the control
of different pathogens including B. cinerea and Colletotrichum gloeosporioides [17]. The use
of thyme EO applied by direct contact against B. cinerea and Penicillium species provided
a complete inhibition of the growth of both pathogens [42,43]. The antifungal activity of
essential oils of Thymus species has therefore been reported as suitable for applications in
the food industry [41,44,45].
Given the efficacy of EOs observed in vitro, whether similar efficacy could be obtained
by fumigation with EOs of cold-stored apples was investigated. EO of thyme, savoury, and
thymol formulation used at 1% concentration showed significant grey mould control after
60 days of storage at 1 ± 1 ◦ C. The efficacy of biofumigation with thyme and savoury EOs
was previously reported on apples cv. Red Fuji [8]. Thyme and savoury EOs, and their
major components thymol and carvacrol, previously showed antifungal activity against
B. cinerea [8,46]. These oils and their main components also controlled other pathogens,
such as Monilinia fructicola on apricots and plums [47], or peaches and nectarines [11], and
p. expansum on pears [41]. Essential oils of Thymus species and Mentha species and their
components had much higher antifungal activity than the fungicide bifonazole, as shown
in previous studies [20]. In our experiment, the use of 1% basil EO was not effective in
controlling grey mould of apples at the end of storage, unlike previous studies [48,49] that
showed that spray application of basil EO was effective on apples.
To assess the impact of treatments on apple quality, analyses of firmness, total soluble
solids, and titratable acidity parameters were performed. Apples treated with 1% thyme EO
were firmer than the control after 30 days of storage at 1 ± 1 ◦ C. A statistically significant
difference was observed for apples treated with 1% thyme and 1% savoury EOs, compared
to the values obtained for the control after 60 of storage at 1 ± 1 ◦ C. These results are
in partial agreement with what was observed on pears treated with thyme, basil, and
rosemary EOs by spraying, where no effects were observed on weight loss, pH, and total
soluble solids, while differences were reported on taste and firmness [41]. The firmness
was reduced by Thymus kotschyanus (thyme) EO, whereas basil (O. basilicum) EO slowed
the softening process. A decrease in firmness is likewise reported by spraying celery, basil,
and rosemary EOs [49]. It should be emphasised that in our experiments EOs were applied
by biofumigation, as in Santoro et al. [11], who demonstrated that thyme and savoury EO
vapours on peaches and nectarines did not influence the fruit quality, but in fact showed a
positive effect in reducing weight loss.
During in vivo experiments, sampling of the atmosphere inside the cabinets was
performed to characterize and quantify the volatile components of the oils released through
biofumigation. Analysis of the chromatographic profiles showed that thymol and carvacrol,
which have antimicrobial activity against several pathogens [44,45,50,51], were present in
thyme EO. The existence of different taxonomic chemotypes of Thymus essential oils should
be highlighted, as they may have different biological properties: antifungal, antioxidant,
and antimicrobial [41,44,45,50,52]. Though p-cymene was one of the main components
of thyme EO, it does not have specific antimicrobial properties [53]. Previous studies on
the constituents of thyme EOs showed that carvacrol has the highest antimicrobial and
antifungal activity [20,44]. The high effectiveness of carvacrol in reducing the growth
of B. cinerea in vitro and in vivo in grapes was demonstrated by Martínez-Romero and
colleagues [51]. The antifungal activity of the thyme EO tested was mainly given by thymol,
as carvacrol was present at a very low percentage, throughout the storage and shelf life of
the apples.
Carvacrol, thymol, terpinen-4-ol, and linalool determine the antifungal activity in
savoury EO [54]. In our savoury EO, carvacrol and p-cymene were the main components,J. Fungi 2023, 9, 22 15 of 18
whereas Santoro and colleagues [11] who also tested the efficacy of savoury EO, showed
that the main compounds detected were linalool and carvacrol.
The gas chromatographic analysis showed the basil EO releases mainly linalool [41].
Linalool, along with estragole, determines the antimicrobial properties of basil EO [55]. Al-
though the percentages of linalool and estragole present in the basil EO were high—15.34%
and 57.79%, respectively—the treatments carried out in our experiments were ineffective.
As for the thymol formulation, a reduction of thymol abundance was observed as time
increased. The decrease of thymol also permitted maintenance of a certain level of efficacy
of the treatment against grey mould in shelf-life, though the apples were no longer in a
closed environment.
In addition to EOs’ efficacy against B. cinerea, the effect on the fungal microbiome
composition was also investigated. Fruits treated with thyme oil were compared to both
fruits treated with pyrimethanil and control fruits. By considering sampling time point,
treatment, and tissue, no parameter or combination of parameters showed a predominant
role in explaining total variance. Tissue had the highest influence among all considered
factors, which is mirrored by a clean compositional clustering of epiphytic and endophytic
samples. Epiphytic samples showed both higher richness and higher evenness compared
to their endophytic counterparts. Host plants were shown actively shaping the endophytic
communities of their fruits [56], which, combined with the low oxygen levels [57] and
higher sugar content [58] of the subepidermal region, could result in the selection of smaller
fungal populations.
Regarding the time point, harvest samples were compositionally different from both
storage and shelf-life samples, which is in accordance with previous studies [59,60]. Based
on alpha diversity analyses, harvest samples had higher evenness compared to storage and
shelf-life samples, but shared the same richness, indicating that—in a context of similar
number of taxa-some taxa start to prevail in storage and later in shelf-life. This dynamic
has been observed in other studies, as a result of both storage time and temperature [61].
In contrast to both tissue and time point, the treatments did not show any effect on sample
composition and did not seem to affect either sample richness or evenness. Despite
this, compositional data of our samples do suggest that treatments affect at least some
postharvest rot genera. In particular, as observed by Banani and colleagues [8], treatments
with thyme oil and a chemical fungicide also result in a lower abundance of B. cinerea
compared to untreated samples. At the same time, Penicillium species was not negatively
affected by thyme oil or chemical fungicide treatments, but on the contrary, it increased.
Penicillium species Was previously demonstrated to be tolerant to thyme oil treatments [20]
and some strains are resistant to fungicides [62]. It is thus reasonable to assume that in the
presence of these treatments, Penicillium species grew by occupying the ecological niche
left by other fungal genera.
5. Conclusions
Essential oils of thyme and savoury and the thymol formulation are promising for
the control of postharvest diseases in apples, showing potential for developing low envi-
ronmental impact fungicides to be used in sustainable agriculture. We can hypothesize
a similar efficacy obtained for ’Opal’ on other apple cultivars. It could be interesting to
test different concentrations of oils and to verify the continuous effectiveness of the oils
assuming a replacement of the Petri dishes after 30 days of storage to keep the level of
volatile organic compounds with antifungal activity. Moreover, we would also like to test
the effect of EO biofumigation over longer periods of time, in order to more closely match
commercial practises, where apple fruit can remain in cold storage up to 9 months. The
development of a slow-release formulation of essential oils should be targeted to favour a
constant control of fungal diseases.J. Fungi 2023, 9, 22 16 of 18
Author Contributions: Conceptualization, G.S., S.P. and D.S.; Data curation, G.S., M.G., S.P. and
D.S.; Formal analysis, G.S., S.P., G.R.M. and F.B.; Funding acquisition, D.S.; Investigation, G.S.,
G.R.M. and F.B.; Methodology, G.S., M.G., S.P. and D.S.; Project administration, D.S.; Software, M.G.;
Supervision, S.P. and D.S.; Validation, G.S., M.G. and S.P.; Writing—original draft, G.S., M.G. and
F.B.; Writing—review & editing, M.G., S.P., F.B. and D.S. All authors have read and agreed to the
published version of the manuscript.
Funding: The Authors wish to thank Fondazione Cassa di Risparmio di Cuneo for funding the project
“SMART APPLE—Innovative and SMART technologies for sustainable APPLE production” and PRIMA,
a program supported by the European Union, for funding the project “StopMedWaste—Innovative
Sustainable technologies TO extend the shelf-life of Perishable MEDiterranean fresh fruit, vegetables
and aromatic plants and to reduce WASTE”. The authors wish to also thank the Euphresco project
“BasicS—Basic substances as an environmentally friendly alternative to synthetic pesticides for plant
protection (Objective 2020-C-353)”.
Institutional Review Board Statement: Not applicable.
Informed Consent Statement: Not applicable.
Conflicts of Interest: The authors declare no conflict of interest.
References
1. Feliciano, R.P.; Antunes, C.; Ramos, A.; Serra, A.T.; Figueira, M.E.; Duarte, C.M.; de Carvalho, M.R.A.; Bronze, M.R. Characteriza-
tion of traditional and exotic apple varieties from Portugal. Part 1–Nutritional, phytochemical and sensory evaluation. J. Funct.
Foods 2010, 2, 35–45. [CrossRef]
2. Guo, S.; Guan, L.; Cao, Y.; Li, C.; Chen, J.; Li, J.; Liu, G.; Li, S.; Wu, B. Diversity of Polyphenols in the Peel of Apple (Malus Sp.)
Germplasm from Different Countries of Origin. Int. J. Food Sci. Technol. 2016, 51, 222–230. [CrossRef]
3. Spadaro, D.; Torres, R.; Errampalli, D.; Everett, K.; Ramos, L.; Mari, M. Postharvest Diseases of Pome Fruit. In Postharvest Pathology
of Fresh Horticultural Produce; Palou, L., Smilanick, J.L., Eds.; CRC Press: Boca Raton, FL, USA, 2019; pp. 55–109.
4. García-Parra, J.; González-Cebrino, F.; Delgado, J.; Lozano, M.; Hernández, T.; Ramírez, R. Effect of thermal and high-pressure
processing on the nutritional value and quality attributes of a nectarine purée with industrial origin during the refrigerated
storage. J. Food Sci. 2011, 76, C618–C625. [CrossRef] [PubMed]
5. Romanazzi, G.; Orçonneau, Y.; Moumni, M.; Davillerd, Y.; Marchand, P.A. Basic Substances, a Sustainable Tool to Complement
and Eventually Replace Synthetic Pesticides in the Management of Pre and Postharvest Diseases: Reviewed Instructions for
Users. Molecules 2022, 27, 3484. [CrossRef]
6. Casals, C.; Teixidó, N.; Viñas, I.; Silvera, E.; Lamarca, N.; Usall, J. Combination of hot water, Bacillus subtilis CPA-8 and sodium
bicarbonate treatments to control postharvest brown rot on peaches and nectarines. Eur. J. Plant Pathol. 2010, 128, 51–63.
[CrossRef]
7. Lahlali, R.; Serrhini, M.N.; Friel, D.; Jijakli, M.H. Predictive modelling of temperature and water activity (solutes) on the in vitro
radial growth of Botrytis cinerea Pers. Int. J. Food Microbiol. 2007, 114, 1–9. [CrossRef]
8. Banani, H.; Garibaldi, A.; Gullino, M.L.; Olivieri, L.; Santoro, K.; Spadaro, D. Thyme and savory essential oil efficacy and
induction of resistance against Botrytis cinerea through priming of defense responses in apple. Foods 2018, 7, 11. [CrossRef]
9. Lopez-Reyes, J.G.; Spadaro, D.; Prelle, A.; Garibaldi, A.; Gullino, M.L. Efficacy of plant essential oils on postharvest control of rots
caused by fungi on different stone fruits in vivo. J. Food Prot. 2013, 76, 631–639. [CrossRef]
10. Servili, A.; Feliziani, E.; Romanazzi, G. Exposure to volatiles of essential oils alone or under hypobaric treatment to control
postharvest gray mold of table grapes. Postharvest Biol. Technol. 2017, 133, 36–40. [CrossRef]
11. Santoro, K.; Meghenzani, M.; Chiabrando, V.; Bosio, P.; Gullino, M.L.; Spadaro, D.; Giacalone, G. Thyme and savory essential oil
vapor treatments control brown rot and improve the storage quality of peaches and nectarines but could favor gray mold. Foods
2018, 7, 7. [CrossRef]
12. El Ouadi, Y.; Manssouri, M.; Bouyanzer, A.; Majidi, L.; Bendaif, H.; Elmsellem, H.; Shariati, M.A.; Melhaoui, A.; Hammouti, B.
Essential oil composition and antifungal activity of Melissa officinalis originating from north-Est Morocco, against postharvest
phytopathogenic fungi in apples. Microb. Pathog. 2017, 107, 321–326. [CrossRef] [PubMed]
13. Vieira, A.M.F.D.; Steffens, C.A.; Argenta, L.C.; Amarante, C.V.T.D.; Oster, A.H.; Casa, R.T.; Amarante, A.G.M.; Espíndola, B.P.
Essential oils for the postharvest control of blue mold and quality of ’Fuji’ apples. Pesqui. Agropecu. Bras. 2018, 53, 547–556.
[CrossRef]
14. Xylia, P.; Chrysargyris, A.; Ahmed, Z.F.R.; Tzortzakis, N. Application of Rosemary and Eucalyptus Essential Oils and Their Main
Component on the Preservation of Apple and Pear Fruits. Horticulturae 2021, 7, 479. [CrossRef]
15. Mbili, N.C.; Opara, U.L.; Lennox, C.L.; Vries, F.A. Citrus and lemongrass essential oils inhibit Botrytis cinerea on ‘Golden
Delicious’, ‘Pink Lady’ and ‘Granny Smith’ apples. J. Plant Dis. Prot. 2017, 124, 499–511. [CrossRef]
16. Šernaitė, L.; Rasiukevičiūtė, N.; Valiuškaitė, A. Application of plant extracts to control postharvest gray mold and susceptibility
of apple fruits to B. cinerea from different plant hosts. Foods 2020, 9, 1430. [CrossRef]You can also read