Experimental evaluation of the impact of a payment for environmental services program on deforestation
←
→
Page content transcription
If your browser does not render page correctly, please read the page content below

Received: 10 September 2018        Revised: 29 November 2018       Accepted: 3 December 2018
DOI: 10.1002/csp2.8

CONTRIBUTED PAPER

Experimental evaluation of the impact of a payment for
environmental services program on deforestation
Emma Wiik1 | Rémi d’Annunzio2 | Edwin Pynegar1 | David Crespo3 | Nigel Asquith4,5 |
Julia P. G. Jones1

1
 School of Environment, Natural Resources and
Geography, Bangor University, Bangor, UK                 Despite calls for greater use of randomized control trials (RCTs) to evaluate the
2
Forestry Department, FAO, Rome, Italy                    impact of conservation interventions; such experimental evaluations remain
3
Independent                                              extremely rare. Payments for environmental services (PES) are widely used to slow
4
 Charles Bullard Fellowship Program, Harvard             tropical deforestation but there is widespread recognition of the need for better evi-
Forest, Harvard University, Petersham,                   dence of effectiveness. A Bolivian nongovernmental organization took the unusual
Massachusetts
                                                         step of randomizing the communities where its conservation incentive program
5
 Sustainability Science Program, Harvard
                                                         (Watershared) was offered. We explore the impact of the program on deforestation
Kennedy School, Harvard University, Cambridge,
Massachusetts                                            over 5 years by applying generalized additive models to Global Forest Change
Correspondence                                           (GFC) data. The “intention-to-treat” model (where units are analyzed as random-
Julia P. G. Jones, School of Environment, Natural        ized regardless of whether the intervention was delivered as planned) shows no
Resources and Geography, Bangor University,              effect; deforestation did not differ between the control and treatment communities.
Bangor, UK.
Email: julia.jones@bangor.ac.uk
                                                         However, uptake of the intervention varied across communities so we also
Funding information
                                                         explored whether higher uptake might reduce deforestation. We found evidence of
Leverhulme Trust, Grant/Award Number: RPG-               a small effect at high uptake but the result should be treated with caution. RCTs
2014-056 ; Natural Environment Research                  will not always be appropriate for evaluating conservation interventions due to eth-
Council, Grant/Award Number: NE/鳯L001470/鳯1
                                                         ical and practical considerations. Despite these challenges, randomization can
                                                         improve causal inference and deserves more attention from those interested in
                                                         improving the evidence base for conservation.

                                                         KEYWORDS

                                                         deforestation, effectiveness, efficacy, experimental evaluation, forest
                                                         conservation, impact evaluation, intention-to-treat, land use change, payments for
                                                         ecosystem services, PES

1 | INTRODUCTION                                                                          Pattanayak, 2006), there are a rapidly growing number of
                                                                                          robust conservation impact evaluations. Impact evaluation
Following calls for improvements in the quality of evidence                               seeks to establish the extent to which an outcome can be
underpinning conservation interventions (Ferraro &                                        attributed to the intervention itself, rather than to confound-
                                                                                          ing factors (Baylis et al., 2016; Ferraro & Hanauer, 2014).
Data accessibility: Data and code to reproduce analysis in this paper are
available here: doi.org/10.6084/m9.figshare.7418264. The full details of a                Careful statistical analysis is increasingly used for construct-
baseline and endline social survey of participants and non-participants in                ing counterfactuals (what would have happened in the
Watershared from control and treatment communities (a small amount of
                                                                                          absence of the intervention). For example, statistical match-
data from this is used in the paper) is publically archived (Bottazzi
et al., 2017).                                                                            ing is now quite widely used (e.g., Eklund et al., 2016;

This is an open access article under the terms of the Creative Commons Attribution License, which permits use, distribution and reproduction in any medium,
provided the original work is properly cited.
© 2019 The Authors. Conservation Science and Practice published by Wiley Periodicals, Inc. on behalf of Society for Conservation Biology
Conservation Science and Practice. 2019;e8.                                                                                 wileyonlinelibrary.com/journal/csp2   1 of 11
https://doi.org/10.1002/csp2.8
2 of 11                                                                                                                  WIIK ET AL.

Rasolofoson, Ferraro, Jenkins, & Jones, 2015; Sills et al.,       et al., 2012, Samii et al., 2014), approaches such as statistical
2017) while other quasi-experimental methods which require        matching have been quite widely used to evaluate deforesta-
particular conditions such as instrumental variables (Sims,       tion impacts for example in Costa-Rica (Robalino & Pfaff,
2010) or regression discontinuity (Alix-Garcia, Mcintosh,         2013) and Cambodia (Clements & Milner-Gulland, 2015).
Sims, & Welch, 2013), have spread more slowly. Random-            Regression discontinuity was recently used to evaluate the
ized control trials (RCTs) where units are experimentally         impact of payments on land management actions in Mexico
allocated to treatment or control reduce the influence of con-    (Alix-Garcia et al., 2018). The only RCT to evaluate PES
founding factors (Ferraro & Hanauer, 2014) and therefore, at      (Jayachandran et al., 2017) suggested—for high forest pres-
least in theory, greatly improve the quality of causal infer-     sure, low opportunity cost, and the requirement to enroll all
ence. RCTs at the field scale have been the mainstay of           of one's forest land—that a PES scheme in Uganda cost-
applied ecology for decades, however are vanishingly rare at      effectively reduced deforestation over a two-year period.
the landscape scale despite calls for wider use (Ferraro,         Given the heterogeneity of PES impacts across varied set-
2011; Miteva, Pattanayak, & Ferraro, 2012; Pattanayak,            tings, and few evaluations relative to the exploding number
Wunder, & Ferraro, 2010; Samii, Lisiecki, Kulkarni, Paler, &      of programs (Salzman, Bennett, Carroll, Goldstein, & Jen-
Chavis, 2014).                                                    kins, 2018), more such RCTs would be valuable.
    The rarity of RCT in evaluating the impact of large-scale         In 2010, the Bolivian nongovernmental organization
conservation interventions can be attributed to the numerous      Fundación Natura Bolivia (Natura) and five municipal gov-
practical and ethical considerations involved (Baylis et al.,     ernments initiated an RCT of their conservation incentive
2016; Pynegar, Jones, Gibbons, & Asquith, 2018). One of           program known as Watershared (Pynegar et al., 2018).
these is scale itself: it clearly would not be feasible to ran-   Watershared makes in-kind compensations to incentivize
domly allocate Protected Areas in a landscape. Furthermore,       landowners to cease deforestation and cattle grazing on
despite the enthusiasm with which RCTs have been pro-             enrolled parcels. A total of 129 communities were randomly
moted in some fields such as development economics, inter-        allocated to treatment or control (offered agreements or not).
pretation is not always simple and randomization does not         We investigate the effectiveness and efficacy of Water-
relieve one of the needs to consider covariates and con-          shared at reducing deforestation, over 5 years, by applying
founding factors (Deaton & Cartwright, 2018). Finally,            generalized additive models (GAMs) to global forest change
RCTs require involvement of researchers throughout the            (GFC) data (Hansen et al., 2013). We undertake a standard
implementation phase; they cannot be conducted post-hoc.          ITT evaluation to explore effectiveness at the level of ran-
All are likely to be important reasons for the limited number     domization regardless of uptake of Watershared agreements
of RCTs evaluating large-scale conservation interventions.        in individual communities. We further quantify efficacy by
    A useful distinction in any impact evaluation is between      evaluating the effect of uptake on deforestation (c.f. “as-trea-
“effectiveness” and “efficacy” (how interventions work in         ted” analysis). Throughout, we control for factors that can
real-world practice versus under ideal implementation;            relate to both uptake and deforestation, including propensity
Pullin & Knight, 2001). Effectiveness may be low not              to enroll (endogeneity), and consider the potential influence
because the intervention lacks efficacy but because imple-        of unobserved confounding factors.
mentation, uptake and adherence are imperfect
(Glennerster & Takavarasha, 2013). When analyzing RCTs,
                                                                  2 | METHODS
including the outcomes for individuals as randomized in
“intention-to-treat” (ITT) estimates is widely considered
most appropriate for evaluating real world effectiveness          2.1 | Study context
(Gupta, 2011). Where uptake is incomplete, examining out-         Since 2003, Natura's Watershared program in the Bolivian
comes according to uptake and adherence can be informa-           Andes has used in-kind incentives to encourage land owners
tive, especially for exploring the potential efficacy of new      to conserve forests, to preserve exceptional biodiversity,
approaches (Glennerster & Takavarasha, 2013; Ten Have             store carbon, and ensure locally valued ecosystem services
et al., 2008). For example an “as-treated” impact estimate        (Asquith, 2016). Watershared is not a PES scheme accord-
(where units are analyzed as they were treated rather than as     ing to the original definition involving buyers and sellers of
they were randomized) can be useful (McNamee, 2009).              services (Wunder, 2007), however it does involve “voluntary
    Payments for environmental services (PES, also known          transactions between service users and service providers that
as Payments for Ecosystem Services; Wunder, 2015), which          are conditional on agreed rules of natural resource manage-
incentivize land managers to provide ecosystem services,          ment for generating offsite services” (Wunder, 2015). There-
have been promoted to slow tropical deforestation since the       fore the Watershared scheme is relevant to those interested
late 1990s (Landell-Mills & Porras, 2002; Sánchez-Azofeifa,       in the design of conservation incentive schemes such as
Pfaff, Robalino, & Boomhower, 2007). While strong evi-            PES. In exchange for enrolling parcels of land in Water-
dence on PES impacts is limited (Börner et al., 2017; Miteva      shared agreements, farmers receive varied forms of support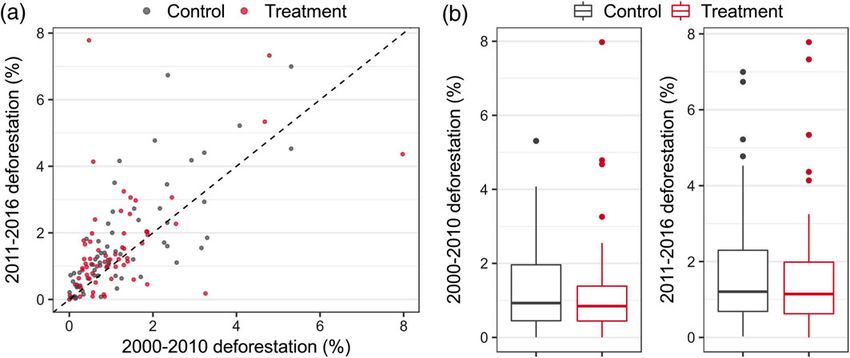
WIIK ET AL. 3 of 11
(including fruit trees, bee boxes, irrigation material and The randomization was consented to by municipal
barbed wire) to help shift away from swidden agriculture leaders on the grounds that the program would subse-
and improve livestock management (Bottazzi, Wiik, Cre- quently be implemented in all communities (this
spo, & Jones, 2018). More than 210,000 ha belonging to occurred in 2016 and the program now runs in both treat-
4,500 families are under agreements (Asquith, 2016). ment and control communities). Watershared agreements
The study region: The Río Grande Valles Cruceños Nat- were offered to households in treatment communities.
ural Integrated Management Area (Spanish acronym ANMI) There were three levels of agreement with slightly differ-
is a 734,000-ha protected area in the Santa Cruz valleys of ent conditions and incentives (SI 2). For example, the
Bolivia, created in 2007 (Figure 1a). There are regional dif- strictest level (level 1) only applied to forest within
ferences in rainfall which contribute to the existence of five 100 m of a stream and cattle had to be excluded as well
ecoregions which we simplified to three (Appendix S1, Sup- as deforestation stopped. The other two levels did not
porting Information): Tucuman-Bolivian Forest; Chaco; and require cattle exclusion (SI 2). While the analysis look-
the dry valleys. The area is home to approximately 20,000 ing at the impact of Watershared on water quality
people scattered across small towns and hamlets. Most peo- (Pynegar et al., 2018), considered only level 1 agree-
ple farm using a mixed system of staple crops including ments, in this paper investigating the impact of Water-
maize and potato, small-scale vegetable cultivation, and live- shared on deforestation we include all levels.
stock rearing. Cattle are grazed in the forests for at least part Compliance for level 1 and 2 agreements was monitored
of each year. annually by Natura technicians walking transects within
RCT: In 2010 Natura, motivated by a desire to know if the parcels under agreement. Level 3 agreements did not
their intervention was effective, decided to roll out Water- receive active monitoring. In cases of gross noncompli-
shared in 129 communities in the ANMI as an RCT to facili- ance, in-kind incentives (such as irrigation tubing or bee
tate impact evaluation (Pynegar et al., 2018). Following hives) have been redistributed to the community. As with
baseline data collection, including a socioeconomic survey many such schemes, not all land enrolled represented
(Bottazzi et al., 2017), communities were randomly allocated additional conservation (additionality was ca. 13%; Bot-
to control (n = 64) or treatment (n = 65), stratified by cattle tazzi et al., 2018) and there were barriers to entry leading
ownership and population density. However, when our team to higher uptake by households with formal land title,
later constructed community boundaries using national data larger homes, cattle, and stronger social connections
(National Institute of Agrarian Reform) and field validation (Grillos, 2017). Uptake (percentage of a community area
we found that two neighboring control communities were in under Watershared agreements) was highly variable
practice considered as one and did not have separate bound- across the treated communities (Figure 1b), varying from
aries. Thus, we examine 128 communities (control n = 63 3 to 80% (median = 14%).
and treatment n = 65).
(a) Control ● Treatment (b)
Control Treatment
Uptake (%)
0 20 40 60 80 Uptake (%)
10
15
20
25
30
35
40
45
50
55
60
65
70
75
80
0
5
N
●
●
●
●
●
55
50
●
●
●
●
45
●
●
● ●
●
●
40
Community count
●
● ● ●
●
●
●
●
●
●
35
●
●
30
● ●
●
●
● ●
● ●
25
● ●
● ● ●
● ●
●
●
20
● ● ● ●
●
●
● ●
15
● ●
●
●
●
● ● ●
●
10
●
● ●
●
5
0km 25km 50km 0
FIGURE 1 (a) Map of study area (the Río Grande Valles Cruceños Natural Integrated Management Area, Spanish acronym: ANMI) showing the uptake of
the intervention (as % of community surface area). (b) The distribution of uptake between control (n = 63) and treatment (n = 65) communities4 of 11 WIIK ET AL.
Consent to randomization was granted by community controlled for factors that might influence both participation
leaders in the area on the understanding that the intervention and the outcome as much as possible by controlling for
would subsequently be implemented in all communities (this uptake propensity (see below). Second, owing to this varia-
general roll-out was conducted in 2016). The consent forms tion in uptake, there is a distinct difference between the ran-
used in baseline and endline are archived alongside the data domization, which is binary (control/treatment), and the
(Bottazzi et al., 2017). The endline social survey data used intervention, which is continuous (% area under agreements).
in part of this analysis was assessed under the Bangor Uni- We therefore have two models: an ITT model evaluating the
versity Research Ethics Framework. effectiveness of Watershared as-implemented and a “contin-
uous-treatment” (CT) model to explore the potential effi-
2.2 | Deforestation data and data validation cacy. Third, due to implementation error, a few households
Deforestation data were extracted from the GFC product living in treatment communities enrolled land they own in
(Hansen et al., 2013) that provides spatially explicit tree- control communities. Therefore there were control commu-
cover percentage for 2000 and annual tree-cover change for nities with enrolled land (see Figure 1b). We included all
2000 to 2016. Thus, “Treecover2000” and “lossyear” layers communities in our analysis despite this contamination of
were downloaded for tile 10S_070W and projected into the control, accepting that it may introduce noise.
UTM zone 20S. A threshold of 30% of tree cover was
applied to generate a Forest/Non-Forest mask and then 2.3.2 | Modeling the propensity for uptake of Watershared
applied to the lossyear layer to select loss occurring on that agreements
mask only. The layers were combined into a deforestation We modeled uptake propensity by regressing % land area
map, with the resulting pixels classified into four groups: enrolled in a treatment community against socioeconomic
Forest stable; Non-Forest stable; Loss in the baseline period predictors aggregated to community scale as means (We also
(2000–2010); Loss in the RCT period (2011–2016). This tested a model using medians, which explained 10% less var-
map was validated following (Olofsson et al., 2014) using iation; this is not shown). We selected predictors based on
visual checks on a stratified random sample of 426 points an analysis of household-level participation (Grillos, 2017),
(see SI 3). Twenty-two points were excluded as poor-quality derived from a baseline survey by Natura in 2010 in all
time series imagery made validation impossible. Accuracy communities (Bottazzi et al., 2017). The predictors were:
of the remaining points (n = 404) was 94% (Table S3.1) wealth (land, cattle available); education of household head
with user's accuracy ranging from 63% (for the loss in the (years); social embeddedness (generations a household has
RCT period) to 97% (stable forest). been present, frequency of involvement in community
Spatial data processing (all code is available at https:// work); environmental attitudes (perceptions of forest value
github.com/lecrabe/res2_bolivia_rct) was implemented and local water quality); and remoteness (travel time to the
through R (R Core Team, 2017), OFGT (http://www. nearest market—see SI 4 for more details). We used the pre-
openforis.org/tools), and the GDAL library (http://www. dictions to create a propensity score for treatment and con-
gdal.org/). Accuracy assessment components (SI 3) were trol communities, and used this score as a control variable in
developed using dedicated tools (Olofsson et al., 2014). our deforestation analysis. One community which lacked
baseline socioeconomic data and therefore a propensity
2.3 | Statistical analysis score, had to be discarded from the analysis.
2.3.1 | Analytical approach An important assumption in our deforestation models is
Although Watershared agreements are individual (a farmer that deviation from uptake propensity (i.e., uptake that can-
will agree to enroll land or not), our deforestation analysis is not be explained by predicted uptake) is independent of con-
at community level for three reasons. First, the randomiza- founding factors. For this to be the case, some of the
tion unit is the community. Second, although there are sha- unexplained variation in the uptake model would need to be
pefiles for enrolled parcels, we do not have shapefiles for related to variation affecting uptake but not deforestation.
unenrolled parcels (either in control or in treatment commu- We suggest that such variation may be due to differences in
nities), making finer-resolution comparison impossible. how the offer of the program was experienced across the
Finally, an analysis looking at whether deforestation was communities, for example by the timing of Natura's visits to
lower in enrolled parcels than other land would be highly certain communities, the relationship between Natura tech-
vulnerable to confounding by on-farm leakage (Pfaff & nicians and communities, or the willingness of the commu-
Robalino, 2017). nity leader to spread the word about Natura's visit. We
Three further considerations impacted the analysis of support our interpretation of our propensity model results
Watershared's effect on deforestation. First, while randomi- using households' answers to the question (asked of those
zation exogenously allocated treatments, the voluntary who did not take up agreements) “Why did you not join the
nature of uptake yielded nonrandom variation in uptake. We scheme” (n = 513).WIIK ET AL. 5 of 11
2.3.3 | Leakage variables expected a priori to be strongly associated with the
Leakage is a common concern in Payments for Ecosystem outcome (limited using a screening model; SI 5).
Services schemes as pressures may be displaced rather than All our models were fitted using GAM (Wood, 2011) to
eliminated (Alix-Garcia, Shapiro, & Sims, 2012; Börner account for nonlinear relationships and nonnormal errors,
et al., 2017). It is well known that leakage poses challenges leading to our use of the Tweedie distribution family for
for conservation evaluation (Pfaff & Robalino, 2017). As deforestation (percentage) and beta for uptake propensity
noted, we controlled for within-community leakage by ana- (proportion), all selected based on a priori expectation com-
lyzing deforestation at the community scale (as deforestation bined with model comparisons for fit. The ITT and CT pre-
driven to areas near enrolled parcels would simply reduce dictor set was identical apart from whether the intervention
was coded as a binary control/treatment variable or % uptake
our impact estimate). We could not control for between-
across communities (see Table 1 for all predictors). In both
community leakage, which, if preferentially occurring from
cases, the intervention variable was interacted with uptake
treatment to control, would bias our estimated impact
propensity, which would indicate whether treatment has an
upward. However, we argue that such a bias is unlikely
effect above and beyond the effect of endogenous factors. In
because treated communities' neighbors are randomized
other words, if there is no deforestation difference between
(thus the effect should cancel out). Also, local deforestation
control and treatment communities with high predicted
is mostly due to small-scale conversion to agriculture for uptake, it implies that the scheme has had no effect above
local markets, so households are unlikely to clear land far the “null” behavior under predisposing conditions. Other
from their home. plausible interactions between predictors were tested for sig-
nificance and included where necessary. The effect on the
2.3.4 | Modeling details impact evaluation exerted by data points with high leverage
(Cook's distance) was evaluated by repeating analysis with-
Our primary, ITT analysis compared deforestation between
out them, which provided us with a more conservative esti-
treated and control communities regardless of the extent to
mate of the effect size of the PES scheme.
which Watershared agreements were signed. This estimates
Significance of predictors as well as variable selection
the effectiveness of the Watershared intervention as rolled
was determined using GAM internal Wald tests and by
out in the region. allowing for shrinkage (Wood, 2017). Model performance
To explore the potential efficacy of the intervention, we was examined by inspection of residuals (Faraway, 2006).
further developed a “continuous treatment” (CT) model, The effect size of the intervention as per the CT model was
which has some analogy to “as-treated” models commonly approximated by predicting % deforestation in five scenarios
used in the medical trials literature. However, in our situa- where % uptake was set at 0, 20, 40, 60, and 80%. For each
tion, treatment is continuous (% land area enrolled). scenario, we made 30 plausible predictions of the effect of
We followed published guidelines for analysis of inter- the intervention based on the model confidence interval. The
vention effects in randomized trials (European Medicines percentages for each community were multiplied by its for-
Agency, 2015). In addition to uptake propensity, we est cover to attain deforestation in hectares, as well as an
included as control variables those used for initial stratifica- overall % change in deforested hectares out of available for-
tion of the control and treatment group (population and cattle est in 2010.
density), the baseline value of our continuous outcome mea- All statistical analysis was undertaken with R (R Core
sure (deforestation 2000–2010), and other geographical Team, 2017), using package mgcv (Wood, 2011, 2017). R
TABLE 1 Variables used to investigate Watershared intervention effect on deforestation rates in the intention-to-treat (ITT) and continuous-treatment
(CT) models
Variable Unit Model Inclusion reason Data source
Deforestation (2011–2016) % Both Response variable Global Forest Change v1.4a
Baseline deforestation (2000–2010) % Both Baseline data for response Global Forest Change v1.4a
Population density n/ha Both Stratification Baseline data collected by Natura in 2010
Forest cover % Both Hypothesis-based Global Forest Change v1.4a
Community area ha Both Control for large variability in Community boundary shapefile, generated by our team from
community size National Institute of Agrarian Reform data with field validation
Chaco (ecoregion) % Both Screened Ecoregion shapefile (see SI 1)
Slope Both Screened USGS (2004 )
Uptake propensity % Both Endogeneity control Modeled based on data in Bottazzi et al. (2017)
Control/treatment 0/1 ITT Intervention Natura
Uptake % CT Intervention Shapefile showing Watershared agreements provided by Natura
a
Global Forest Change data was accessed at http://earthenginepartners.appspot.com/science-2013-global-forest6 of 11 WIIK ET AL.
FIGURE 2 (a) Deforestation data for the baseline (2000–2010) and intervention (2011–2016) periods (dashed line = 1:1) and (b) their differences between
control and treatment communities. Horizontal line = median, hinges = 25th and 75th percentiles, and whiskers extend to 1.5 × interquartile ranges from
each hinge. Points represent data lying beyond this range
code with all data are available at [https://doi.org/10.6084/ communities were largely balanced in uptake propensity
m9.figshare.7418264]. (Figure S4.1b in SI4).
Responses to the question “Why did you not join the
scheme,” provide some evidence that the unexplained varia-
3 | RE SUL TS tion in uptake can be explained, at least in part, by noncon-
founding factors. Not having attended a sign-up meeting
was the most common reason (50%) given by nonpartici-
3.1 | Distribution of, and trends in, deforestation
pants instead of for example, lack of interest (SI 7). While
Total deforestation in the baseline period (2000–2010) was not attending a meeting may be correlated with some con-
4,147 ha (±742 ha) but was variable across communities founders, it could also reflect variation in the way in which
(mean 1.2%, median 0.9%; Figure 2a). With the caveat that the program was offered across the study area.
any systematic difference between randomized cohorts is
necessarily due to chance and therefore invalidates the pre- 3.3 | ITT model (79.7% deviance explained—see SI 8)
mise for frequentist significance tests, we note that there was
no significant difference (Wilcoxon rank sum test) in either ITT analysis revealed no significant difference overall
measure between control and treatment communities (i.e., intercept) between deforestation in control and treatment
(Figure 2b), supporting the visual inspection of balance communities after accounting for control variables including
between control and treatment. The control and treatment uptake propensity (Figure 3). The slope of uptake propensity
communities were also largely balanced in the potential varied between control and treatment: uptake propensity was
significant for the treatment communities but insignificant for
drivers of deforestation we identified (SI 6).
Communities with high baseline deforestation tended to control communities (p = 0.016 vs. p = 0.11). For treatment
also have high deforestation during the intervention period, communities, the relationship suggested decreasing deforesta-
however there was considerable scatter around this relationship tion with increasing uptake propensity (Figure 4a). However,
following removal of data points with high leverage on model
(Figure 2a). The total area of deforestation during the interven-
outcomes (n = 3), there was no significant control/treatment
tion (2011–2016) was 6,042 ha (±3,933 ha); again, this was
difference in the relationship between deforestation and uptake
variable across communities (mean 1.7%, median of 1.2%).
propensity and therefore the effect is volatile (Figure 4b).
Considering the intervention period is shorter, this implies
increased overall deforestation in the intervention period.
3.4 | Continuous-treatment model (80.3% deviance
explained—see SI 8)
3.2 | Modeling propensity of uptake in Watershared The continuous-treatment model indicated a significant neg-
agreements
ative relationship between both increasing % uptake and %
Our model of uptake propensity explained 50% of uptake uptake propensity (as interaction) and deforestation
(Figure S4.1a), with considerable and slightly biased scatter (p = 0.008; Figure 5a; SI 8). For this model, removing the
around the 1:1 line. Testing different model family specifica- data points with high leverage on model outputs did not
tions and predictor interactions did not improve fit, suggest- remove the treatment effect (Figure 5b). The treatment effect
ing omitted variable bias; however control and treatment is small. If an 80% uptake were achieved our models suggestWIIK ET AL. 7 of 11
FIGURE 3 Difference in deforestation between control and treatment communities based on the intention-to-treat model with (full) and without (N – 3)
communities with high leverage on model results. Bars are standard errors
FIGURE 4 The intention-to-treat model suggests decreasing deforestation with increasing uptake propensity for treatment but not control communities when
all communities are included (a). However when three communities with high leverage on model results are discarded, there is no difference between control
and treatment cohorts (b). The rug shows the distribution of real data points
this would result in a reduction of deforestation of just communities (but not in control communities; Figure 4), this
670 ha compared with 0% uptake. This represents a reduc- effect was driven by three communities with high leverage.
tion in deforestation rate from 1.58 ± 0.015% (1 SD) (with Our exploration of efficacy (CT model) showed that defores-
0% uptake scenario) to 1.41 ± 0.042 (1 SD). tation decreased slightly with increasing uptake regardless of
uptake propensity, which suggests that improvement of
uptake rates could potentially lead to effective intervention.
4 | DISCUSSION Interpretation of our CT model rests on the assumption
that deviation from intended treatment (both uptake in control
4.1 | Did the Watershared intervention effectively slow communities, and some element of variation of uptake in trea-
deforestation? ted communities) was independent of confounding factors
We did not detect a measurable impact of Watershared on (McNamee, 2009). We are confident that confounding factors
deforestation using the ITT model. This suggests that, as did not drive the cases of uptake in control communities; they
implemented in the landscape, Watershared was not effec- were the result of an accident of geography (people living in
tive at slowing deforestation. While there is some evidence treatment communities who owned land in control communi-
that deforestation was reduced for communities with a ties) and limited monitoring of the RCT (they should not have
higher propensity to take up the scheme in treatment been allowed to enroll that land). The 50% of uptake variation8 of 11 WIIK ET AL. FIGURE 5 The results of the continuous-treatment model with (a) and without (b) three communities with high leverage on model results. The estimated effect of uptake can be seen by comparing deforestation (color scale) between communities with similar uptake propensity (x-axis) but different actual uptake (y-axis) we could not explain with our propensity score, while poten- (
WIIK ET AL.                                                                                                                 9 of 11

did not deliver reductions in deforestation with the levels of     (Ferraro & Hanauer, 2014). Quasi-experimental approaches
uptake which were achieved in the study area. We mention           represent a huge advance over what passed for conservation
above that low uptake in some communities may have been            evaluations in the past, and their increasing use is very posi-
driven at least partly by differences in how the intervention      tive. However, post-hoc analysis is only as reliable as the
was presented between communities, which could be benefi-          counterfactual scenario which can be created statistically and
cial to explore in the future.                                     recent evidence demonstrates how even supposedly robust
     The value of the in-kind incentives is also likely to have    methods such as difference-in-differences can result in
a role in uptake. While it is difficult to draw comparisons        biases in impact estimates (Daw & Hatfield, 2018). As much
across countries with different economies, the value of the        as possible, therefore, conservation interventions should be
incentives in Watershared are low compared with other pro-         explicitly designed to allow robust evaluation (Ferraro &
gram (the value of the incentives for the most restricting         Hanauer, 2014). Randomizing a conservation intervention
agreements is $10 a hectare plus the equivalent of a $100          can help to facilitate an evaluation by reducing the role of
value joining bonus, but just $1 a hectare for the least           confounding factors, as well as providing a satisfactory pool
restricting agreements; SI 2). For comparison, Mexico's pro-       of counterfactuals in cases of nonrandom uptake.
gram pays 27–36 USD ha−1 year−1 depending on forest type               The Watershared RCT suffered from some contamina-
(Muñoz-Piña, Guevara, Torres, & Braña, 2008), Costa Rica's         tion of the control and considerable variability in uptake.
national program pays 45–163 USD ha−1 year−1 (Wunder,              Despite this “noise”, the randomized design was an improve-
Engel, & Pagiola, 2008), and the Ugandan PES program               ment from a nonrandomized alternative. This is because
paid 28 USD ha−1 year−1 (Jayachandran et al., 2017). Those         unobserved confounders driving uptake are likely to exist,
promoting Watershared argue that it works through nudging,         which quasi-experimental methods such as matching cannot
by emphasizing environmental norms and reciprocity rather          account for. The existence of a control balanced in all factors
than paying the opportunity cost, so the level of incentives is    for which we have data gives us confidence that the
relatively unimportant (Asquith, 2016). There is evidence          observed effect (or lack of ) is not due to these unobserved
that farmers enroll due to the perception that they or their       confounders. For example, there were low uptake rates in
community will benefit from improved water quality                 the northern sector which would not have been expected a
(Bottazzi et al., 2018). However both theory (Persson &            priori, however randomization ensured that comparable con-
Alpízar, 2013) and empirical data (Arriagada, Sills, Patta-        trols existed.
nayak, & Ferraro, 2009) do predict low incentives lead to              Despite calls for more randomized experiments in con-
low participation. We suggest that higher valued incentives        servation impact evaluation, their use remains rare. Water-
could increase uptake of Watershared.                              shared is one of only three randomized impact evaluations
     Our evidence suggests that even if uptake could be            of landscape-scale conservation interventions we are aware
greatly increased, the reduction in deforestation would be         of (the others are: Jayachandran et al., 2017; Wilebore,
modest. A common problem in all PES schemes is adverse
                                                                   Voors, Bulte, Coomes, & Kontoleon, in press). There are
selection; participants enroll land which is unlikely to be
                                                                   ethical and practical challenges meaning that full RCTs are
cleared anyway, resulting in low additionality (Börner et al.,
                                                                   not always appropriate (Baylis et al., 2016; Deaton & Cart-
2017). A recent analysis suggests that only 13% of the land
                                                                   wright, 2018; Ferraro, 2011; Pynegar et al., 2018). How-
area enrolled in Watershared agreements has resulted in
                                                                   ever, where possible, randomization certainly offers
additional conservation (Bottazzi et al., 2018). If higher pay-
                                                                   valuable opportunities for improving causal inference
ments could increase additionality as well as uptake this may
                                                                   (Ferraro, 2011). The Watershared RCT is the result of a
therefore increase the efficacy of the intervention.
                                                                   collaboration between practitioners, who had the foresight
     We finally note that the impact of Watershared may also
                                                                   to implement their intervention in a randomized design,
increase and/or materialize with time, as found for a number of
                                                                   and researchers. More such collaborations would facilitate
PES schemes (Grima, Singh, Smetschka, & Ringhofer, 2016),
                                                                   a growth in the robust evaluations that conservation so des-
especially where livelihood changes are incentivized (Börner
                                                                   perately needs. We hope that conservation can avoid the
et al., 2017). For example, many of the Watershared incentives
                                                                   polarized debate surrounding the value of knowledge gen-
involve either waiting (fruit tree saplings reaching maturation)
                                                                   erated from RCTs in other fields (Ravallion, 2009), and
or mastery (bee keeping, effective irrigation) before becoming
                                                                   that randomization can be added to the conservationist
a financially viable alternative to the status quo.
                                                                   toolkit where appropriate.

4.4 | What can RCT contribute to conservation impact
evaluation?                                                        ACKNOWLEDGMENTS

Establishing causality in environmental policies by properly       We thank colleagues at Fundación Natura Bolivia especially
identifying counterfactual outcomes is essential if environ-       Maria Teresa Vargas, Tito Vidaurre, Johnny Severiche,
mental policy decisions are to be based on evidence                Roger Coronado and Victoria Aguilera, and Patrick Bottazzi.
10 of 11 WIIK ET AL.
James Gibbons, Gavin Simpson, Alex Pfaff, and Paul Fer- data from a randomised control trial of the Watershared intervention in the
Bolivian Andes. ReShare UKData Archive. https://doi.org/10.5255/UKDA-
raro provided valued input on analytical approaches, giving SN-852623
very generously of their time. We are also grateful to Kelsey Bottazzi, P., Wiik, E., Crespo, D., & Jones, J. P. G. (2018). Payment for environ-
Jack who designed the initial randomization in 2010. This mental “self-service”: Exploring the links between Farmers' motivation and
additionality in a conservation incentive programme in the Bolivian Andes.
research was funded by grant RPG-2014-056 from the Ecological Economics, 150, 11–23. https://doi.org/10.1016/j.ecolecon.2018.
Leverhulme Trust and grant NE/L001470/1 from the UK's 03.032
Ecosystem Services and Poverty Alleviation program. Clements, T., & Milner-Gulland, E. J. (2015). Impact of payments for environ-
mental services and protected areas on local livelihoods and forest conserva-
tion in northern Cambodia. Conservation Biology, 29(1), 78–87. https://doi.
org/10.1111/cobi.12423
CONFLICT OF INTEREST Daw, J. R., & Hatfield, L. A. (2018). Matching and regression to the mean in
difference-in-differences analysis. Health Services Research. https://doi.
There is the potential for conflict of interest as Natura were
org/10.1111/1475-6773.12993
involved in the research but are also the implementers of the Deaton, A., & Cartwright, N. (2018). Understanding and misunderstanding ran-
Watershared program which is the focus of our research. domized controlled trials. Social Science and Medicine, 210, 2–21. https://
doi.org/10.1016/j.socscimed.2017.12.005
However, while N.A. (who was involved in founding Nat-
Eklund, J., Guillaume Blanchet, F., Nyman, J., Rocha, R., Virtanen, T., &
ura) is a co-author, he was not directly involved in the anal- Cabeza, M. (2016). Contrasting spatial and temporal trends of protected area
ysis (his role was providing context for helping us design effectiveness in mitigating deforestation in Madagascar. Biological Conser-
the analysis and interpret results). E.P. started working for vation, 203, 290–297. https://doi.org/10.1016/j.biocon.2016.09.033
European Medicines Agency. (2015). Guideline on adjustment for baseline cov-
Natura after this analysis was complete. ariates in clinical trials. London, England: Author.
Faraway, J. J. (2006). Extending the linear model with R: Generalized linear,
mixed effects and nonparametric regression models. In CRC texts in statisti-
Author contributions cal science series (Vol. 62, 2nd ed.). Boca Raton, FL: Chapman and Hall.
E.W. and J.P.G.J. conceived the analysis with input from the https://doi.org/10.1111/j.1541-0420.2006.00596_12.x
Ferraro, P. J. (2011). Experimental project designs in the global environment
other authors. R.D. developed the forest change product and facility designing projects to create evidence and catalyze investments to
conducted the validation (with help from Crespo). E.W. and secure global environmental benefits. Retrieved from http://www.unep.
J.P.G.J. wrote the paper. N.A. developed the randomization org/stap/
Ferraro, P. J., & Hanauer, M. M. (2014). Advances in measuring the environ-
which made the analysis possible. mental and social impacts of environmental programs. Annual Review of
Environment and Resources, 39(1), 495–517. https://doi.org/10.1146/
ORCID annurev-environ-101813-013230
Ferraro, P. J., & Pattanayak, S. K. (2006). Money for nothing? A call for empiri-
Julia P. G. Jones https://orcid.org/0000-0002-5199-3335 cal evaluation of biodiversity conservation investments. PLoS Biology, 4(4),
e105. https://doi.org/10.1371/journal.pbio.0040105
Glennerster, R., & Takavarasha, K. (2013). Running randomized evaluations: A
REFERENC ES practical guide. Princeton, NJ: Princeton University Press.
Alix-Garcia, J. M., Mcintosh, C., Sims, K. R. E., & Welch, J. R. (2013). The Grillos, T. (2017). Economic vs non-material incentives for participation in an
ecological footprint of poverty alleviation: Evidence from Mexico's Opor- in-kind payments for ecosystem services program in Bolivia. Ecological
tunidades program. The Review of Economics and Statistics, 95(2), Economics, 131, 178–190. https://doi.org/10.1016/j.ecolecon.2016.08.010
417–435. Grima, N., Singh, S. J., Smetschka, B., & Ringhofer, L. (2016). Payment for eco-
Alix-Garcia, J. M., Shapiro, E. N., & Sims, K. R. E. (2012). Forest conservation system services (PES) in Latin America: Analysing the performance of
and slippage: Evidence from Mexico's National Payments for Ecosystem 40 case studies. Ecosystem Services, 17, 24–32. https://doi.org/10.1016/j.
Services Program. Land Economics, 88(4), 613–638. https://doi.org/10.1353/ ecoser.2015.11.010
lde.2012.0052 Gupta, S. (2011). Intention-to-treat concept: A review. Perspectives in Clinical
Alix-Garcia, J. M., Sims, K. R. E., Orozco-Olvera, V. H., Costica, L. E., Research, 2(3), 109–112. https://doi.org/10.4103/2229-3485.83221
Fernández Medina, J. D., & Romo Monroy, S. (2018). Payments for environ- Hansen, M. C., Potapov, P. V., Moore, R., Hancher, M., Turubanova, S. A.,
mental services supported social capital while increasing land management. Tyukavina, A., … Townshend, J. R. G. (2013). High-resolution global maps
Proceedings of the National Academy of Sciences of the United States, 115, of 21st-century forest cover change. Science, 342(6160), 850–853. https://
7016–7021. doi.org/10.1126/science.1244693
Arriagada, R. A., Sills, E. O., Pattanayak, S. K., & Ferraro, P. J. (2009). Combin- Jayachandran, S., de Laat, J., Lambin, E. F., Stanton, C. Y., Audy, R., &
ing qualitative and quantitative methods to evaluate participation in Costa Thomas, N. E. (2017). Cash for carbon: A randomized trial of payments for
Rica's program of payments for environmental services. Journal of Sustain- ecosystem services to reduce deforestation. Science, 357(6348), 267–273.
able Forestry, 28(3–5), 343–367. https://doi.org/10.1126/science.aan0568
Asquith, N. M. (2016). Watershared: Adaptation, mitigation, watershed protec- Landell-Mills, N., & Porras, I. T. (2002). Silver bullet or fools' gold? A global
tion and economic development in Latin America. Climate & Development review of markets for forest environmental services and their impact on the
Knowledge Network, 1, 1–7. poor. London, England: NEPAD.
Baylis, K., Honey-Rosés, J., Börner, J., Corbera, E., Ezzine-de-Blas, D., McNamee, R. (2009). Intention to treat, per protocol, as treated and instrumental
Ferraro, P. J., … Wunder, S. (2016). Mainstreaming impact evaluation in variable estimators given non-compliance and effect heterogeneity. Statistics
nature conservation. Conservation Letters, 9(1), 58–64. https://doi.org/10. in Medecine, 28, 2639–2652.
1111/conl.12180 Miteva, D. A., Pattanayak, S. K., & Ferraro, P. J. (2012). Evaluation of biodiver-
Börner, J., Baylis, K., Corbera, E., Ezzine-de-Blas, D., Honey-Rosés, J., sity policy instruments: What works and what doesn't? Oxford Review of
Persson, U. M., & Wunder, S. (2017). The effectiveness of payments for Economic Policy, 28(1), 69–92. https://doi.org/10.1093/oxrep/grs009
environmental services. World Development, 96, 359–374. https://doi.org/10. Muñoz-Piña, C., Guevara, A., Torres, J. M., & Braña, J. (2008). Paying for the
1016/j.worlddev.2017.03.020 hydrological services of Mexico's forests: Analysis, negotiations and results.
Bottazzi, P., Vargas Rios, M. T., Asquith, N., Crespo, D., Vidaurre, T., Ecological Economics, 65(4), 725–736. https://doi.org/10.1016/j.ecolecon.
García, M., … Jones, J. P. G. (2017). Baseline and endline socio-economic 2007.07.031WIIK ET AL. 11 of 11
Olofsson, P., Foody, G. M., Herold, M., Stehman, S. V., Woodcock, C. E., & for REDD+: Study design and methods for evaluating the impacts of conser-
Wulder, M. A. (2014). Good practices for estimating area and assessing vation interventions on local well-being. Global Environmental Change, 43,
accuracy of land change. Remote Sensing of Environment, 148, 42–57. 148–160. https://doi.org/10.1016/j.gloenvcha.2017.02.002
https://doi.org/10.1016/j.rse.2014.02.015 Sims, K. R. E. (2010). Conservation and development: Evidence from Thai pro-
Pattanayak, S. K., Wunder, S., & Ferraro, P. J. (2010). Show me the money: Do tected areas. Journal of Environmental Economics and Management, 60,
payments supply environmental services in developing countries? Review of 94–114. https://doi.org/10.1016/j.jeem.2010.05.003
Environmental Economics and Policy, 4(2), 254–274. https://doi.org/10. Ten Have, T. R., Normand, S.-L. T., Marcus, S. M., Brown, C. H., Lavori, P., &
1093/reep/req006 Duan, N. (2008). Intent-to-treat vs. non-intent-to-treat analyses under treat-
Persson, U. M., & Alpízar, F. (2013). Conditional cash transfers and payments ment non-adherence in mental health randomized trials. Psychiatric Annals,
for environmental services—A conceptual framework for explaining and 38(12), 772–783. https://doi.org/10.3928/00485713-20081201-10
judging differences in outcomes. World Development, 43, 124–137. https:// USGS. (2004). Shuttle radar topography mission, 1 arc second scene
doi.org/10.1016/j.worlddev.2012.10.006 SRTM_u03_n008e004, unfilled unfinished 2.0, February 2000. College Park,
Pfaff, A., & Robalino, J. (2017). Spillovers from conservation programs. Annual MD: Global Land Cover Facility, University of Maryland.
Review of Resource Economics, 9(1), 299–315. https://doi.org/10.1146/ Wilebore, B., Voors, M., Bulte, E., Coomes, D., & Kontoleon, A. (in press).
annurev-resource-100516-053543 Unconditional transfers and tropical forest conservation. Evidence from a
Pullin, A. S., & Knight, T. M. (2001). Effectiveness in conservation practice: randomized control trial in Sierra Leone. American Journal of Agricultural
Pointers from medicine and public health. Conservation Biology, 15, 50–54. Economics.
https://doi.org/10.1046/j.1523-1739.2001.99499.x Wood, S. N. (2011). Fast stable restricted maximum likelihood and marginal
Pynegar, E. L., Jones, J. P. G., Gibbons, J. M., & Asquith, N. M. (2018). The likelihood estimation of semiparametric generalized linear models. Journal
effectiveness of payments for ecosystem services at delivering improvements of the Royal Statistical Society: Series B (Statistical Methodology), 73(1),
in water quality: Lessons for experiments at the landscape scale. PeerJ, 6, 3–36. https://doi.org/10.1111/j.1467-9868.2010.00749.x
e5753. https://doi.org/10.7717/peerj.5753 Wood, S. N. (2017). Generalized additive models: An introduction with R (2nd
R Core Team. (2017). R: A language and environment for statistical computing. ed.). Boca Raton, FL: CRC Press.
Vienna, Austria: R Foundation for Statistical Computing. Retrieved from Wunder, S. (2007). The efficiency of payments for environmental services in
http://www.R-project.org/ tropical conservation. Conservation Biology, 21(1), 48–58. https://doi.
Rasolofoson, R. A., Ferraro, P. J., Jenkins, C. N., & Jones, J. P. G. (2015). Effec- org/10.1111/j.1523-1739.2006.00559.x
tiveness of community forest management at reducing deforestation in Mada- Wunder, S. (2015). Revisiting the concept of payments for environmental ser-
gascar. Biological Conservation, 184, 271–277. https://doi.org/10.1016/j. vices. Ecological Economics, 117, 234–243.
biocon.2015.01.027 Wunder, S., Engel, S., & Pagiola, S. (2008). Taking stock: A comparative analy-
Ravallion, M. (2009). Should the randomistas rule? The Economists' Voice, 6(2), sis of payments for environmental services programs in developed and devel-
8–12. https://doi.org/10.2202/1553-3832.1368 oping countries. Ecological Economics, 65(4), 834–852.
Robalino, J., & Pfaff, A. (2013). Ecopayments and deforestation in Costa Rica:
A nationwide analysis of PSA's initial years. Land Economics, 89(3), SUPPORTING I NFORMATION
432–448. https://doi.org/10.3368/le.89.3.432
Salzman, J., Bennett, G., Carroll, N., Goldstein, A., & Jenkins, M. (2018). The Additional supporting information may be found online in
global status and trends of payments for ecosystem services. Nature Sustain- the Supporting Information section at the end of the article.
ability, 1(3), 136–144. https://doi.org/10.1038/s41893-018-0033-0
Samii, C., Lisiecki, M., Kulkarni, P., Paler, L., & Chavis, L. (2014). Effects of
payment for environmental services (PES) on deforestation and poverty in How to cite this article: Wiik E, d’Annunzio R,
low and middle income countries: A systematic review. Campbell Systematic
Reviews, (11), 10. https://doi.org/10.4073/csr.2014.11
Pynegar E, Crespo D, Asquith N, Jones JPG. Experi-
Sánchez-Azofeifa, G. A., Pfaff, A., Robalino, J. A., & Boomhower, J. P. (2007). mental evaluation of the impact of a payment for envi-
Costa Rica's payment for environmental services program: Intention, imple- ronmental services program on deforestation.
mentation, and impact. Conservation Biology, 21(5), 1165–1173. https://doi.
org/10.1111/j.1523-1739.2007.00751.x
Conservation Science and Practice. 2019;e8. https://
Sills, E. O., de Sassi, C., Jagger, P., Lawlor, K., Miteva, D. A., doi.org/10.1002/csp2.8
Pattanayak, S. K., & Sunderlin, W. D. (2017). Building the evidence baseYou can also read