Exploring the sensitivity of atmospheric nitrate concentrations to nitric acid uptake rate using the Met Office's Unified Model
←
→
Page content transcription
If your browser does not render page correctly, please read the page content below
Atmos. Chem. Phys., 21, 15901–15927, 2021
https://doi.org/10.5194/acp-21-15901-2021
© Author(s) 2021. This work is distributed under
the Creative Commons Attribution 4.0 License.

Exploring the sensitivity of atmospheric nitrate concentrations to
nitric acid uptake rate using the Met Office’s Unified Model
Anthony C. Jones1 , Adrian Hill1 , Samuel Remy2 , N. Luke Abraham3,4 , Mohit Dalvi1 , Catherine Hardacre1 ,
Alan J. Hewitt1 , Ben Johnson1 , Jane P. Mulcahy1 , and Steven T. Turnock1,5
1 Met Office, Fitzroy Road, Exeter, EX1 3PB, UK
2 HYGEOS,    Lille, France
3 National Centre for Atmospheric Science, Leeds, LS2 9PH, UK
4 Department of Chemistry, University of Cambridge, Lensfield Road, Cambridge, CB2 1EW, UK
5 Met Office Strategic Research Group, School of Earth and Environment, University of Leeds, Leeds, LS2 9JT, UK

Correspondence: Anthony C. Jones (anthony.jones@metoffice.gov.uk)

Received: 12 May 2021 – Discussion started: 8 June 2021
Revised: 20 August 2021 – Accepted: 30 September 2021 – Published: 26 October 2021

Abstract. Ammonium nitrate is a major aerosol constituent          and provides a novel mechanism for reducing nitrate con-
over many land regions and contributes to air pollution            centration biases in climate model simulations. The new UM
episodes, ecosystem destruction, regional haze, and aerosol-       nitrate scheme represents a step change in aerosol modelling
induced climate forcing. Many climate models that repre-           capability in the UK across weather and climate timescales.
sent ammonium nitrate assume that the ammonium–sulfate–
nitrate chemistry reaches thermodynamic equilibrium instan-
taneously without considering kinetic limitations on conden-
sation rates. The Met Office’s Unified Model (UM) is em-           1   Introduction
ployed to investigate the sensitivity of ammonium nitrate
concentrations to the nitric acid uptake coefficient (γ ) in a     Air pollution poses a significant hazard to human health and
newly developed nitrate scheme in which first-order conden-        to the environment worldwide. In 2016, 90 % of the global
sation theory is utilised to limit the rate at which thermo-       population was exposed to pollutant concentrations in ex-
dynamic equilibrium is attained. Two values of γ represent-        cess of World Health Organisation (WHO)-defined safe lev-
ing fast (γ = 0.193) and slow (γ = 0.001) uptake rates are         els, resulting in ∼ 7 million premature deaths (WHO, 2020).
tested in 20-year global UM integrations. The global burden        Specific human health conditions arising from air pollution
of nitrate associated with ammonium in the “fast” simula-          exposure include lung cancer and cardiopulmonary disease,
tion (0.11 Tg[N]) is twice as great as in the “slow” simu-         and deleterious impacts also extend to ecosystems (e.g. eu-
lation (0.05 Tg[N]), while the top-of-the-atmosphere radia-        trophication, loss of biodiversity, acid deposition), building
tive impact of representing nitrate is −0.19 W m−2 in the          and infrastructure erosion, and impaired atmospheric visi-
fast simulation and −0.07 W m−2 in the slow simulation. In         bility and regional haze (Kucera and Fitz, 1995; Monks et
general, the fast simulation exhibits better spatial correlation   al., 2009; Lovett et al., 2009; Xu et al., 2019). Solid or liq-
with observed nitrate concentrations, while the slow simu-         uid particulate matter (PM) is a significant component of air
lation better resolves the magnitude of concentrations. Lo-        pollution, and particles with diameters less than 2.5 µm (i.e.
cal near-surface nitrate concentrations are found to be highly     PM2.5 ) are particularly harmful to human health. Lelieveld et
correlated with seasonal ammonia emissions, suggesting that        al. (2015) estimate PM2.5 -related global mortality to be 3.3
ammonia is the predominant limiting factor controlling ni-         million deaths per year in 2010, far greater than the second
trate prevalence. This study highlights the high sensitivity of    deadliest air pollutant, ozone (O3 , 142 thousand deaths per
ammonium nitrate concentrations to nitric acid uptake rates        year). Sources of air pollution differ with region; in northern
                                                                   Africa and the Middle East, the predominant source is nat-

Published by Copernicus Publications on behalf of the European Geosciences Union.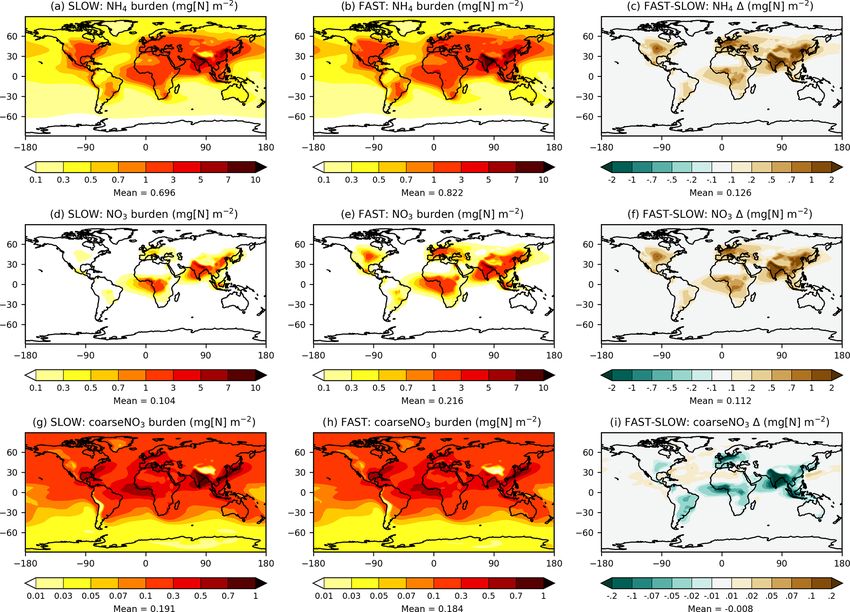
15902                                                       A. C. Jones et al.: Sensitivity of nitrate to nitric acid uptake rate

urally emitted dust; in Europe, agricultural activity; and in      son, 2000). HNO3 is highly soluble and rapidly dissolves in
Southeast Asia, residential energy production (Lelieveld et        water droplets or is neutralised by NH3 to form aerosol. SO2
al., 2015).                                                        is oxidised in the aqueous phase by dissolved oxidants such
   Secondary inorganic ammonium (NH4 ), sulfate (SO4 ), and        as O3 and hydrogen peroxide (H2 O2 ) and in the gas phase
nitrate (NO3 ) aerosol form a major part of PM2.5 compo-           by OH to form non-volatile H2 SO4 (Seinfeld and Pandis,
sition in the Northern Hemisphere (Jimenez et al., 2009).          1998). H2 SO4 and HNO3 react with NH3 to produce am-
Ammonium is predominantly emitted as ammonia (NH3 )                monium sulfate ((NH4 )2 SO4 ) and semi-volatile ammonium
gas by agricultural sources such as mineral fertiliser appli-      nitrate (NH4 NO3 ) aerosol respectively, with H2 SO4 neutrali-
cation and volatilisation of livestock manure, biomass burn-       sation taking precedence owing to the lower vapour pressure
ing, and from oceans (Bauer et al., 2016). NH3 emissions           of H2 SO4 over HNO3 (Hauglustaine et al., 2014). In a slower
from agriculture have dramatically increased since the dis-        process, HNO3 also condenses irreversibly onto existing dust
covery of the Haber–Bosch process for extracting reactive          and sea-salt aerosols, forming calcium nitrate (Ca(NO3 )2 )
nitrogen from its stable atmospheric form (N2 ) in the early       and sodium nitrate (NaNO3 ) salts respectively (Li and Shao,
20th century. The corresponding NH3 -based fertiliser rev-         2009). Owing to the prevalence of anthropogenic NOx and
olution led to significantly enhanced global food produc-          NH3 sources, particulate NO3 is a major component of ur-
tion and a population explosion from 2 billion to 7 billion        ban air pollution. For example, in Europe NO3 constitutes
people (Smith et al., 2020). However, reactive nitrogen de-        17 % of urban PM2.5 aerosol by mass (Putaud et al., 2004),
position from fertiliser usage is now 20-fold higher than it       while NH4 NO3 can comprise 75 % of PM2.5 in air pollution
was before the industrial revolution, leading to environmen-       events in Salt Lake City (Womack et al., 2019).
tal degradation (Xu et al., 2019). NO3 is formed from atmo-           Nitrate aerosol has an enigmatic history within the cli-
spheric nitric acid (HNO3 ), itself an oxidation product of ni-    mate modelling community owing to the complexity of mod-
trogen oxides (NOx = NO+NO2 ). NOx is primarily emitted            elling HNO3 neutralisation by NH3 and the semi-volatility of
from anthropogenic fossil fuel burning (21–28 Tg N yr−1 )          NH4 NO3 aerosol. In the inorganic aerosol system, gaseous
but has natural sources including soil emissions, biomass          and particulate equilibria are reached at different rates due to
burning, and lightning (12–35 Tg N yr−1 ) (Seinfeld and Pan-       evolving temperature and acidity constraints and the variabil-
dis, 1998; Vinken et al., 2014). NOx exacerbates air pollu-        ity in gaseous uptake with particle size (Myhre et al., 2006;
tion via two pathways – by NO3 aerosol production and by           Benduhn et al., 2016). Although complex dynamical and
net O3 production in the presence of sunlight and volatile         “hybrid dynamical” schemes that fully or partially resolve
organic compounds (VOCs) (Crutzen, 1970). SO4 is the ox-           the chemistry of inorganic aerosol exist (e.g. Jacobson, 1997;
idation product of sulfur dioxide (SO2 ), which is primarily       Feng and Penner, 2007; Zaveri et al., 2007; Benduhn et al.,
emitted by anthropogenic processes such as fossil fuel com-        2016; Xu and Penner, 2012), they remain computationally
bustion, petroleum refining, and metal smelting (Zhong et          expensive – owing to the numerical stiffness of the inorganic
al., 2020). Natural SO2 sources include volcanic degassing         system – when compared to schemes that assume thermo-
and the oxidation of reduced natural sulfurous compounds           dynamic equilibrium is reached instantaneously (Nenes et
such as dimethyl sulfide (DMS) (Carn et al., 2017). Global         al., 1998). Most of the current crop of nitrate-resolving global
anthropogenic SO2 emissions have steadily declined from            climate models (GCMs) and some regional climate models
a peak of ∼ 70 Tg S yr−1 in the 1980s to ∼ 52 Tg S yr−1 in         (RCMs) assume the instantaneous thermodynamic equilib-
2014, owing to clean air regulation instigated to mitigate         rium approximation (Liao et al., 2003; Myhre et al., 2006;
adverse SO2 impacts such as acid rain and also for human           Bauer et al., 2007; Bellouin et al., 2011; Hauglustaine et
health benefits (McDuffie et al., 2020; Zhong et al., 2020).       al., 2014; Paulot et al., 2016; Bian et al., 2017; Rémy et
Global NOx emissions peaked in 2010 at ∼ 40 Tg N yr−1 ,            al., 2019). Dynamical models have the advantage of captur-
with emissions growth from 1990–2010 driven by rapid in-           ing natural phenomena where the inorganic aqueous system
dustrialisation in Asia and intensified international shipping,    is outside of (or slow to reach) equilibrium, e.g. in low gas
but have decreased by 7 % over the 2010s, owing primarily          concentrations, low temperatures, high relative humidities
to traffic emission control measures in China (McDuffie et         (RHs), and for condensation onto coarse particles (Wexler
al., 2020).                                                        and Seinfeld, 1990; Benduhn et al., 2016). Thermodynamic
   In the troposphere, NOx is involved in a complex diurnal        equilibrium models typically overestimate the fraction of
photochemical cycle involving VOCs and O3 . The dominant           NO3 in the coarse mode; for example, in one study NO3 asso-
NOx removal mechanism during daytime is via oxidation by           ciated with fine-mode NH4 NO3 was underestimated by 25 %
hydroxyl (OH) radicals to form HNO3 (Seinfeld and Pan-             compared to a hybrid-dynamical model (Feng and Penner,
dis, 1998). At night-time, NO2 is unable to photolyse and          2007). However, the additional computational expense of us-
the dominant NOx removal mechanism is via reaction with            ing dynamical approaches has motivated the climate mod-
O3 to produce the NO3 radical, which further reacts with           elling community to seek pragmatic solutions to represent
NO2 to form dinitrogen pentoxide (N2 O5 ), which heteroge-         NH4 and NO3 aerosol in GCMs and RCMs.
neously reacts with water (H2 O) to produce HNO3 (Atkin-

Atmos. Chem. Phys., 21, 15901–15927, 2021                                          https://doi.org/10.5194/acp-21-15901-2021

A. C. Jones et al.: Sensitivity of nitrate to nitric acid uptake rate                                                     15903

   GCM simulations suggest that the present-day direct ra-        omits ammonium nitrate (Mann et al., 2010; Mulcahy et
diative forcing from NO3 (global mean ≈ −0.1 W m−2 )              al., 2020). Mulcahy et al. (2020) attributed a negative bias in
amounts to a quarter of the SO4 forcing on a global-mean          aerosol optical depth and mass burden over Northern Hemi-
basis (Myhre et al., 2006; Bauer et al., 2007; Bellouin et        sphere continents in UKESM1 to the missing NH4 and NO3 .
al., 2011; Hauglustaine et al., 2014). NO3 aerosol burdens are    The hybrid-dynamical nitrate scheme developed by Benduhn
widely projected to increase over the 21st century as a result    et al. (2016) in the stand-alone GLOMAP-mode model is not
of stricter SO2 emissions regulations and continued elevated      currently implemented in the UM. This has provided the Met
NH3 emissions, which would reduce the SO4 available for           Office with fresh impetus to develop a simplified thermo-
neutralisation and concomitantly liberate NH4 for NH4 NO3         dynamic equilibrium nitrate scheme within the GLOMAP-
formation (Bauer et al., 2007; Bellouin et al., 2011). Conse-     mode framework for interim use in the UM and possible im-
quently, NO3 may become the dominant aerosol species in           plementation in future generations of UKESM, in order to
terms of radiative and urban air pollution impact by the end      address the gaps in modelled NH4 and NO3 with their re-
of the century, depending on future emissions of SO2 , NH3 ,      spective observations. The nitrate scheme may garner fur-
and NOx (Hauglustaine et al., 2014). Such NO3 concentra-          ther utility if AQUM or its successor transitions to utilising
tion enhancements may be effectively mitigated on a regional      the GLOMAP-mode aerosol scheme rather than CLASSIC
basis by judicious regulation targeting anthropogenic NH3         (Hemmings and Savage, 2018).
and/or NOx emissions (Bauer et al., 2016). However, climate          In this paper we describe the development and testing of a
models disagree as to whether near-surface NO3 concentra-         simple thermodynamic equilibrium nitrate scheme in the UM
tions will increase or decrease in future climate and on the      and explore the sensitivity of the scheme to a key parameter
correct partitioning between NO3 in the fine mode (associ-        that is poorly constrained by observations – the HNO3 uptake
ated with NH4 ) and coarse mode (associated with dust and         coefficient on aerosol surfaces (γ ). Specifically, most models
sea salt) (Bian et al., 2017). Many of the uncertainties in NH4   assume that NH4 NO3 concentrations reach thermodynamic
and NO3 projections emanate from different treatments of          equilibrium instantaneously without considering kinetic lim-
the HNO3 and NH3 gases in models, with Bian et al. (2017)         itations on the condensation of HNO3 or NH3 onto exist-
highlighting wet deposition as a particularly sensitive pro-      ing aerosol particles, as is considered here. This is the first
cess. Additionally, the vertical distributions of HNO3 and        study to investigate the sensitivity of NH4 NO3 concentra-
NH3 are poorly constrained by observations, which adds to         tions to the HNO3 uptake coefficient and provide an efficient
uncertainty in NH4 and NO3 projections (Paulot et al., 2016).     method for reducing NO3 concentration biases in GCMs.
   The emerging conclusion from observations and from             The UM nitrate scheme reported here comprises fine NH4
the burgeoning literature on nitrate modelling is that am-        and NO3 aerosol in the Aitken, accumulation, and coarse sol-
monium nitrate poses an increasingly significant health           uble modes and coarse NO3 representing NO3 aerosol asso-
hazard through urban air pollution (e.g. DEFRA, 2012)             ciated with dust and sea salt in the accumulation and coarse
and via deposition to nitrogen-saturated ecosystems (Li et        soluble modes. NH4 NO3 mostly remains in the Aitken and
al., 2016); they potentially could become a major climate         accumulation modes and thus the moniker “fine” is appropri-
forcing agent as SO4 concentrations wane (Hauglustaine            ate. The scheme was originally developed by Hauglustaine
et al., 2014). The impetus for explicitly representing NH4        et al. (2014) for use in the LMDZ-INCA climate model and
and NO3 in GCMs is clear, even by using simple ther-              then adapted for ECMWF’s version of GLOMAP-mode by
modynamic equilibrium approaches which bypass tempo-              Rémy et al. (2019), following which it was kindly provided
ral nuances in the gas–particulate partitioning. The Met          to the Met Office for adaptation to the UM. In Sect. 2.1, we
Office Unified Model (UM) has previously incorporated a           describe the configuration of the UM used to test the new ni-
thermodynamic-equilibrium ammonium nitrate scheme in              trate scheme. In Sect. 2.2, we describe the thermodynamic
the CMIP5-generation climate model Hadley Centre Global           equilibrium nitrate model in detail. In Sect. 2.3, we describe
Environment Model version 2 (HadGEM2-ES) (Bellouin et             the simulations performed in this study. In Sect. 3, we eval-
al., 2011). This nitrate scheme – developed within the single-    uate the model using surface and satellite observations and
moment Coupled Large-scale Aerosol Simulator for Stud-            investigate the sensitivity of the model to perturbations to a
ies in Climate (CLASSIC) aerosol framework (Bellouin et           key parameter – the HNO3 uptake coefficient (γ ) – in a man-
al., 2011) – continues to be utilised for online air qual-        ner analogous to Bauer et al. (2004). In Sect. 4, we discuss
ity forecasts across the UK in the operational Air Qual-          the utility of the nitrate scheme and provide a roadmap for
ity Unified Model (AQUM) (Savage et al., 2013). How-              future development and integration within UKESM.
ever, the CMIP6-generation state-of-the-art United Kingdom
Earth System Model version 1 (UKESM1) which incorpo-
rates the Global Atmosphere model vn7.1 (GA7.1) (Walters
et al., 2019) replaced the single-moment CLASSIC aerosol
scheme with the double-moment Global Model of Aerosol
Processes modal (GLOMAP-mode) scheme which currently

https://doi.org/10.5194/acp-21-15901-2021                                       Atmos. Chem. Phys., 21, 15901–15927, 2021
15904 A. C. Jones et al.: Sensitivity of nitrate to nitric acid uptake rate
2 Methods super-micron sizes (nucleation, Aitken, accumulation, and
coarse), as well an insoluble Aitken mode (see Table 1)
2.1 The Met Office Unified Model (UM) (Mann et al., 2010; Mulcahy et al., 2020). The variable
size distribution allows the median dry radius to evolve
The nitrate scheme was originally developed using the within prescribed size brackets, while the lognormal stan-
UM with the science configurations Global Atmosphere dard deviation or “mode width” is held fixed. GA7.1’s default
vn7.1 (GA7.1) and Global Land vn7.0 (GL7.0) (Walters et GLOMAP-mode configuration includes the aerosols sulfate
al., 2019). Although the UM can be run at various resolu- (SO4 ), black carbon (BC), organic matter (OM), and sea salt
tions, the resolution used here is the climate configuration (SS), with species in each mode treated as an internal mix-
N96L85, i.e. 1.875◦ longitude by 1.25◦ latitude with 85 ver- ture. Mineral dust is represented in GA7.1 by the CLAS-
tical levels up to a model lid at 80 km, with 50 levels below SIC six-bin scheme described by Woodward et al. (2001).
18 km altitude, and a model time step of 20 min (Walters et Aerosol water content is simulated prognostically using the
al., 2019). Further details of the UM configuration are pro- Zdanovskii–Stokes–Robinson (ZSR) method, allowing for a
vided in Sect. S1 in the Supplement. more accurate representation of aerosol–cloud interactions
In the model configuration used here, GA7.1 includes the and aerosol radiative impact than in CLASSIC. The direct
United Kingdom Aerosol and Chemistry (UKCA) model aerosol radiative effect is modelled using UKCA-RADAER,
which simulates atmospheric composition in the Earth Sys- which utilises pre-determined look-up tables of Mie extinc-
tem, with UKCA chemistry called once per model hour tion parameters based on aerosol size and composition (Bel-
in N96L85, although emissions are evaluated every model louin et al., 2013).
time step (Archibald et al., 2020). UKCA is coupled to
the GLOMAP-mode aerosol scheme, permitting a holis- 2.2 Nitrate model
tic and prognostic treatment of aerosol and chemical pro-
cesses over the entire atmosphere (Mann et al., 2010; Mulc- In addition to the standard aerosols in GA7.1 – SO4 , BC,
ahy et al., 2020). The coupled UKCA and GLOMAP-mode OM, and SS – ammonium (NH4 ), nitrate (NO3 ), and coarse
model is widely referred to as UKCA-mode. The Met Of- nitrate (herein denoted coarseNO3 for convenience) are
fice’s Hadley Centre Global Climate version 3.1 (HadGEM3- added to a new UKCA-mode setup which comprises 28
GC3.1) model – the physical basis of UKESM1 – uses a sim- aerosol tracers in total (Table 1). Note that “NO3 ” refers
plified UKCA chemistry configuration with important oxi- solely to NO3 associated with NH4 , while “coarseNO3 ”
dants (O3 , OH, NO3 , HO2 ) prescribed as monthly-mean cli- refers to NO3 associated with dust and sea salt. NH4 and NO3
matologies (Walters et al., 2019; Mulcahy et al., 2020). This mass is emitted into the Aitken and accumulation soluble
is of insufficient complexity for ammonium nitrate aerosol, modes and may be transferred to the coarse soluble mode via
given the importance of missing gases (i.e. HNO3 , NH3 aerosol processing, while coarseNO3 is limited to the accu-
and precursors) and chemical reactions. Instead the com- mulation and coarse soluble modes. Nitrate chemistry is eval-
bined Stratosphere–Troposphere version 1.0 (StratTrop1.0) uated once per model time step within the UKCA emissions-
chemistry scheme, which is included in UKESM1 (Sellar et control routine. The nitrate model closely follows Hauglus-
al., 2019) and described in detail by Archibald et al. (2020), taine et al. (2014) and Rémy et al. (2019) with subtle yet
is utilised here. Although not mentioned in Archibald et important differences. An exhaustive step-by-step methodol-
al. (2020), gaseous ammonia (NH3 ) is a passive tracer in ogy is provided in the Supplement (Sects. S2 and S3) and
StratTrop1.0, while gaseous nitric acid (HNO3 ) is the prod- outlined below.
uct of various atmospheric chemical reactions (see Table S1
in the Supplement). Further details of the nitrogen chemistry 2.2.1 Ammonium nitrate production
in StratTrop1.0 is provided in Sect. 2.2. Gaseous dissolution
in cloud droplets is modelled using the effective Henry’s law Fine-mode ammonium nitrate production is evaluated be-
framework, with UKCA uniformly assuming a fixed cloud fore the condensation of HNO3 onto coarse aerosols (e.g.
water pH of 5.0. We address the assumption of a fixed pH in sea salt and dust), because smaller particles generally reach
Sect. 4. Values required to calculate the effective Henry’s law thermodynamic equilibrium faster (Hauglustaine et al., 2014;
coefficients are specified as KH (298 K) = 2.1 × 10⁵ , 1.23, Benduhn et al., 2016). Firstly, the sulfate neutralisation state
and 1 × 10⁶ M atm−1 for HNO3 , SO2 , and NH3 respectively, (0SO4 ) isdetermined from the total moles of ammonia (TA =
and −1H /R = 8700, 3020, and 0 K−1 for HNO3 , SO2 , and {NH3 }+ NH+ 4 ) and total moles of sulfate (TS = {SO4 }) us-
NH3 respectively (Archibald et al., 2020). The values for ing Eq. (1) (Metzger et al., 2002).
NH3 are comparable to AeroCom phase III values given in
Table 5 in Bian et al. (2017). 0SO4 =
GLOMAP-mode is a prognostic double-moment aerosol 2 2TS < TA 2NH3 + H2 SO4 → (NH4 )2 SO4
scheme that carries aerosol mass and number concentrations 1.5 TS < TA < 2 TS 3NH3 + 2H2 SO4 → (NH4 )3 H(SO4 )2 (1)
in four soluble lognormal modes spanning sub-micron to
1 TA < T S NH3 + H2 SO4 → (NH4 )HSO4
Atmos. Chem. Phys., 21, 15901–15927, 2021 https://doi.org/10.5194/acp-21-15901-2021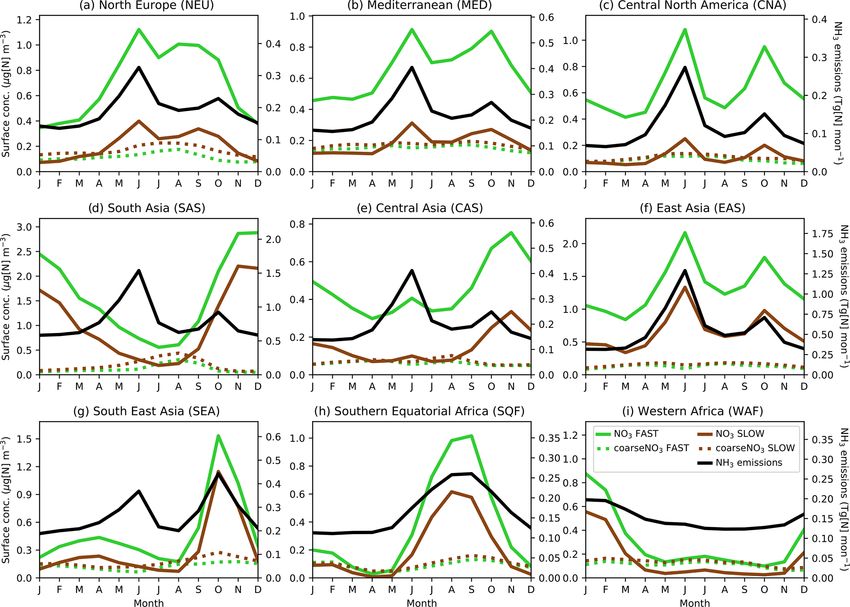
A. C. Jones et al.: Sensitivity of nitrate to nitric acid uptake rate                                                               15905

Table 1. Properties of the aerosol size distribution in the nitrate UKCA-mode setup including the size range of the modes, the geometric
standard deviation, and the permitted aerosol species in each mode. Species include sulfate (SO4 ), black carbon (BC), organic matter (OM),
and sea salt (SS) as well as the newly added ammonium (NH4 ), nitrate (NO3 ), and coarse nitrate (coarseNO3 ). Adapted from Table 1 in
Mulcahy et al. (2020).

              Aerosol mode             Geometric mean      Geometric standard     Species
                                       diameter D (nm)          deviation σg
              Nucleation soluble                  1–10                    1.59    SO4 , OM
              Aitken soluble                    10–100                    1.59    SO4 , BC, OM, NH4 , NO3
              Accumulation soluble            100–1000                     1.4    SO4 , BC, OM, SS, NH4 , NO3 , coarseNO3
              Coarse soluble                    > 1000                     2.0    SO4 , BC, OM, SS, NH4 , NO3 , coarseNO3
              Aitken insoluble                  10–100                    1.59    BC, OM

The moles of ammonia available for neutralisation of HNO3               0.1 µm to ∼ 1 h for diameters of 0.5 µm, depending on the
following the irreversible production of ammonium sulfate               uptake rate. Rémy et al. (2019) assumed a globally uniform
is then TA∗ = TA − 0SO4 TS . If all free ammonia is consumed            equilibration time of τ = 2 min in their nitrate model. Here
by the neutralisation of SO4 (TA∗ = 0), then no new nitrate             the uptake rate kHNO3 is determined for each aerosol mode
is formed. However, if ammonia is available (TA∗ > 0), then             online (Aitken, accumulation, and coarse soluble) using the
the equilibrium constant (Kp ) of the ammonia–nitrate sys-              first-order uptake theory of Schwartz (1986) and by applying
tem (Eq. 2) is determined using the parameterisation of                 the Fuchs and Sutugin (1970) correction factors for molec-
Mozurkewich (1993) (see Sect. S2). In this formulation, Kp              ular effects and for limitations in interfacial mass transport
is solely a function of temperature and deliquescence relative          (Eqs. 4–7).
humidity (DRH), with DRH following the parameterisation                                                      1
of Seinfeld and Pandis (1998).                                                  3         ma Ra T   ma + mHNO3 2
                                                                        Dg =                      ×              ,                     (4)
                                                                             8Ac ρa da2      2π       mHNO3
                 Kp
HNO3 + NH3 ←→ NH4 NO3                                          (2)          3Dg         3Dg
                                                                        λ=      =q              ,                                      (5)
                                                                             υ           8Ra T
The equilibrium concentration of ammonium nitrate is then                                πmHNO3
calculated using the formulation from Seinfeld and Pandis                    2λ
(1998). Letting TN denote                                               Kn =    ,                                                      (6)
                           the total molar concentration of                 D
nitrate (TN = {HNO3 } + NO−   3 ), if the available nitrate and                           2π DDg
ammonia suggest that Eq. (2) is in the forward direction,               kHNO3 =                        .                             (7)
                                                                                                  0.47γ
thereby promoting the condensation of HNO3 and NH3 to                             1 + 4Kn
                                                                                       3γ  ×  1 − 1+Kn
form NH4 NO3 (TA∗ TN > Kp ), then the equilibrium concen-
tration of NH4 NO3 is solved using Eq. (3). Otherwise, if               Equations (4)–(7) determine the molecular diffusivity coef-
free ammonia or nitrate concentrations are limited such that            ficient (Dg , m2 s−1 ), the mean free path (λ, m), the Knud-
TA∗ TN ≤ Kp or TA∗ = 0, then all existing ammonium nitrate              sen number (Kn)., and the modal condensation or uptake rate
aerosol evaporates, and the corresponding mass is transferred           (kHNO3 , m3 s−1 ) respectively. Constants in the algorithm in-
to the gas phase HNO3 and NH3 .                                         clude the Avogadro constant Ac = 6.022 × 10²³ mol−1 , the
                                                                        gas constant of dry air Ra = 8.314 J mol−1 K−1 , the molar
{NH4 NO3 }eq                                                            mass of dry air ma = 0.029 kg mol−1 , the molar mass of
                                                                      HNO3 mHNO3 = 0.063 kg mol−1 , the molecular diameter of
   1
               q
                       2
        ∗        ∗              ∗                                       dry air molecules da = 4.5 × 10⁻¹⁰ m, and the reactive up-

 =     T + TN − TA + TN − 4 TN TA − Kp                         (3)
   2 A                                                                  take coefficient (γ ) for HNO3 . Variables in Eqs. (4)–(7) in-
The ammonia–nitrate system may not reach equilibrium                    clude the air temperature T (K) and air density ρa (kg m−3 ).
within a standard GCM time step owing to transport limi-                In Eq. (5), υ is the mean molecular speed (m s−1 ). The to-
tations between the gas and aerosol phases (Wexler and Se-              tal equilibration time τ (s) may then be related to the inverse
infeld, 1990). The time taken to reach equilibrium depends              of product of the uptake rate for one particle kHNO3 and the
on ambient temperature and RH, as well as the aerosol size              aerosol number concentration N using Eq. (8). Note that am-
and uptake coefficient (γ ), where the uptake coefficient is            monium nitrate production is limited to the Aitken and accu-
defined as the number of gas molecules condensing on a                  mulation modes in this study, which is reflected in the for-
particle divided by the number impacting onto the particle              mulation of τ .
surface. Ackermann et al. (1995) find that equilibration time                                 1
(τ ) may range from ∼ 2 min for particles with diameters of             τ=                                                             (8)
                                                                             Nait kHNO3 ,ait + Nacc kHNO3 ,acc

https://doi.org/10.5194/acp-21-15901-2021                                              Atmos. Chem. Phys., 21, 15901–15927, 2021
15906                                                       A. C. Jones et al.: Sensitivity of nitrate to nitric acid uptake rate

Rather than assume instantaneous thermodynamic equilib-            Aitken to coarse soluble modes is instantaneously transferred
rium in the ammonia–nitrate system, the model assumes an           to the gas phase. Ammonium nitrate chemistry primarily in-
exponential decay of the gas phase towards equilibrium us-         volves condensation and evaporation (Makar et al., 1998;
ing the equilibration time τ (see Sect. S2.4). This approach       Benduhn et al., 2016), although Wang et al. (2020) have
has also been used by Ackermann et al. (1995), Makar et            shown that NH3 and HNO3 can condense onto nanoparti-
al. (1998), and Rémy et al. (2019). Figure S2 shows the re-        cles and thus contribute to nucleation events, which may be
sults of applying the above algorithm for τ (with γ set to         of importance in urban settings and at high altitudes. In this
0.193 following Feng and Penner, 2007) to monthly-mean             model, aerosol number concentrations are not altered explic-
aerosol and meteorology output from example UM integra-            itly by nitrate chemistry (assuming condensation and evapo-
tions. Over many land regions, τ is approximately 2 min            ration are more important than nucleation) but may change
near the surface and increases to ∼ 15 min at a model level        indirectly due to altered coagulation and mode-merging rates
height of 3000 m. Therefore, assuming a constant value of          arising from the additional aerosol mass. This approach dif-
τ = 2 min, as assumed by Rémy et al. (2019), may signifi-          fers from Hauglustaine et al. (2014) and Rémy et al. (2019),
cantly overestimate the rate which the ammonia–nitrate sys-        who assume that new particles are nucleated by the produc-
tem approaches equilibrium, particularly at higher altitudes       tion of ammonium nitrate.
and over maritime regions. For example, in a 20 min time
step the ammonia–nitrate system would move 99.995 % of             2.2.2   Coarse nitrate production
the way from initial conditions towards equilibrium with
τ = 2 min assuming exponential decay, but only 86 % of the         Following NH4 NO3 production and the associated update to
way with τ = 10 min and 33 % of the way with τ = 50 min.           HNO3 concentrations, the first-order uptake parameterisation
   For standard atmospheric conditions (Dg = 10−5 m2 s−1           described by Eqs. (4)–(7) is further employed to model the
and υ = 300 m s−1 ), kHNO3 scales approximately linearly           irreversible uptake of HNO3 on sea salt and dust to produce
with the reactive uptake coefficient γ , for γ from 0.001          NaNO3 (Eq. 9) and Ca(NO3 )2 (Eq. 10) respectively (Liao et
to 0.2 and for particle diameters between D = 0.1 µm and           al., 2003; Hauglustaine et al., 2014).
D = 5 µm (Fig. S3). The uptake rate increases on a particle-       HNO3 + NaCl → NaNO3 + HCl,                                  (9)
by-particle basis with diameter, for example, ranging from
                                                                   2HNO3 + CaCO3 → Ca(NO3 )2 + H2 CO3 .                       (10)
0.2 s−1 for D = 0.1 µm to 5 s−1 for D = 0.5 µm when γ =
0.1 and when kHNO3 is normalised by N = 1012 m−3 . How-            The methodology is mostly unchanged from Hauglustaine et
ever, atmospheric Aitken mode number concentrations gen-           al. (2014) and Rémy et al. (2019), with only subtle adapta-
erally exceed accumulation mode concentrations, particu-           tions needed to integrate the scheme within UKCA-mode. As
larly over populous land regions and increasingly with al-         in Hauglustaine et al. (2014), the HNO3 uptake coefficients
titude. Exceptions to this include near the surface over high-     (γ ) for dust and sea salt are RH-dependent variables based on
latitude maritime regions, Amazonia, and much of Aus-              measurements from Fairlie et al. (2010) for dust and Sander
tralasia, where accumulation number concentration exceeds          et al. (2011) for sea salt. Additionally, dust is assumed to
Aitken concentrations on an annual-mean basis in the UM.           uniformly constitute 5 % Ca2+ by mass as in Hauglustaine
In example UM integrations,the ratio of accumulation to           et al. (2014), which differs from the approach in Rémy et
Aitken uptake (Nacc kHNO3 ,acc Nait kHNO3 ,ait ) decreases on a    al. (2019), who used a spatially heterogeneous Ca2+ frac-
global-mean basis from 8 at the surface to 1.4 at a model          tion more akin to observations. Dust alkalinity is titrated by
level height of 3000 m, but it is effectively unity at the sur-    uptake of HNO3 until the dust pH is neutralised whereupon
face over key NH3 - and NOx -emitting regions such as the          HNO3 stops condensing (Fairlie et al., 2010; Hauglustaine et
USA, Europe, and South Asia (Fig. S4).                             al., 2014), while no such limitation is necessary for sea salt
   Uptake rates (kHNO3 , Eq. 7) are determined for the Aitken      which generally constitutes a higher fraction of Na+ ions per
and accumulation modes by using the modal geometric-mean           mass than dust constitutes Ca2+ (e.g. Xiao et al., 2018).
dry diameters for D in Eqs. (4)–(7), which are first corrected        As for the first-order uptake parameterisation for ammo-
for hygroscopic growth using the RH-dependent parameter-           nium nitrate (Sect. 2.2.1) and in Rémy et al. (2019) rather
isation by Gerber et al. (1985). This simplified “modal” ap-       than explicitly integrating the uptake rate over the aerosol
proach differs from Hauglustaine et al. (2014), who divide         size distribution, kHNO3 is calculated individually for sea salt
aerosol size modes into sub-bins. If the available nitrate and     in the accumulation and coarse modes using the modal
ammonia suggest that the equilibrium of Reaction (R2) is in        geometric-mean diameters for D in Eqs. (4)–(7) and indi-
the forward direction, thereby promoting the condensation of       vidually for each CLASSIC dust bin using fixed geometric-
HNO3 and NH3 to form NH4 NO3 (TA∗ TN > Kp ), then mass             mean diameters (see Sect. S3). Sea-salt number concen-
is transferred from the gaseous reactants NH3 and HNO3 to          trations for the two modes are inversely determined from
NH4 and NO3 in the Aitken and accumulation soluble modes           the sea-salt mass concentrations and the modal geometric-
using the above algorithm. Otherwise, if TA∗ TN ≤ Kp , then        mean dry diameters, which implicitly assumes that sea salt
NH4 and NO3 dissociate, and all NH4 and NO3 mass in the            is externally mixed with other UKCA-mode aerosols. Dust

Atmos. Chem. Phys., 21, 15901–15927, 2021                                          https://doi.org/10.5194/acp-21-15901-2021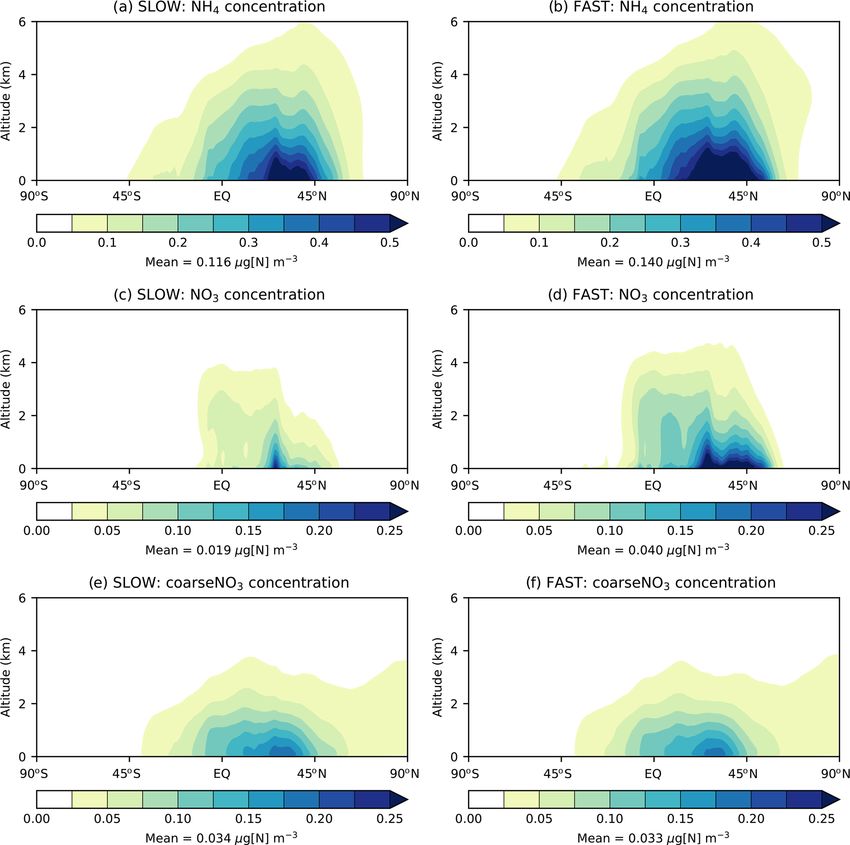
A. C. Jones et al.: Sensitivity of nitrate to nitric acid uptake rate                                                     15907

particle number concentrations are determined from prog-          the tabulated data by Palik and Khanna (1998) and refer-
nostic dust mass concentrations and fixed size distributions      ences therein for solid birefringent NaNO3 crystals. From
for each bin. Mapping between CLASSIC’s six dust bins             0.23–0.42 µm, imaginary RIs are determined by applying
and UKCA-mode’s two size modes follows the approach               the Beer–Lambert law to Cleaver et al. (1963) absorption
currently used to map dust emissions between CLASSIC              coefficients and assuming a lattice thickness of 3 µm, as in
and UKCA-mode, with bin 2 and half of bin 3 mapped                Jacobson (1999). This approach is necessary to account for
to the accumulation mode and the other half of bin 3 and          the second UV absorption peak missing in the data of Palik
bins 4, 5, and 6 mapped to the coarse mode. The dust and          and Khanna (1998). Imaginary RIs for wavelength spectrum
sea-salt uptake rates (k) multiplied by the equivalent parti-     0.42–5.88 µm appear not to have been measured and are
cle number concentrations (N) are then used to determine          pragmatically set to the observed values for NH4 NO3 ,
tendencies to mass concentrations of coarse NO3 aerosol           which are from Gosse et al. (1997) for 0.7–2 µm and from
(coarseNO3 ), sea salt (SS), and HNO3 gas (Eqs. 11–13).           Jarzembski et al. (2003) for 2–5.88 µm. As is the case
The constants in Eqs. (11)–(13) include the molar mass            for NH4 NO3 , imaginary RIs are set to an arbitrary small
of Ca(NO3 )2 mCa(NO3 )2 = 0.164 kg mol−1 , the molar mass         number (1 × 10⁻⁸ ) from 0.42–0.7 µm to reflect the little or
of NaNO3 mNaNO3 = 0.084 kg mol−1 , the molar mass of              no absorption in that spectrum (Palik and Khanna, 1998).
HNO3 mHNO3 = 0.063 kg mol−1 , and the molar mass of               For the real RIs, in the 0.4–0.65 µm spectrum values are
NaCl mNaCl = 0.05844 kg mol−1 .                                   from Cotterell et al. (2017) for measurements at 0 % relative
                                                                humidity. From 0.66–0.67 µm, the real RIs are provided
1 coarseNO3                                                       by Ballard et al. (1972) and for 0.7 µm from Ivlev and
       1t                                                         Popova (1972). Above wavelengths of 1 mm – the scope

                             mCa(NO3 )2                          of the Palik and Khanna (1998) database – the real and
 = N kdu,ACC + N kdu,COA ×                                        imaginary RIs are set to the value at 1 mm. The compiled
                                   mHNO3
                                                                 spectral RIs for NH4 NO3 and NaNO3 are shown in Fig. S5
                             mNaNO3                            and tabulated in Tables S2 and S3.
  + N kSS,ACC + N kSS,COA ×                 × HNO3 , (11)
                                  mHNO3                              The default configuration of UKCA-mode and by exten-
                                                                  sion UKCA-RADAER, as used in UKESM1 and HadGEM3-

1 HNO3
            = − 2 × N kdu,ACC + N kdu,COA                         GC3.1, represents tropospheric SO4 with (NH4 )2 SO4 refrac-
    1t
                                                                 tive indices and (optionally) stratospheric SO4 with sulfuric
                                                               acid (H2 SO4 ) refractive indices. This is internally inconsis-
  + N kSS,ACC + N kSS,COA × HNO3 ,                      (12)
                                                                  tent given that the tropospheric SO4 is missing the consid-

1 SS                         mNaCl                             erable mass associated with NH4 . The new UKCA-mode ni-
     = − NkSS,ACC + NkSS,COA ×       × HNO3 . (13)                trate configuration presented here that includes SO4 , NO3 ,
 1t                            mHNO3
                                                                  and NH4 as separate tracers firstly apportions NH4 mass to
2.2.3   Technical UM modifications                                NO3 using a 1 : 1 molar ratio and the NH4 remainder to
                                                                  SO4 using a 2 : 1 molar ratio (represented by NH4 NO3 and
UKCA-RADAER calculates 3D aerosol extinction proper-              (NH4 )2 SO4 refractive indices respectively), and then it rep-
ties for each lognormal mode online as a function of aerosol      resents remaining SO4 mass with H2 SO4 refractive indices.
composition and size, which are then utilised directly within     Another internal inconsistency in the default UKCA-mode
the UM’s radiative transfer code (Bellouin et al., 2013).         configuration is that NH4 is not explicitly represented dur-
Each aerosol species requires prescribed spectral refractive      ing hygroscopic growth (i.e. in the ZSR algorithm), owing to
indices (RIs) spanning the electromagnetic spectrum from          the lack of an NH4 tracer. In the new nitrate scheme, NH4 ,
ultraviolet (0.2 µm) to radio waves (1 cm). Ammonium ni-          NO3 , and coarseNO3 are explicitly added to the hygroscopic
trate RIs have previously been compiled for an older gener-       growth routine, with NH4 counteracting hygroscopic aerosol
ation of the UM (HadGEM2-ES) (Bellouin et al., 2011). For         growth and NO3 and coarseNO3 promoting it.
NH4 NO3 , real and imaginary RIs for the wavelength spec-
trum 2–20 µm are taken from Jarzembski et al. (2003), while       2.3   Simulation design
RIs for > 20 µm are assumed to be that at 20 µm. Real RIs
for 0.59–1.61 µm are from the CRC Handbook of Chemistry           The scientific purpose of this study is to investigate whether
and Physics (Weast, 1971) and are then extended to cover the      representing the kinetic limitation of HNO3 condensation
0.1–2 µm spectrum. Imaginary RIs for the ultraviolet and vis-     onto pre-existing aerosols during the production of ammo-
ible spectra (< 0.7 µm) are arbitrarily set to a small number     nium nitrate significantly alters the resulting atmospheric
assuming little absorption (1 × 10⁻⁸ ).                           concentrations of ammonium nitrate and, indirectly, coarse
   To optically represent the coarse NO3 aggregate                nitrate aerosol. To this end, four sensitivity simulations
coarseNO3 , NaNO3 spectral RIs have been compiled                 are performed with the UM and the new nitrate scheme:
from the literature for this study. RI values are mostly from     (1) a control simulation with no nitrate aerosol and the de-

https://doi.org/10.5194/acp-21-15901-2021                                       Atmos. Chem. Phys., 21, 15901–15927, 2021
15908 A. C. Jones et al.: Sensitivity of nitrate to nitric acid uptake rate
Table 2. A description of the UM simulations performed in this study.
Simulation name Description
CNTL Control simulation – no nitrate aerosols
INSTANT Nitrate aerosols – instantaneous equilibrium for NH4 NO3 (τ = 0 in Eq. 8)
FAST Nitrate aerosols – fast uptake coefficient for NH4 NO3 (γ = 0.193 in Eq. 7)
SLOW Nitrate aerosols – slow uptake coefficient for NH4 NO3 (γ = 0.001 in Eq. 7)
fault UKCA-mode setup 2 (i.e. standard GA7.1) (CNTL); emissions in these simulations – which account for 26 % of
(2) a simulation with NH4 NO3 reaching equilibrium instan- total NH3 emissions – follow Bouwman et al. (1997) and
taneously (INSTANT); (3) a simulation with the HNO3 up- biomass-burning emissions are described by van Marle et
take rate set to γ = 0.193 in Eq. (7) following Feng and al. (2017). NH3 exhibits a strong seasonal cycle with global
Penner (2007) (FAST); and (4) a simulation with the HNO3 emissions in June–August ∼ 50 % greater than in December–
uptake rate set to γ = 0.001 in Eq. (7) following Bauer et February (Fig. S6b). The global NH3 source of ∼ 65 Tg yr−1
al. (2007) (SLOW). These simulations are further listed in in these simulations is close to the model-mean value of
Table 2 and were selected to span the range of HNO3 up- 63 Tg yr−1 for GCMs participating in the AeroCom phase
take rates on standard atmospheric particles from the litera- III nitrate experiment (Bian et al., 2017). Nitrogen oxide
ture (Bauer et al., 2007). All simulations are run for 25 model (NOx ) emissions from anthropogenic, biomass-burning, and
years with only the last 20 years used for analysis. aircraft sources are prescribed as monthly fields from the
In these simulations, GA7.1 is forced by fixed sea-surface CEDS inventory (van Marle et al., 2017; Hoesly et al., 2018).
temperature and sea-ice fields prescribed as monthly clima- NOx emissions from soils are taken from Yienger and Levy
tologies for the year 2000, created by averaging over 1995– (1995), corrected to a total source of 12 Tg[NO] yr−1 (Sel-
2004 the time series data generated for CMIP6 atmosphere- lar et al., 2020). The global and annual total NOx emis-
only simulations. Additionally, aerosol and gaseous emis- sions amount to 106 Tg[NO] yr−1 . Further details on gas
sions are primarily prescribed as monthly fields from the and aerosol emissions in these simulations are provided in
CMIP6 historical emissions inventory (DECK/Historical Sect. S4.
CMIP6 version 6.2.0), averaged over the 1995–2004 time-
period. Table S4 gives global and annual total emissions for
each of the UKCA chemical species. The CMIP6 emissions 3 Results
inventory was derived from the Community Emissions Data
System (CEDS) project which is documented by van Marle 3.1 Global and annual mean metrics
et al. (2017), Hoesly et al. (2018), and Feng et al. (2020);
while its integration within the UM is detailed by Sellar et Table 3 shows global tropospheric and annual mean budgets
al. (2020). The simulation design (i.e. perpetual year 2000 for HNO3 , NH3 , NO3 , and NH4 from the FAST and SLOW
conditions) follows standard simulation protocol for UKCA simulations alongside equivalent metrics from the present-
model development in the Met Office. day simulations of Xu and Penner (2012) (hereafter XP12),
Global anthropogenic NH3 emissions in the year 2000 Hauglustaine et al. (2014) (hereafter HA14), and from the
from CEDS amount to 50 Tg yr−1 , in vast excess of equiva- AeroCom model intercomparison project detailed by Bian
lent emissions from the CMIP5-derived MACCity inventory et al. (2017) (hereafter BI17). The INSTANT simulation is
of 37.5 Tg yr−1 (Granier et al., 2011). Hoesly et al. (2018) near-indistinguishable from FAST using these metrics (Ta-
attribute this disparity to differing assumptions in agricul- ble S5) – suggesting that NH4 NO3 concentrations in FAST
tural NH3 trends and to the lack of consideration for wastew- reach thermodynamic equilibrium near instantaneously – and
ater and human waste NH3 emissions in MACCity. Such INSTANT is thus omitted from further analysis. With respect
large discrepancies in NH3 emissions inventories can im- to Table 3 and to the rest of the Results section, “fine NO3 ”
pact direct model–measurement comparisons which make refers to NO3 associated with NH4 , while “coarse NO3 ”
it important to consider the spatial and temporal trends in refers to NO3 associated with dust and sea salt (i.e. NO3 in
concentrations rather than just the overall magnitudes. For coarseNO3 ).
this work exploring the sensitivity of NH4 NO3 to thermo- The net HNO3 production rates in FAST (44.1 Tg[N] yr−1 )
dynamic equilibrium assumptions, the direct comparison of and SLOW (44.2 Tg[N] yr−1 ) are comparable to equivalent
model performance to observations is done with the goal rates in HA14 (45.1 Tg[N] yr−1 ) and XP12 (38 Tg[N] yr−1 ).
of understanding the degree to which thermodynamic as- Additionally, the NH3 emissions in FAST and SLOW
sumptions may push the model out of realistic behaviour (53.5 Tg[N] yr−1 ) are comparable to HA14, XP12, and BI14
rather than best recreating the observations. Oceanic NH3 (50.5, 53.6, and 51.8 Tg[N] yr−1 respectively), suggesting
that to a first-order approximation the ammonium and ni-
Atmos. Chem. Phys., 21, 15901–15927, 2021 https://doi.org/10.5194/acp-21-15901-2021A. C. Jones et al.: Sensitivity of nitrate to nitric acid uptake rate 15909
Table 3. Global and annual-mean metrics for nitric acid (HNO3 ), nitrate (NO3 ), ammonia (NH3 ) and ammonium (NH4 ) in the FAST and
SLOW simulations compared to Xu and Penner (2012) (XP12), Hauglustaine et al. (2014) (HA14), and the AeroCom phase III model
intercomparison project described in Bian et al. (2017) (BI17). Square brackets in the BI17 column denoted the AeroCom inter-model range.
FAST SLOW XP12 HA14 BI17
HNO3 Source Gas phase Tg[N] yr−1 35.2 35.7 24.4 44.6 [82, 92]
Aerosol phase 18.6 18.2 17.9 3.9 [4.7, 28.5]
Total 53.8 53.9 42.3 48.5 –
Loss Gas phase Tg[N] yr−1 9.7 9.7 4.3 3.4 [47, 66]
Fine nitrate 6.4 2.7 8.8 3.2 [2, 9.5]
Coarse nitrate 16.6 17.3 7.2 11.2 –
Dry deposition 6 8 7.8 14.7 10.9 [8, 16.4]
Wet deposition 14.9 5.8 14.5 17 25.1 [11, 37.2]
Total 53.4 53.4 42.6 49.5 –
Wet fraction % 71.4 66.4 65 53.6 68.6 [57.8, 76.3]
Burden Tg[N] 0.48 0.48 0.3 0.3 0.56 [0.15, 1.27]
Lifetime days 3.2 3.2 4.8 2.3 [3.5, 5.7]
NO3 Source Fine nitrate Tg[N] yr−1 6.3 2.7 8.8 3.2 –
Coarse nitrate 16.6 17.3 7.2 11.2 –
Total 22.9 19.9 16 14.4 13.7 [1.5, 28.2]
Loss Dry deposition Tg[N] yr−1 8.9 8.3 4 1.7 4.7 [0.3, 10.8]
Wet deposition 14.3 11.8 12 12.7 9.9 [1.2, 20.5]
Total 23.2 20.1 16 14.4 13.7 [1.5, 28.3]
Wet fraction % 61.7 58.6 75 88.2 77 [56.3, 90.8]
Burden Fine nitrate Tg[N] 0.11 0.05 0.09 0.05 –
Coarse nitrate 0.09 0.1 0.08 0.13 –
Total 0.2 0.15 0.17 0.18 0.14 [0.03, 0.42]
Lifetime Fine nitrate days 6.2 7.2 3.7 5.6 –
Coarse nitrate 2 2 4 4.2 –
Total 3.2 2.7 3.9 4.6 5 [2, 7.8]
NH3 Source Emissions Tg[N] yr−1 53.5 53.5 53.6 50.5 51.8 [46.9, 58.1]
Loss Gas phase Tg[N] yr−1 – – – 0.6 –
NH4 formation 30.4 25.6 30.5 17.5 26.4 [18.4, 34.6]
Dry deposition 17.4 20.4 12.7 21.3 15.4 [10.4, 24.1]
Wet deposition 5.7 7.5 9.6 11.1 1 [5.6, 15.3]
Total 53.4 53.5 53.6 50.5 53.2 [49.8, 57.9]
Wet fraction % 24.6 27 43 34.3 40.7 [24.5, 58.1]
Burden Tg[N] 0.04 0.06 0.07 0.09 0.16 [0.04, 0.7]
Lifetime days 0.28 0.41 0.46 0.63 0.72 [0.29, 0.98]
NH4 Source NH3 conversion Tg[N] yr−1 30.4 25.6 30.5 17.5 23.7 [17.8, 29.5]
Loss Dry deposition Tg[N] yr−1 5.7 4.7 4.5 2.5 4.5 [1.3, 16.3]
Wet deposition 24.9 21 25.9 14.9 20.7 [5.6, 34.6]
Total 30.5 25.7 30.4 17.4 25.2 [17.7, 37.4]
Wet fraction % 81.4 81.8 85.2 85.6 81 [25.6, 94.7]
Burden Tg[N] 0.42 0.36 0.26 0.22 0.25 [0.13, 0.58]
Lifetime days 5 5 3.2 4.5 4.3 [1.9, 9.8]
https://doi.org/10.5194/acp-21-15901-2021 Atmos. Chem. Phys., 21, 15901–15927, 202115910 A. C. Jones et al.: Sensitivity of nitrate to nitric acid uptake rate
trate precursor gas emissions are commensurate on a global 3.2 Annual mean burdens and concentrations
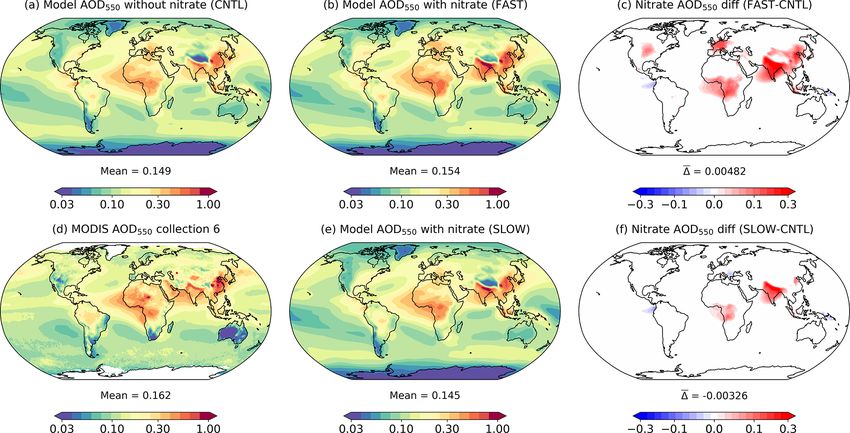
basis with prior studies. Total NO3 (i.e. fine + coarse)
production in the FAST (22.9 Tg[N] yr−1 ) and SLOW Figure 1 shows the annual-mean mass burdens of NH4 , fine
(19.9 Tg[N] yr−1 ) simulations is significantly greater than in NO3 , and coarse NO3 in the FAST and SLOW simulations.
HA14 (14.4 Tg[N] yr−1 ) and XP12 (16 Tg[N] yr−1 ) and at While units of the format “mg[N] m−2 ” are used in Fig. 1
the upper range of the AeroCom models in BI17 (mean = and throughout the rest of the Results section, units of the
13.7, range = 1.5 to 28.2 Tg[N] yr−1 ). This is also the case format “mg[NO3 ] m−2 ” are used in the following text for di-
for NH4 production rates where FAST (30.4 Tg[N] yr−1 ) rect comparison with HA14. Fine NO3 associated with NH4
and SLOW (25.6 Tg[N] yr−1 ) exceed equivalent values in is concentrated over land regions, particularly in the Northern
HA14 (17.5 Tg[N] yr−1 ) and BI17 (mean = 23.7, range = Hemisphere. The fine NO3 burden averaged over European
17.8 to 29.5 Tg[N] yr−1 ) and are comparable with XP12 land is 1 mg[NO3 ] m−2 in SLOW and 3 mg[NO3 ] m−2 in
(30.5 Tg[N] yr−1 ). This suggests that NH4 and NO3 aerosol FAST. The total NO3 burden over Europe is 3 mg[NO3 ] m−2
production in the UM is at the upper end of efficiency when in SLOW and 5 mg[NO3 ] m−3 in FAST, which is close to
compared to other existing climate models. the simulated present-day values of 3–4 mg[NO3 ] m−2 in
Significant differences between the FAST and SLOW sim- HA14. Fine NO3 peaks in Europe over the Mediterranean
ulations are highlighted by the global NO3 metrics in Table 3. at 5 mg[NO3 ] m−2 in SLOW and 12 mg[NO3 ] m−2 in FAST.
In particular, the fine NO3 source is 6.3 Tg[N] yr−1 in FAST South Asia exhibits the greatest regional fine NO3 bur-
but only 2.7 Tg[N] yr−1 in SLOW, marking a 57 % decrease. dens with 8 mg[NO3 ] m−2 in SLOW and 14 mg[NO3 ] m−2
Conversely, SLOW exhibits 5 % more coarse NO3 produc- in FAST. The total NO3 burdens over South Asia of
tion than in FAST, which is likely due to the surplus HNO3 11 mg[NO3 ] m−2 in SLOW and 15 mg[NO3 ] m−2 in FAST
in SLOW owing to there being less fine NO3 production. The are somewhat greater than equivalent values in HA14 of
difference is equally discernible in the burdens, with 47 % of 5–10 mg[NO3 ] m−2 . Conversely, the total NO3 concentra-
the total NO3 burden as coarse NO3 in FAST compared to tions in East Asia (China) are smaller in these simulations (5
67 % in SLOW. This can be compared to a 72 % coarse frac- mg[NO3 ] m−2 in SLOW and 9 mg[NO3 ] m−2 in FAST) than
tion in HA14 and 47 % in XP12, suggesting that the FAST in HA14 (10–20 mg[NO3 ] m−2 ). Over central North Amer-
and SLOW coarse fractions are between the instantaneous ica (the USA), the total NO3 burden is 2 mg[NO3 ] m−2 in
thermodynamic equilibrium model of HA14 and hybrid dy- SLOW and 5 mg[NO3 ] m−2 in FAST, which compares to 3–
namical nitrate scheme of XP12. Note though that intuitively 4 mg[NO3 ] m−2 in HA14. In summary, the fine-NO3 con-
the coarse ratio in FAST would be expected to be close to centrations are similar to the simulated present-day values
HA14 (given that FAST is indistinguishable from the IN- in HA14 on a regional basis in FAST and SLOW. Of more
STANT simulation), whereas it is closer to XP12, which is importance to this study, FAST exhibits twice as much fine
probably due to differences in the precursor gas concentra- NO3 burden on average as does SLOW in key industrialised
tions between FAST and HA14. land regions.
The total NO3 burdens of 0.2 Tg[N] in FAST and Whereas fine NO3 burdens are concentrated over land,
0.15 Tg[N] in SLOW are commensurate with 0.18 Tg[N] in coarse NO3 (i.e. coarseNO3 ) is more evenly spread over the
HA14, 0.17 Tg[N] in XP12, and the AeroCom median of Earth and prevalent over maritime areas where it forms on
0.14 Tg[N] in BI17. The NH3 burden in FAST (0.04 Tg[N]) sea salt and aged dust particles (Fig. 1g, h). Over European
is at the lower end of the AeroCom range in BI17 (0.04 to land, coarse NO3 constitutes 31 % of the total NO3 burden in
0.7 Tg[N]), while the NH4 burden in FAST (0.42 Tg[N]) is FAST and 63 % in SLOW. Equivalent figures for East Asia
at the upper range of BI17 models (0.13 to 0.58 Tg[N]), sug- are 15 % and 30 %, for South Asia are 10 % and 23 %, and
gesting that NH3 is more rapidly neutralised to aerosol in for eastern North America are 45 % and 83 % respectively.
the UM than in other GCMs. This corroborates the asser- Therefore, the partitioning of NO3 between the coarse and
tion that NH4 and NO3 aerosol production in the UM is at fine modes is highly sensitive to the uptake rate of HNO3 on
the upper end of efficiency when compared to other exist- ambient aerosol (γ in Eq. 7).
ing GCMs and suggests that NH3 rather than HNO3 is the Figure 2 shows maps of annual-mean near-surface concen-
limiting factor controlling NH4 NO3 production in these sim- trations of NH4 , fine NO3 , and coarse NO3 in the SLOW and
ulations, given that the NH3 burden in FAST is negligible. FAST simulations. The spatial distributions of fine NO3 are
In summary, Table 3 illustrates the close parity with regards similar to those reported in BI17 and HA14 with peak con-
global- and annual-mean metrics between the UM simula- centrations over North America, Europe, South Asia, South-
tions and previous nitrate simulations with various climate east Asia, and East Asia land regions, coincident with the
models from the literature and highlights the difference in highest NH3 and NOx emitting regions (Fig. S6). The av-
fine NO3 burdens between FAST and SLOW. erage total NO3 concentrations over Europe are 1.5 and
3.5 µg[NO3 ] m−3 in SLOW and FAST respectively, which
can be compared to 4–5 µg[NO3 ] m−3 in HA14. Over cen-
tral North America, total NO3 concentrations amount to 1
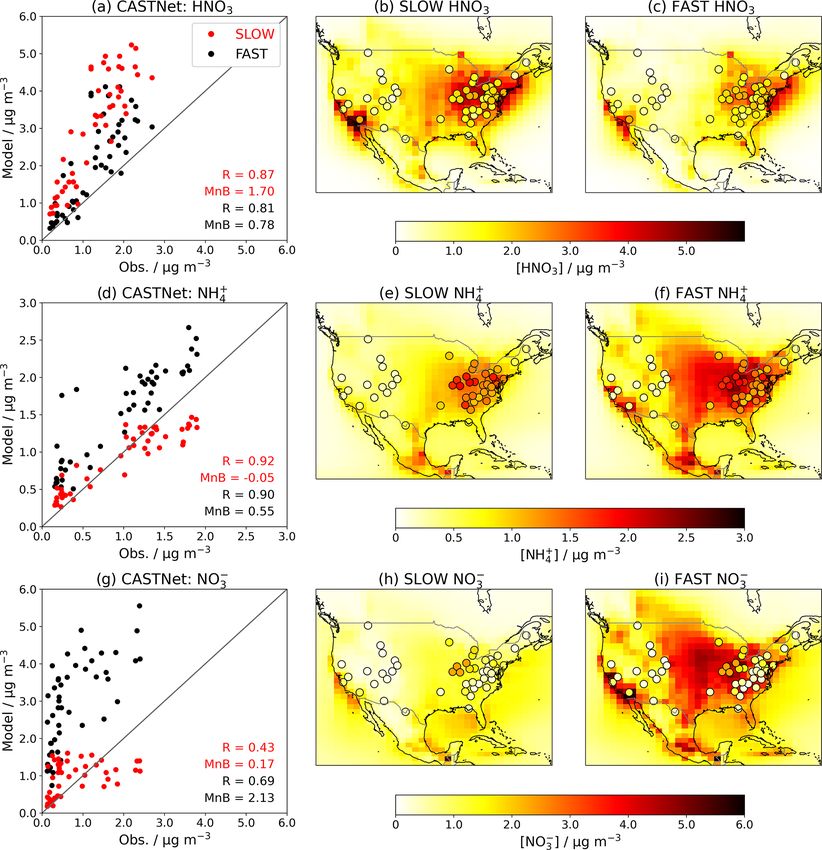
Atmos. Chem. Phys., 21, 15901–15927, 2021 https://doi.org/10.5194/acp-21-15901-2021A. C. Jones et al.: Sensitivity of nitrate to nitric acid uptake rate 15911 Figure 1. Annual-mean NH4 , NO3 , and coarseNO3 burdens from the SLOW and FAST simulations. and 3 µg[NO3 ] m−3 on average in SLOW and FAST, with ([NH3 ] + [NH4 ] − 2 × [SO4 ]) divided by ([HNO3 ] + [NO3 ]), 50 % and 15 % contributions from coarse NO3 . The regional- with values greater than 1 indicating that conditions are mean total NO3 concentrations in East Asia amount to 3.5 HNO3 limited and less than 1 indicating conditions are NH3 and 6.5 µg[NO3 ] m−3 and in South Asia amount to 5.5 and limited (Ansari and Pandis, 1998). It is clear from Fig. S7 7.5 µg[NO3 ] m−3 , in SLOW and FAST respectively. Total that NH4 NO3 production is HNO3 limited at the surface over NO3 differences between FAST and SLOW are driven by land regions but that conditions are ubiquitously NH3 lim- changes to the fine-NO3 concentrations (Fig. 2d–f), with ited above altitudes of 1000 m. While NaNO3 and Ca(NO3 )2 comparatively minimal changes to coarse NO3 (Fig. 2g–i). In are not volatile like NH4 NO3 , they are instead associated summary, Fig. 2 shows that the near-surface NH4 NO3 con- with coarse particles that are readily removed from the atmo- centration differences between FAST and SLOW are very sphere by gravitational sedimentation and wet scavenging; similar to the overall burden differences (Fig. 1). thus, they remain confined to the lowest 1 km of the atmo- Figure 3 shows the zonal-mean vertical distribution of sphere (Fig. 3e–f). Figure 3 demonstrates that NH4 NO3 and NO3 , NH4 , and coarseNO3 aerosol in the FAST and SLOW coarseNO3 are mostly confined to the lower troposphere in simulations. NH4 reaches a greater altitude than fine NO3 , the UM in agreement with other GCMs. owing to its long-lived association with SO4 aerosol (Fig. 3a– b). Due to the high solubility of NH3 gas and thus swift 3.3 Regional surface concentrations wet removal from the atmosphere, free ammonia is mostly limited to the bottom 1 km of the atmosphere (Bellouin et Given the strong dependency of the ammonia–nitrate equi- al., 2011), which limits the vertical extent to which NH4 NO3 librium on temperature and the pronounced seasonal cycle in may form by condensation (Fig. 3c–d). This is further cor- precursor gas emissions, it is important to consider the sea- roborated by Fig. S7 which shows the “gas ratio”, defined as sonal cycle of NO3 when assessing a nitrate scheme. Fig- https://doi.org/10.5194/acp-21-15901-2021 Atmos. Chem. Phys., 21, 15901–15927, 2021
15912                                                      A. C. Jones et al.: Sensitivity of nitrate to nitric acid uptake rate

Figure 2. Annual-mean NH4 , NO3 , and coarseNO3 near-surface concentrations from the SLOW and FAST simulations.

ure 4 shows the seasonal cycles in NO3 and coarseNO3 near-         NO3 is less apparent. In the SLOW simulation, coarse NO3
surface concentrations and associated regional NH3 emis-           concentrations are of similar magnitude to fine-NO3 concen-
sions averaged over land in nine “Giorgi” regions (Giorgi,         trations in NEU, MED, CAS, CNA, and WAF on a regional-
2006), selected due to their high fine-NO3 concentrations          mean basis (Fig. 4). In summary, Fig. 4 shows the tight cou-
(Fig. 2). Table S6 gives details of the Giorgi regions. For        pling between regional NH3 emissions and adjacent NO3 sur-
most of the regions (NEU, MED, CNA, EAS, WAF, SQF, and             face concentrations in many regions and highlights the strong
to a lesser extent SEA), fine NO3 cycles in both the FAST          seasonality of NH4 NO3 in the UM.
and SLOW simulations are tightly coupled to cycles in re-             When introducing an aerosol such as NH4 NO3 into a
gional NH3 emissions, which further corroborates the notion        GCM, it is essential to validate the model by comparing the
that NH4 NO3 formation may be limited in these regions by          simulated concentrations to observations. Figures 5 and 6
available NH3 . The NH4 NO3 concentrations in the CAS and          show the near-surface concentrations of HNO3 , NH4 , and
SAS regions may be more dependent on seasonal meteorol-            total NO3 over the USA (Fig. 5) and Europe (Fig. 6) in
ogy than other regions; for instance, SAS (i.e. South Asia)        the FAST and SLOW simulations compared to observations
experiences a strong summer monsoon which would enhance            from the Clean Air Status and Trends Network (CASTNet;
wet deposition of NH4 NO3 during summer and thus reduce            https://www.epa.gov/castnet, last access: 22 October 2021;
concentrations in contrast to the high NH3 emissions in this       Finkelstein et al., 2000) for the USA and the European Mon-
period. SAS also has consistently elevated NH3 emissions           itoring and Evaluation Programme (EMEP; http://ebas.nilu.
throughout the year and is thus less sensitive to seasonal cy-     no/, last access: 22 October 2021; Tørseth et al., 2012) for
cles in NH3 emissions (Zhu et al., 2015). In all regions, NH4      Europe. In both networks the sites are located so as to rep-
and fine-NO3 concentrations exhibit a strong seasonal cycle        resent the wider region. Data processing and site selection
in both SLOW and FAST, while the seasonal cycle in coarse          for the observations follow the methodology described in

Atmos. Chem. Phys., 21, 15901–15927, 2021                                          https://doi.org/10.5194/acp-21-15901-2021
You can also read