FARM FOCUS DAY Thursday, 17 March 2022 - Owl Farm
←
→
Page content transcription
If your browser does not render page correctly, please read the page content below
FARM FOCUS DAY
                                         Thursday, 17 March 2022

                                                       Season Update
                                            Farm performance season to date

                                         Criteria for investing in technology
  Brian Dela Rue (DairyNZ research engineer) - key considerations when choosing which technology is
                                             right for you.

                                        Why soil matters for climate change
Prof. Louis Schipper (Waikato Uni) - research happening at Owl Farm to measure changes in soil carbon

Disclaimer:

While every effort has been made to ensure information provided in this handout was true and correct and the time of going to
print, Owl Farm takes no responsibility for the use of data outside of the purpose to inform readers of the current situation at Owl
Farm on the Focus Day.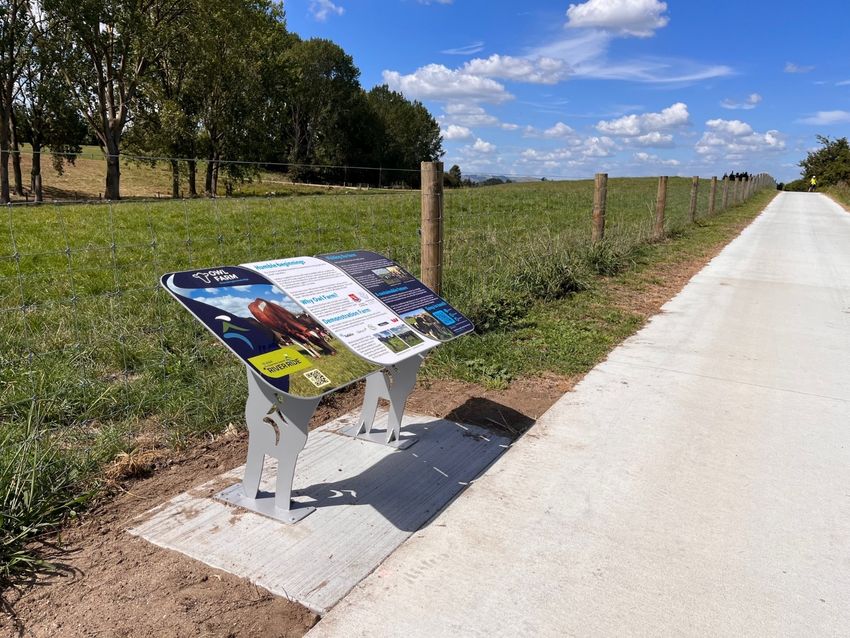
CONTENTS
Contents ......................................................................................................................................... 2
Owl Farm Strategy ...................................................................................................................... 3
Health and Safety ....................................................................................................................... 4
Owl Farm Multi-Year Snapshot ............................................................................................... 6
Wagon Wheel KPIs 2020/21 ..................................................................................................... 7
1.0 Farm Performance ................................................................................................................ 9
      Season to date comparison .............................................................................................................................................. 9
      Climate .................................................................................................................................................................................. 11
      Rainfall ................................................................................................................................................................................... 12
      pasture Growth Rates ....................................................................................................................................................... 15
      Pasture Cover....................................................................................................................................................................... 15
      Milk Production .................................................................................................................................................................. 16
      Milk Quality .......................................................................................................................................................................... 19
      MS/ha from Homegrown Feed ...................................................................................................................................... 20
      Feed Supply and Demand graph .................................................................................................................................. 21
      Paddock Performance ...................................................................................................................................................... 22
      Livestock Growth ................................................................................................................................................................ 23
      Reproductive Performance............................................................................................................................................. 24

2.0 Animal Wellbeing ............................................................................................................... 25
      Body Condition Score ....................................................................................................................................................... 25
      SCC (Somatic Cell Count) ................................................................................................................................................ 26
      Lameness .............................................................................................................................................................................. 27

3.0 Business Health .................................................................................................................. 28
      Cashflow against original budget ................................................................................................................................. 28
      Sustainable Agriculture Finance Initiative (SAFI) ..................................................................................................... 29
      Revised budget for 2021/22 season .............................................................................................................................. 31

4.0 Community ........................................................................................................................... 32
      Students studying Ag/Hort ............................................................................................................................................. 32
      Te Awa River Cycleway ..................................................................................................................................................... 33
      2022 Public Open Day ...................................................................................................................................................... 33

5.0 Quality Workplace ............................................................................................................. 34
6.0 Environment ........................................................................................................................ 42
      Why soil matters for climate change - The University of Waikato’s research on Owl Farm ....................... 45

2
OWL FARM STRATEGY
1. Vision
    a.   Dairy Farm
         • Demonstrating excellence in farm performance to create a sustainable future.
    b.   Students
         • To encourage more young people into the dairy industry.

2. Strategic Objectives
    a.   Dairy Farm
         • Providing leadership to dairy farmers and the wider community by demonstrating
            progressive practices that can be achieved on farm.
         • Optimising profit through identifying the appropriate dairy production system for Owl Farm.
         • Achieving a sustainable environmental footprint based on industry good management
            practice.
         • To attract, train and retain quality employees.
    b.   Students
         • To provide educational opportunities and exposure to the dairy industry which
            demonstrates career opportunities to students.

3
HEALTH AND SAFETY

Welcome to Owl Farm. We are a fully operational, commercial dairy farm with several potential
hazards to both visitors and staff. Many of these hazards cannot be eliminated while also providing
access to visitors, therefore all staff and visitors MUST watch for potential hazards and act with
caution.

St Peter’s School / Owl Farm Hazard Notifications
   •   Children are the responsibility of their parent or guardian
   •   Normal hazards associated with a dairy farm
   •   Other vehicular traffic on farm roads and races
   •   Races may be slippery

ARE YOU TRAINED FOR WHAT YOU ARE ABOUT TO DO? If not, STOP.

              Emergency Contact Information

In the event of an emergency, ensure the scene is safe and raise the alarm to get Owl Farm staff and
emergency services to assist.

Emergency Services
   •   Fire, Police and Ambulance                 111
       1716 Cambridge Road, follow Hanlin Road through the school to the farm

Farm Staff
   •   Jo Sheridan – Demonstration Manager               021 712 680
   •   Tom Buckley – Farm Manager                        021 058 4916

Safety Equipment Location
   •   First Aid Kits                             Dairy Shed and Vehicles
   •   Fire Extinguishers                         Dairy Shed and Tractor
   •   Defibrillator                              Main Office and St Peter’s Medical Centre

By entering Owl Farm and signing in at registration, you are acknowledging your understanding of
any potential hazards and agree to take personal responsibility and act in such a manner as to protect
yourselves and others also on-farm.

4|Page
5
OWL FARM MULTI-YEAR SNAPSHOT
Year 2017-18 2018-19 2019-20 2020-21
Total farm area 164 164 164 160
Effective area (ha) 148 147.3 147.5 144
Physical Info
Effective area leased (ha) 18 18 22 33.3
Leased run off (ha) 5 3+12 5+5 4.7
Cows wintered 441 419 421 416
Peak cows (1 Nov) 418 406 405 405
Peak stocking rate cows/ha 2.82 2.76 2.75 2.81
Total kg MS 168,169 169,359 167,185 178,125
MS/cow 402 417 413 440
Production
MS/ha 1,136 1,150 1,133 1,237
MS/ha from homegrown feed 978 1,013 931 1,034
MS as % liveweight 86.5% 89.7% 86% 92%
Average SCC 146,000 172,000 162,000 144,000
Pasture growth rates total T DM/ha 17.4 15.7 13.4 14.7
Feed and Inputs
Homegrown feed harvested T DM/ha (actual weight) 13.8 13.7 11.4 11.7
Supplements imported T DM/ha 2.3 2.3 2.7 2.6
Supplements imported T DM 339 337 440 368
Percentage of diet imported 13% 13% 17% 16%
Percentage of farm cropped & harvested (silages) 33% 93% 45% 24%
Nitrogen fertiliser applied on pasture (kg/ha) 161kg 149kg 140kg 138kg
Gross farm revenue/kg MS (including stock/dividend) $7.56 $6.86 $7.58 $7.94
Cash farmgate milk price/kg MS (Dairybase) $6.39 $6.43 $7.11 $7.47
Stock sales/kg MS $0.54 $0.43 $0.37 $0.52
Financials
Dividend/kg MS $0.36 $0.00 $0.00 $0.15
FWE/kg MS $4.28 $4.66 $4.96 $4.60
OPEX/kg MS (inc depn & feed inv) $4.59 $4.97 $5.46 $5.10
Op Profit/ha actual payouts (cash milk rev) Dairybase $3,096 $2,147 $2,405 $3,482
Opening debt/kg MS held $21.23 $23.02 $21.61 $20.86
Estimated N loss kg/ha 35 35 32 34
Estimated P loss kg/ha 0.8 0.9 0.8 1.0
Enviro
GHG loss/ha Overseer FM kg CO2e/ha 11,801 11,728 11,304 11,623
Biological GHG/ha (methane + nitrous oxide) 9,548 9,192 9,074 9,945
N conversion efficiency 24% 25% 25% 27%
Cowshed 36 Rot 36 Rot 36 Rot 36 Rot
Feed infrastructure NIL NIL NIL NIL
Herd BW/PW 112/135 119/153 159/186 171/197
Industry BW/PW 72/93 64/73 93/117
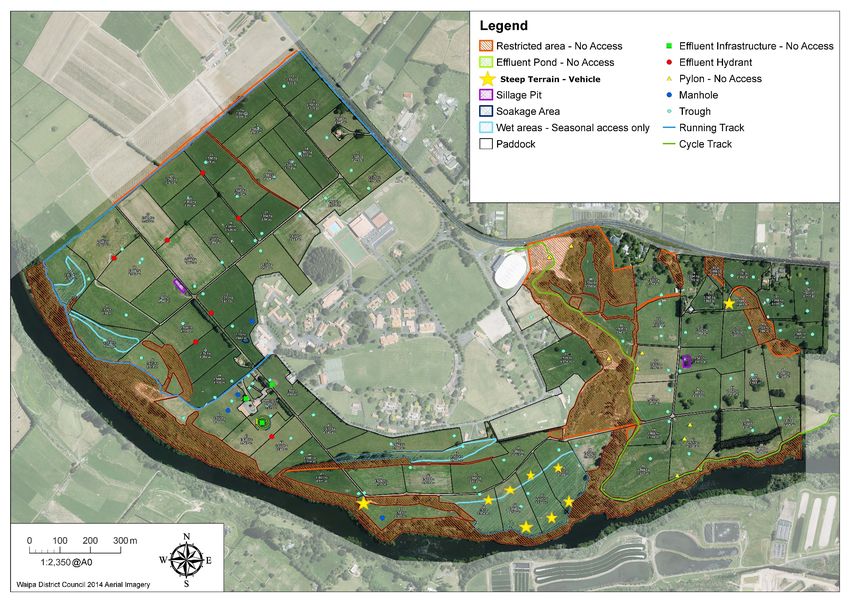
Effluent storage New lined pond
Amount of farm effluent is applied to 51 ha 34% 51 ha 34% 51 ha 34% 41 ha 28%
6
WAGON WHEEL KPIS 2020/21

7

8

1.0 FARM PERFORMANCE

SEASON TO DATE COMPARISON
With warm winter soil temperatures and dry soils coming into the season, the spring peak growth
and production was hampered by high rainfall in September and a subsequent growth surge in
November. Cows peaked lower than last season and, even with slightly more imported feed being
used during the wet weather and milk replacer being used for the first time this season, we
struggled to keep up with last year’s production.

Temperatures heated up in December followed by an exceptionally dry January causing soil
moisture levels to plummet along with pasture covers, like last season but a month earlier.
Predictions of heat stress times were from 11am to 8pm for days on end, causing reduced intakes
and lower milk production in December through January. Using our 11 ha of crops and 3n2 milking
since before Christmas helped to reduce the pressure, along with yard sprinklers. The Waitangi
weekend saw welcome rain which allowed us to slow the rotation right down to 70 days for 2-3
weeks to build cover before the regular autumn recovery rain was due. Holding the cows up on
kale crops, along with feeding PK and high amounts of low energy silage (up to 8 kg DM) to
minimise pasture intake, also had an impact on milk production.

Cows were transitioned to OAD on 22nd February when we could still feed them 18+ kg DM and we
prepared for the impacts of Covid on our workforce. In the last week of February we sold 70 cows
to further reduce feed demand while we were still able to get cows sold and to the works.

With lower stock numbers and continued dry weather predicted for March we have updated our
Farmax feed budget to revise our milksolids production target for the year, down to 166,640 kg
MS from 175,000 kg MS. This includes drying off approximately 70 cows on BCS criteria through
late March and miking 250 cows through to 10th May.

Summer crop yields have been slightly lower this year but, with high quality and good utilisation,
they have added an additional 4 kg DM to the diet from 22nd December through to the end of
March.

Notes:

9

Season to date 28/02/2022                                 2017-2018   2018-2019   2019-2020   2020-2021   2021-2022   Notes

                   Milking Platform                                            148         147         147         144         144         1

                   Cows on farm                                                412         361         374         385         321         2
 Stock

                   Peak cows                                                   418         406         405         405         410         3

                   Peak stocking rate                                          2.82        2.76        2.75        2.81        2.85        4

                   Total kgMS Season to date to factory                       144,909     152,670     151,268     150,443     144,826      5
 Production

                   MS/cow Season to date                                       347         376         374         371         353         6

                   MS/ha Season to date                                        976         1,036       1,026       1,045       1,008       7

                   MS/ha from homegrown feed to date                           868         941         914         912         868         8

                   Average Pasture Cover 1 June                                2,256       2,430       2,516       2,517       2,334       9

                       Pasture growth rates total TDM/ha                       14.0        13.3        10.9        11.8        11.9       10

                       Actual pasture grown to graze and harvest as silage
                                                                               12.8        12.3        10.2        10.5        10.8       11
                       excl area sprayed out in crop
                       Total pasture supply TDM/ha                             12.8        12.3        10.2        10.5        10.8       12

                       Yield of Crop grown per total farm /ha                   0.8         0.8         0.5         0.7         0.7       13

                       Winter homemade silage on hand fed                       0.2         0.8         0.6         0.2         0.2       14

                       Imported Supplements fed/ha                              1.6         1.2         1.4         1.5         1.7       15

                   Total Feed supply TDM/ha                                    15.3        15.1        12.7        12.9        13.3       16

                       Homegrown grass eaten TDM/Ha (grown this year)           9.2         8.4         7.9         8.2         8.1       17
 Feed and Inputs

                       Homegrown silage grown and eaten this year               0.0         0.3         0.5         0.0         0.0       18

                       Crop eaten per total farm/ha                             0.7         0.7         0.5         0.6         0.6       19

                     Homegrown feed EatenTDM/ha (grown this year)               9.8         9.5         8.9         8.8         8.6       20

                       Silage harvested TDM/ha Season to date                   1.1         1.6         1.0         0.8         0.6       21

                     Total Homegrown feed Harvested TDM/ha                     11.0        11.1         9.8         9.6         9.3       22

                       Winter homemade silage on hand eaten                     0.2         0.6         0.5         0.2         0.2       23

                       Imported Supplements Eaten TDM/ha                        1.2         1.0         1.1         1.3         1.4       24

                     Total Feed eaten this year (includes only silage fed)
                                                                               11.2        11.1        10.5        10.3        10.2       25
                     TDM/ha
                   % Feed eaten grown on farm                                  89%         91%         89%         87%         86%        26

                   Feed conversion Eff (kgDM eaten/kgMS)                       11.5        10.7        10.2         9.8        10.2       27

                   Nitrogen Applied/effective ha                               122          93         102          77          86        28

Notes:

10
CLIMATE
Climate data is recorded from one weather station on the farm, collecting rainfall, air temperature,
humidity and wind. We also have a 600mm soil probe that measures soil moisture and temperature
at 100mm depths. Graphs show readings at 100mm depth over time.
Graphic 1.1: Average temperature over years
Average temperature
24.00
22.00
20.00
18.00
16.00
14.00
12.00
10.00
8.00
Jun Jul Aug Sep Oct Nov Dec Jan Feb Mar Apr May
17/18 18/19 19/20 20/21 21/22 6 year average
Graphic 1.2: Average soil temperature over years
Average soil temperature
26.00
24.00
22.00
20.00
18.00
16.00
14.00
12.00
10.00
8.00
Jun Jul Aug Sep Oct Nov Dec Jan Feb Mar Apr May
17/18 18/19 19/20 20/21 21/22 6 year average
Notes:
11Graphic 1.3: Average soil moisture over years
Average Soil Moisture 100mm
40.00
35.00
30.00
25.00
20.00
15.00
Jun Jul Aug Sep Oct Nov Dec Jan Feb Mar Apr May
17/18 18/19 19/20 20/21 21/22 6 yr average
RAINFALL
The 2021/22 season is shaping up to be a hotter and drier season than most.
While it felt like a wetter spring compared with the last two seasons, we are still receiving average
rainfall, but low soil moisture levels at the start of the season meant that we went into summer
dry once again. This gave us insights into our risk management strategies in case of another
prolonged dry spell. We used long rotations, forward-contracting supplements and booking in
early pregnancy diagnosis and culls to leave the farm to manage the reduced pasture growth
rates resulting from low soil moisture.
Notes:
12Graphic 1.4: Cumulative monthly rainfall over seasons
Rainfall - Farming year
1400 1269
1200
1080
991
1000
837
808
800
753
600
400
200
0
Jun Jul Aug Sep Oct Nov Dec Jan Feb Mar Apr May
17/18 18/19 19/20 20/21 21/22 5 yr average
Graphic 1.5: Cumulative monthly rainfall over years
Rainfall - Calendar year
1400 1388
1317
1200
1000 1062
800
766
711
600
400
200
0
Jan Feb Mar Apr May Jun Jul Aug Sep Oct Nov Dec
2017 2018 2019 2020 2021 5 yr average
13Graphic 1.6: Monthly rainfall over years
Rainfall by month
200
180
160
140
120
100
80
60
40
20
0
Jun Jul Aug Sep Oct Nov Dec Jan Feb Mar Apr May
17/18 18-19 19/20 20/21 21/22 6 year average
Notes:
14PASTURE GROWTH RATES
A noticeable growth check in October put pressure on early mating and silage harvesting and
crop planting. Low growth rates in January have been balanced by higher February growth;
however, destocking the farm early was necessary to reduce grazing pressure and ensure
remaining cows were allocated enough feed to maintain body condition and appropriate FEI
levels in milk.
Graphic 1.7: Pasture Growth Rates from Farmax
Growth Rates
90
Growth Rate kgDM/ha/day
80
70
60
50
40
30
20
10
0
Jun Jul Aug Sep Oct Nov Dec Jan Feb Mar Apr May
2017-18 23 28 50 59 73 76 49 49 55 40 33 39
2018-19 23 20 42 59 71 73 74 52 21 23 30 28
2019-20 38 30 43 52 65 77 43 7 1 12 31 38
2020-21 41 34 43 49 55 59 56 39 12 19 42 33
2021-22 32 26 36 52 52 79 59 22 34
Long term average 25 26 40 56 68 72 58 38 27 32 35 34
PASTURE COVER
Covers have been maintained nicely between 2100 and 2400 kg DM/ha since Balance Date, due
to timely management of surplus through crops, silage or baleage. They bottomed out at 1800 kg
DM/ha in early February prior to the rain and have since recovered to 2200 kg DM/ha, due to the
long rotation being used in February. This should allow us to continue allocating 8-9 kg DM
grass/cow/day until the autumn rains come.
Notes:
15Graphic 1.8: Pasture Cover from weekly farm walk
MILK PRODUCTION
Milk production exceeded target in September and October but was below target during July and
August due to the slower calving rate. Milk production continued to fall below target as
production per cow was lower from November onwards.
Graphic 1.9: Monthly milk production
Production: Monthly Performance
30,000
25,000
20,000
15,000
10,000
5,000
0
Jul Aug Sep Oct Nov Dec Jan Feb Mar Apr May
17/18 Production 6,807 21,183 23,287 24,376 21,030 19,213 16,158 12,856 14,641 7,549 1,070
18/19 Production 6,216 21,391 24,460 24,906 22,042 19,744 18,745 15,165 11,509 5,181
19/20 Production 7,184 22,507 24,485 23,924 21,544 19,879 17,675 14,070 8,179 4,564 3,173
20/21 Production 5,052 20,543 25,146 25,222 20,716 19,866 18,488 15,411 14,234 9,178 4,270
21/22 Production 5,945 19,307 25,906 25,576 21,137 18,472 16,263 12,220
Budgeted 7,000 22,000 24,000 24,000 22,000 20,000 18,000 15,000 12,000 8,000 3,000
17/18 Production 18/19 Production 19/20 Production 20/21 Production 21/22 Production Budgeted
16We saw a strong per cow peak in September but cows dropped off peak in October as
temperatures started to increase in November. Once the heat rose in December, milk production
continued to decline even with allocated feeding levels around 19 kg DM/cow/day being offered.
Graphic 1.10: Production per cow
Production per cow: monthly average
2.20
2.00
1.80
kgMS/cow/day
1.60
1.40
1.20
1.00
0.80
0.60
Jul Aug Sep Oct Nov Dec Jan Feb Mar Apr May
2017-18 2018-19 2019-20 2020-21 2021-22 Budgeted kgMS
Our target of 850 kg MS/ha by 31st December or 122,000 kg MS relies on early, condensed calving
to create more milk in July and August. By 31st December 2021 we had achieved 809 kg MS/ha.
Our target was achieved by 11th January.
Notes:
17Graphic 1.11: Production per hectare
Production per ha: cumulative
1400.00
1200.00
1000.00
Dec, 850.00
800.00
kgMS/ha/day
600.00
400.00
200.00
0.00
Jul Aug Sep Oct Nov Dec Jan Feb Mar Apr May
2017-18 2018-19 2019-20 20-21 21-22 Budgeted kgMS
Notes:
18MILK QUALITY
Our target this season is to provide the highest quality milk for Fonterra by achieving Te Tihi status
in the Co-operative Difference framework. This represents Excellence in milk quality for 90% of
our milk supply days.
To unlock the 7c/kg MS we have worked on the following:
Co-operative and Prosperity
• We will have full and accurate farm dairy records by 30th June 2022
Environment
• A Farm Environment Plan meeting all four key practices
• Purchased N surplus will be less than 137 kg N/ha (was 110 kg N/ha in 2020-21)
• We participate in a product stewardship scheme for plastics
• No discharge of farm dairy effluent to water
• 80% of our feed used for the season will be farm grown
Animals
• An Animal Wellbeing Plan that addresses nutrition, health, environment, and behavioural
issues
People and Community
• The 360 Workplace Assessment achieving 100% on the foundation section
Graphic 1.12: The Co-operative Difference summary at 07/03/2022
19MS/HA FROM HOMEGROWN FEED
We maintain a focus on homegrown feed that enables us to meet Co-operative Difference criteria
and manage risks associated with imported feed supply and pricing. With lower production
season to date and more supplements required to achieve it, we have lower milksolids from
homegrown feed season to date.
Graphic 1.13: Production per hectare to date between seasons
1,200
Production/ha to date
1,000
800
kgMS/ha
600
400
200
0
2017-2018 2018-2019 2019-2020 2020-2021 2021-2022
MS/ha Season to date 976 1,036 1,026 1,045 1,008
MS/ha from homegrown feed to date 868 941 914 912 868
Notes:
20FEED SUPPLY AND DEMAND GRAPH
Homegrown grass eaten year to date is slightly below last year which reflects the lower August,
September, October and January growth rates. More imported supplements have been used to
date to ensure adequate feed intakes during periods of poor pasture utilisation in a wet spring.
Included is low utilisation of low ME grass silage at high feeding levels during a dry summer.
Graphic 1.14: Total feed used season to date between seasons
12.0 TDM/ha
Total feed used TDM/ha by type
10.0 TDM/ha
8.0 TDM/ha
6.0 TDM/ha
4.0 TDM/ha
2.0 TDM/ha
0.0 TDM/ha
2017-2018 2018-2019 2019-2020 2020-2021 2021-2022
Imported Supplements Eaten TDM/ha 1.2 1.0 1.1 1.3 1.4
Crop eaten per total farm/ha 0.7 0.7 0.5 0.6 0.6
Homegrown silage grown and eaten this
0.0 0.3 0.5 0.0 0.0
year
Winter homemade silage on hand eaten 0.2 0.6 0.5 0.2 0.2
Homegrown grass eaten TDM/Ha (grown
9.2 8.4 7.9 8.2 8.1
this year)
Total Feed eaten this year (includes only
11.2 11.1 10.5 10.3 10.2
silage fed) TDM/ha
% Feed eaten grown on farm 89% 91% 89% 87% 86%
Notes:
21PADDOCK PERFORMANCE Weekly farm walk data is used to calculate paddock growth rates for the season to date. The paddocks on the right include annual and crop yields and are the highest-performing, following Cleancrop brassica systems. We use this data plus last year’s annual yield, clover and plantain composition, and pasture condition scores, to make informed decisions on which paddocks are suitable for cropping, weed management requirements, and which need fertiliser or potential drainage. Graphic 1.15: Paddock performance season to date from farm walk data 22
LIVESTOCK GROWTH
2020-born calves left the farm on 1st June to commence grazing at Waikato Heifer Growers at 247
kg; they weighed 327 kg on average at Planned Start of Mating and were 410kg on 14th January.

Graphic 1.20: 2020-born calves

2021-born calves were reared on milk replacer this season, averaged 180 kg on 18th January and
are now grazing 7.1 ha of chicory on leased support land with additional grass silage and PK.

Graphic 1.21: 2021-born calves

23
REPRODUCTIVE PERFORMANCE

24
2.0 ANIMAL WELLBEING

For the 2021/22 season we have improved our Healthy Calves KPI, with 83% of calves testing with
adequate IgG (immunoglobulin) levels for optimum calf health. Purposeful Lives for Calves
increased to 70% in 2021. Our final empty rate is one of the biggest contributors to involuntary
culls; this year it is 9%, down from 14% last season.

BODY CONDITION SCORE
Last year we were challenged with having high BCS cows that mobilised a lot of weight to
continue producing during mating. We worked hard to get a better BCS result and prevent over-
fat cows at calving. While heifers calved at target 5.5 BCS, the cows were slightly under BCS target
(4.9) and the second-calvers at 4.9 did not hit their 5.5 BCS target.
However, body condition score loss has been limited to 0.5 BCS so far this season and cows have
been in excellent metabolic health. While BCS continues to track lower this season, at an average
of 4.3 in February and March we have cows that can continue to milk through to early May.

Graphic 2.1: Monthly Body Condition Score

                                                  Monthly Body Condition Score
                        6.0

                        5.5
     AVERAGE HERD BCS

                        5.0

                        4.5

                        4.0

                        3.5
                              Jun   Jul   Aug     Sep     Oct   Nov       Dec   Jan     Feb     Mar   Apr   May

                                          17/18         18/19     19/20         20/21         21/22

25
SCC (SOMATIC CELL COUNT)
Last season we culled high SCC cows to prepare us for 90% of milk at < 150,000 SCC threshold to
achieve Te Tihi Co-operative Difference. This had a huge impact on our SCC in early lactation.
However, even with few cases of mastitis (9% season to date), lower production and reduced
milking frequency has made it hard to consistently maintain SCC below 150,000 to reach
Excellence standard.
Graphic 2.2: Monthly SCC over years
Graphic 2.3: Mastitis Cases Treated
Mastitis - cases treated
90
80
70
60
MASTITIS CASE
50
40
30
20
10
0
Jun Jul Aug Sep Oct Nov Dec Jan Feb Mar Apr May
17/18 18/19 19/20 20/21 21/22
26LAMENESS
Lameness cases started off low for the season, but wet conditions in September increased
lameness through October to December and, while new cases have slowed dramatically through
January and February, we have already exceeded our lameness goal of less than 12% for the season.
Graphic 2.4: Lameness events between years
Lameness events
160
140
120
NUMBER OF CASES
100
80
60
40
20
0
Jun Jul Aug Sep Oct Nov Dec Jan Feb Mar Apr May
17/18 18/19 19/20 20/21 21/22
Notes:
273.0 BUSINESS HEALTH
CASHFLOW AGAINST ORIGINAL BUDGET
With increasing uncertainty about product supply and cost throughout the 2021/22 season (since
the budget was approved in March 2021) we have been focused on securing essential pasture
growth and animal wellbeing inputs at the lowest possible cost relative to budget. Milk replacer
for calves has been the only approved out-of-budget expenditure for this season.
The milk production target has been revised down to 166,640 kg MS for the 2022/23 season, based
on Farmax feed budgets, taking into account milk production season to date and feed remaining
within budget, while achieving our BCS, APC and feed reserves for next season.
Breeding costs are expected to be lower due to the Halter subscription starting one month later
than budgeted (Note 9).
Silage made costs are expected to be lower, due to budgeting on 55 ha made and we have only
made 42 ha (Note 12).
Capital expenses to date include Halter setup ($22.7k), with bale grabs and bale feeder, concrete
tanker pad and water reticulation included in the approved $60k capital spend for the season
(Note 33).
We have tried to reduce the effect of increasing input prices on PK and N fertiliser, two significant
expense areas. The 2021/22 budget was set at $800/t SustaiN to deliver 120 Units N/ha. With
prices increasing significantly over the year, in December we purchased 12 t of SustaiN and 6 t of
DAP (at $1345/t) for our autumn fertiliser requirements, to store on farm before further significant
price increases. We have averaged $1027.25/t SustaiN for the season so far.
Graphic 3.1: SustaiN purchase price
Date Volume Price/t product
31/8/21 4.5 t SustaiN $949
30/9/21 2.5 t SustaiN $949
5/10/21 2 t SustaiN $949
31/11/21 1.3 t SustaiN $999
1/12/21 10 t SustaiN $1,049
14/12/21 2 t SustaiN $1,289
22.3 t purchased to date $1027.25/t average price
(Current price as at 13/3/22 is $1239/t)
28The 2021/22 budget for PK was set at 160 t purchased at $317/t (plus 13 t PK for calves). We have
averaged $342/t PK for the season.
Graphic 3.2: PK purchase price
Date Volume Price Contract/Spot
1/7/21 107 t $324/t Contract 1 July for 8 months
1/11/21 30 t $380/t Contract 1 November for 3 months
1/3/22 28.7 t $352.95/t Spot price
1/4/21 15 t $379/t Contract 1 April for 6 months
180 t (includes 13-15t $342/t average price (spot price
PK for calves) as at 13/3/21 is $464/t)
1/4/21 (for 30 t $379 Contract 1 April for 6 months to be
2022/23 season) used in June/July
SUSTAINABLE AGRICULTURE FINANCE INITIATIVE (SAFI)
Owl Farm is pleased to partner with Westpac in their Sustainable Agriculture Finance Initiative
which acknowledges the reduced risk of lending due to our sustainable farm practices.
Committing to the SAFI framework is extremely well aligned with our wagon wheel KPIs and
allows us to receive a lower interest rate as we work through meeting the criteria over the next
two years. We look forward to presenting this in more detail with Westpac at our May Focus Day
Notes:
29Graphic 3.3: 2021/22 cashflow updated to end of January
Jun Jul Aug Sep Oct Nov Dec Jan YTD Total YTD Budget Variance Full Year Budget Notes
Milksolids KG - 5,945 19,307 25,906 25,576 21,137 18,472 16,263 132,606 137,000 4,394 175,000 1
Total Milk Receipts (63,005) (98,223) (156,187) (192,073) (171,096) (131,665) (103,131) (196,870) (1,112,250) (916,205) 196,045 (1,259,743) 2
Dividends Received - - (7,450) - (27,925) - - (5,954) (41,329) (7,700) 33,629 (7,700) 3
All Cattle Sales (3,215) (1,775) (15,691) (18,713) (4,422) (1,026) (1,000) (13,418) (59,260) (23,900) 35,360 (79,900) 4
All other Income (3,433) (13,310) (3,433) - (3,433) (3,433) (3,433) (3,433) (33,910) (31,200) 2,710 (46,800) 5
Total Income (69,653) (113,308) (182,761) (210,786) (206,876) (136,125) (107,564) (219,676) (1,246,749) (979,005) 267,744 (1,394,143) 6
Wages 16,015 17,757 24,899 16,512 16,512 16,642 19,514 22,867 150,718 158,280 7,562 241,420 7
Animal Health 9,217 3,530 3,755 3,692 480 7,323 3,091 1,537 32,627 24,800 (7,827) 42,000 8
Breeding & Herd Improvement 719 785 1,795 21,323 13,477 5,014 2,595 5,819 51,527 48,040 (3,487) 65,260 9
Farm dairy 1,869 355 77 110 481 1,271 - 106 4,269 3,860 (409) 4,940 10
Electricity - 869 1,422 1,487 1,690 1,678 1,358 1,497 10,001 9,100 (901) 12,900 11
Silage made - - - - 5,118 8,702 300 3,870 17,989 32,820 14,831 32,820 12
Supplements purchased 9,357 3,055 6,731 9,856 17,388 - 10,041 - 56,428 75,600 19,172 97,008 13
Calf rearing 2,015 1,515 16,937 211 5,809 1,553 9 - 28,049 13,000 (15,049) 13,000 14
Young & dry stock grazing 9,041 7,256 5,600 5,060 5,060 - 8,418 5,060 45,494 47,520 2,026 69,480 15
Fertiliser (incl. N) (2,164) 3,124 17,594 2,586 853 20,989 21,138 - 64,119 44,500 (19,619) 66,500 16
Regrassing & cropping 1,398 1,313 - 10,471 9,068 7,349 1,198 2,476 33,273 28,600 (4,673) 46,600 17
Weed and pest - 36 491 1,636 - 150 4,532 - 6,845 2,500 (4,345) 2,500 18
Planting - - 8,705 - - - - - 8,705 15,000 6,295 15,000
19
Effluent spreading - - 180 421 12,237 2,380 - 603 15,822 8,000 (7,822) 15,000 20
Vehicles - Fuel and R&M 3,537 1,447 2,017 2,606 1,499 5,337 2,884 1,783 21,110 20,920 (190) 31,380 21
R&M (land,buildings, plant, machinery) 2,549 3,475 616 14,556 1,477 1,445 1,160 412 25,691 37,764 12,073 56,196
22
Freight and general farm expenses 2,840 6,247 4,100 6,702 5,019 5,269 4,095 4,072 38,345 34,340 (4,005) 50,060 23
Administration 1,251 1,250 1,838 1,253 1,250 1,250 1,280 1,253 10,625 12,330 1,705 17,920 24
Rates, Insurance, ACC 1,000 1,000 2,048 2,044 2,048 2,048 2,097 1,048 13,334 16,000 2,666 32,500 25
CASH Farm Working Expenses 58,646 53,013 98,805 100,526 99,466 88,402 83,710 52,403 634,970 632,974 (1,996) 912,484 26
Surplus before Finance charges (11,007) (60,295) (83,956) (110,260) (107,409) (47,723) (23,855) (167,273) (611,778) (346,031) 265,747 (481,659) 27
Lease Land on Milking Platform 4,485 4,485 4,485 4,485 4,485 9,545 4,485 4,485 40,938 41,008 70 61,512 28
Interest - Farm Loan 10,172 10,172 10,172 10,172 10,172 10,172 10,172 10,172 81,376 81,376 - 122,064 29
Depreciation 7,243 7,243 7,243 7,243 7,243 7,243 7,243 7,243 57,940 61,160 3,220 91,740 30
Total Financial Charges 21,899 21,899 21,899 21,899 21,899 26,959 21,899 21,899 180,254 183,544 3,290 275,316 31
Principal 15,000 15,000 15,000 15,000 15,000 15,000 15,000 15,000 120,000 120,000 - 180,000 32
Capital Expenditure - - - - - 93 - 22,720 22,813 - (22,813) - 33
Surplus After Finance charges, Principal and CAPEX 25,892 (23,396) (47,057) (73,361) (70,510) (5,671) 13,045 (107,653) (288,711) (42,487) 246,224 (26,343) 34
30REVISED BUDGET FOR 2021/22 SEASON
Graphic 3.4: Revised budget for 2021/22 season – updated production target of 166,640 kg MS
Revised 9/3/22
Full Year Budget Full Year Budget Notes
Milksolids KG 175,000 166,640 1
Total Milk Receipts (1,259,743) (1,548,066) 2
Dividends Received (7,700) (27,674) 3
All Cattle Sales (79,900) (97,900) 4
All other Income (46,800) (46,800) 5
Total Income (1,394,143) (1,720,440) 6
Wages 241,420 241,420 7
Animal Health 42,000 42,000 8
Breeding & Herd Improvement 65,260 61,260 9
Farm dairy 4,940 4,940 10
Electricity 12,900 12,900 11
Silage made 32,820 15,000 12
Supplements purchased 97,008 104,008 13
Calf rearing 13,000 27,000 14
Young & dry stock grazing 69,480 69,480 15
Fertiliser (incl. N) 66,500 76,000 16
Regrassing & cropping 46,600 46,600 17
Weed and pest 2,500 2,500 18
Planting 15,000 15,000
19
Effluent spreading 15,000 15,000 20
Vehicles - Fuel and R&M 31,380 31,380 21
R&M (land,buildings, plant, machinery) 56,196 56,196
22
Freight and general farm expenses 50,060 50,060 23
Administration 17,920 17,920 24
Rates, Insurance, ACC 32,500 32,500 25
CASH Farm Working Expenses 912,484 921,164 26
Surplus before Finance charges (481,659) (799,276) 27
Lease Land on Milking Platform 61,512 61,512 28
Interest - Farm Loan 122,064 122,064 29
Depreciation 91,740 91,740 30
Total Financial Charges 275,316 275,316 31
Principal 180,000 180,000 32
Capital Expenditure - 60,000 33
Surplus After Finance charges, Principal and CAPEX (26,343) (283,960) 34
314.0 COMMUNITY
STUDENTS STUDYING AG/HORT
Owl Farm aims to provide educational opportunities and exposure to dairy farming which
demonstrates career opportunities to students. We offer classroom experiences on farm to all
students at St Peter’s as well as Waikato/BOP secondary schools through the Sustainability in Dairy
workshop run by Lincoln University for Year 11 students in May every year. This year we are also
offering a teacher-only day aligned with these workshops. We are a (DairyNZ) Rosie’s World
partner farm, providing an opportunity for primary schools across the district to bring Year 0-8
students onto a working dairy farm (unfortunately due to Covid interruptions we have had no
external primary school visits this year). It’s pleasing to see the continued increase in student
numbers choosing Ag/Hort subjects at many secondary schools.
Graphic 4.1: Increasing numbers of students studying Ag/Hort at St Peter’s
Students studying Ag & Hort at St Peter's
350
300
250
200
150
100
50
0
2015 2016 2017 2018 2019 2020 2021 2022
32TE AWA RIVER CYCLEWAY The new section of the Te Awa River Cycleway opened on Saturday 6th March, with over 1400 users. Construction of the cycleway along approximately 4.5km of the Owl Farm boundary has seen 12 months of contributions from Tom to manage grazing and new fence lines, as well as safe contractor access to the cycleway. We have taken the opportunity to connect with the public by providing an information board about the purpose of Owl Farm, on the cycleway. Graphic 4.2: Owl Farm information boards to inform the public about NZ dairy farming 2022 PUBLIC OPEN DAY Due to the current Covid event restrictions, we have regretfully decided to postpone our Public Open Day until November 2022. As this annual event attracts between 300-600 people, we felt it was better to postpone it to later in the season when we can deal with a large group of visitors, and make the most of our many volunteers’ time to create such a special day. 33
5.0 QUALITY WORKPLACE

A farm accident before Christmas has meant that the team has been operating with remote
guidance from Tom while in recovery, on leave and for Covid isolation requirements.
We were able to secure the services of a relief contractor to cover during January and February to
enable the team to have time off farm.
Hours worked per week peaked mid December and are currently at 48 hrs/person/week average
for the season to date. We continue to work towards our 45 hrs/person/week target by shortening
the working day and ensuring more leave off farm is taken by the team during late summer and
autumn.

Graphic 5.1: Total hours worked on farm for the season

                                       Total hours worked on farm for the season
 250

 200

 150

 100

     50

      0
          Jun                     Sep                        Dec                   Feb                  May

                Total hrs/wk 2021-22         Total hrs/wk 2020-21   Total hrs/wk 2019-20   Total hrs/wk 2018-19

34
Graphic 5.2: Hours spent on tasks during calving and mating (measured in 2019)
Combined hours spent on tasks per month 2019
July-August October
AB
Springer Check
Minda
Focus day Tidy up
Fencing Repairs
Calves in
Tractor Spraying
Feed out
Demo Activities
Weed Spraying
Water Leaks
Fert Spread
Mowing
Break Fences
Effluent
Lame Cows
Farm Walk
Data collection
Washing down
Break times
Feed calves
Drafting
Cows in
Milking
Other
0 20 40 60 80 100 120 140 160 180 200
At Owl Farm we continue to explore options on how technology can enable quality workplaces
for our team and enhance animal wellbeing outcomes, while contributing to farm profitability.
Any change in circumstances triggers a review of our systems and resources to ensure we are on
the most efficient track to achieve our end goal.
35Our 2021/22 budget included the deployment of Halter to Owl Farm after mating. Shown below
is the timeline of events over the last two years to get to this point.
Graphic 5.3: Introducing new technology
Jul/Aug and Oct 2019 Analysis of workplace time and task studies
March 2020 Received resignation from staff member
With increasing urbanisation on our boundary we started planning
for future reduced land area which indicated we would require less
than the current 2.8 FTE to run the farm
Explored options where technology can help improve hours worked
or workplace flexibility. Limitations include milking, bringing cows to
shed, drafting and putting up break fences in spring and in crops
during summer.
April 2020 Worked with DairyNZ to create criteria for technology adoption at
Owl Farm:
1. Add value to compliance management via proof of practice
data
2. Integration with other automation and data
3. Create safer and more attractive workplaces
4. Demonstrate leadership in how to use data to make better
decisions
5. Complementary to wagon wheel KPIs
April 2020 Explored options available using the 4D4F Technology Warehouse to
understand functionality available globally (137 products associated
with animal health and feeding)
June 2020 Investigated wearables market in NZ – talked to supplies, users etc
June 2020 Purchased and installed Protrack auto-draft
July 2020 Implemented options like batt-latch to bring cows to the shed
October 2020 Put together business proposal for Halter to Farm Management
Committee
February 2021 Farm Management Committee visited a Halter farm
September 2021 Set up criteria including animal ethics
November 2021 Waited for product functionality in Gen B collar
December 2021 Farm mapped and towers installed
11th January 2022 Cows collared and training begins
Analysis of technology explored the impact on all areas of the wagon wheel including cost saving
and extra income generated, along with the expense of the technology. Included overleaf are a
few examples of the discussion document generated in October 2020 while the product was still
developing. We explored current functionality and future plans for the product, knowing that
remote software updates allow the product to increase functionality while we are using it. We
anticipate an insignificant change in profit after the first year and gains to be made in years 2 and
3 of our three-year contract.
36Graphic 5.4: Farm performance wagon wheel analysis for Halter technology Graphic 5.5: Quality Workplace wagon wheel analysis for Halter technology 37
Graphic 5.6: Farm budget analysis for Halter technology

38
Technology in the NZ Dairy Sector                                   Brian Dela Rue, DairyNZ

Setting the scene
Dairy farmers are rising to the challenge of evolving environmental, animal wellbeing and
consumer requirements to maintain market access and community support, while remaining
profitable. Farms are heavily reliant on people to operate them, people with skill, who are
hardworking and resilient. But there has been minimal improvement in labour productivity (e.g.,
cows/FTE or kg MS/hours worked) over the past decade and, as herds have grown, more people
have been required. Pressures are evident of a critical shortage of farm workers, estimated at over
4000 people and projected to get worse, increasing the workload on current staff and impacting
wellbeing.

To improve labour productivity, make profitable decisions and attract and retain the right people
to deliver this, we need to change the way we work. Technology will be one of the key solutions,
but the focus needs to be wider, including:
    • Continued improvement – identify workplace opportunities with the farm team
    • Less reliance on people – eliminate, reduce, or automate tasks
    • Reducing hours worked – better rosters, fewer unsociable hours
    • Use of data in decision making – sensors for animal or pasture monitoring, for example
    • Improving workplace safety – less time off injured e.g., reduce strains and sprains in spring
    • A positive workplace culture - communication, opportunity, flexibility, choice,
       appreciation

What technologies are farmers adopting?
Our 2018 technology use survey
shows that farmers are investing
mostly in automation
technologies that reduce tasks
and make the job easier,
particularly at the dairy.

There is more technology in
rotary dairies, but they are also
newer and milk larger herds
than herringbone dairies. Technologies that support the ‘one-person shed’ improve labour
productivity (cows milked/person per /hour) and have been a main driver of uptake, evident in
rotaries where a combination of
devices can remove the need for
cups-off person.

There has been less investment in
data capture technologies that
support decision making. This
can be due to issues like a lack of
confidence in the performance of

39
technology, a perceived lack of value or difficulty integrating the data into decisions. The use of
sensors across the farm can be limited by internet connectivity.
Around 50% of farmers were still assessing their pastures visually, and only around 40% were
recording data in software where it could be used for performance analysis and benchmarking.
What have we been observing recently?
Animal monitoring
Since our 2018 survey there appears to have been an upsurge in the use of animal wearables,
mostly activity-based heat detection collars/tags as farmers gain confidence in these systems.
Many systems are now being offered on a subscription model rather than purchase. Most measure
additional indicators of an animal’s status such as eating time or rumination time, or lying
behaviour that can indicate health issues. The devices need to perform their primary task well, e.g.
heat detection, and other indicators add to the value of the device.
Smart phones and apps
Apps on smart phones are being used widely for business and operational recording and team
communication. These low-cost platforms enable innovation and quick adoption. Too many
separate apps may become frustrating.
Virtual fencing
There has been strong farmer interest in virtual fencing collars such as Halter and Gallagher’s
eShepherd. These technologies promise to automate time-consuming daily tasks and offer
opportunities for animal health monitoring and heat detection. Farmer experience to date is
positive but it is too early to assess benefits, limitations and return on investment.
Workplace improvements
Farmers have been trialling options to improve efficiency and job satisfaction for farm teams. Our
Workplace Design project has piloted some options that support improvements that farmers had
identified.
• Work choice app for flexible rosters – option for farm teams choose shifts within their roster
• Emerging leaders online training in emotional intelligence and leadership – bite-sized on-
farm learning
o see our Thought leaders and futurists webinar series
• Task planning and choice using a Kanban board www.dairynz.co.nz/kanban
• App for simple step-by-step visual instructions for key farm tasks (www.dairynz.co.nz/skills)
For more information, search Workplace design on our DairyNZ web site
40What to consider when evaluating a technology?
What are your current goals?
• Map out each part of your business and where you want improvement
o e.g. productivity/profit, managing compliance requirements, reducing reliance on
people, supporting new workers, or creating a workplace that attracts the best
available people
• Keep up to date with ‘what good looks like’ in each area as farming is constantly evolving.
What is the issue or opportunity you are addressing and what does a successful outcome look
like?
• For example, reducing the team workload during spring, or a system to ensure consistent
heat detection performance without reliance on key people
• Success may be maintaining the current good performance without farm team fatigue or
burn-out
What is your current performance in this area?
• Having sound numbers on hours required on the task and/or performance data will help in
evaluating the value of a new technology and how long until the break-even point is
reached.
What are the technology options and alternatives?
• Keep up to date with technology options through farming contacts, social media chats,
discussion groups, field days and technology provider information
• Be open-minded about different ways to achieve a similar result
o e.g., installing technology to automate a daily task OR reducing the number of
milkings (flexible milking options like ‘3 in 2’, ‘7 in 10’, or OAD) leaving more time for
those tasks.
Will this technology meet your goals?
• Seek independent information (where available) on the technical performance.
• Speak with farmers who have experience using the technology and discuss their results
and experiences.
• Consider ease of use and the skills required to operate the technology successfully
• Assess the impact this technology will have across your business (e.g., profit, sustainability,
cows, people)
• Does it integrate with other technology on farm?
• What is a realistic return on investment and when will you break even?
Who will be the technology champion on your farm?
• It’s important that someone takes responsibility for ensuring every effort is made to get the
best performance out of the technology, adaptions to farm practices are made as required
and the team is supported in operating the system.
416.0 ENVIRONMENT
Our focus is to know and understand where our GHG emissions are coming from on farm. All
farmers need to know this by December 2022. By January 2025, all farmers will need to include
GHG management in their Farm Environment Plan (we are in the process of doing this now) and
be participating in a GHG reporting system.
Total GHG emissions is still being driven by production each season. Last season proved a
challenging year to balance profit goals with our environmental footprint. Both our biological
GHG and modelled N loss increased due to exceeding our production target. However, we were
able to do the same production as in 2016/17, but with a lighter environmental footprint (7%) while
generating more profit (27%).
Graphic 6.1: Biological GHG/ha over time
Biological GHG
11000
10500
10000
kg CO2E/ha/yr
9500
9000
8500
8000
2015 2016 2017 2018 2019 2020 2021
42Changes over the last seven years to lighten our environmental footprint include:
• Use Ballance SustaiN and Smartfert
• Reduce nitrogen application rates to below 30 kg N/ha per application
• Reduce total nitrogen used in conjunction with My Pasture Planner
• Reduce nitrogen application during May–July
• Use soil moisture probe and soil temperature data to ensure nitrogen is applied when soil
temperatures are above 10°C and soil moisture levels are above stress point
• Reduced stocking rate with reduced urine patches
• Reduction in imported supplements
• Breed high BW cows: currently top 6% nationally
• Reduce replacement rate using sexed semen and focusing on meeting youngstock
growth targets
• New pastures planted with Agricom Ecotain Plantain (4 kg/ha)
• Retire and plant unproductive land
• Upgrade effluent storage facilities to eliminate spreading during the winter months
• Increase effluent area
• Conduct Soil Total N tests to determine most efficient use of nitrogen
• Constructed wetland with 63% removal of nitrates from a 7.6 ha catchment area
• Zero cultivation using direct drilling of PGG Wrightson Seeds Cleancrop varieties for all
crops
Graphic 3.2: Methane emissions projected to 2030 target of 10% reduction
43We continue to focus on improving cow efficiency and reducing wastage: • Improve reproductive performance (6 week in-calf rate to >78%,
WHY SOIL MATTERS FOR CLIMATE CHANGE - THE UNIVERSITY OF WAIKATO’S
RESEARCH ON OWL FARM

What are we doing?
In September 2020, the University of Waikato, in conjunction with the New Zealand Agricultural
Greenhouse Gas Research Centre (NZAGRC), established a field site on Owl Farm to study the effect of
turnip cropping and strip grazing on soil carbon (C) stocks.

We are using a two-pronged approach. Firstly, we are measuring and estimating all the major flows of
C into and out of the paddock(s) allowing us to calculate a carbon balance (Figure 1). This gives us
information on how big any change in soil C is and, perhaps more usefully, when any change likely
occurs. Our second approach is to measure soil C stock down to 60 cm before and after the turnip
cropping occurs. This will give us information on how much C is in the soil and at what depth, and is
complementary to the carbon balance information.

Figure 1: Generalised carbon cycling in a dairy system. Arrows that cross the boundary of the diagram
indicate where gains and loss of carbon from the pasture system occur. This of course differs between
farms.

45
Why is it important?
The over-arching goal of our soil C research is to understand how the management of agricultural
systems influences soil C, with the aim of identifying management practices that can increase soil C
stocks or minimise losses.

Our work at Owl Farm is aimed at determining how production and use of supplementary feed can
increase or decrease soil C. Investigating the consequences of grazing turnip crops on soil C builds on
our previous research into the consequences of importing a lot of supplemental feed and production
of maize silage. Importing supplemental feed to a farm can increase soil C stocks by a small amount
(~4% of the imported carbon in the feed is stored, but is spread over the entirety of the farm), and
maize silage production causes a large loss of soil C when rotated around a farm.

We hope to identify the best approach for producing extra feed from a soil C perspective that also
meets farmer needs.

Where are we at?
We established our field site in September of 2020 across a three-paddock block (total area of 5.4 ha).
Carbon balance measurements have been ongoing since then, although the data is yet to be
completely analysed. Turnips were planted in one of the paddocks in spring 2021 and were grazed over
~40 days during summer 2022. Since grazing ended in early February, the paddock has remained bare
and is due to be reseeded in early-mid March.

Despite the data not yet being completely analysed, one clear and expected trend is evident – since
grazing finished, the turnip paddock has been a source of C to the atmosphere (net loss of soil C) due
to the absence of any photosynthesising plants that provide inputs of C to the soil. Minimising the time
the paddock is bare reduces soil C losses, although we acknowledge that Waikato summer conditions
can make this challenging in the absence of regular rainfall.

Before establishing turnips, we collected soil samples from all three paddocks to determine the soil C
stocks for each paddock. Our data from this sampling indicated soil C stocks were 121, 129 and 141 t C
ha-1 for the three paddocks.

What’s next?
Our experimental work is planned to continue through the next two summers as each of the
remaining two paddocks are cropped with turnips. Carbon balance measurements will be ongoing
throughout this time to not only look at the effects of the turnip crop itself but also how the C balance
changes upon a return to permanent pasture. These crops will likely result in relatively large initial
losses of soil C but we will also determine how quickly this lost carbon is recovered in the years
following return to pasture.

Once this summer’s turnip crop paddock has been returned to permanent pasture, we will be taking
more samples to measure the soil C stocks for comparison with our initial measurements. A similar
process will be repeated once the other two paddocks are cropped in the next two summers.

Contact Information
For more information on our research please feel free to contact either Louis Schipper
(louis.schipper@waikato.ac.nz) or Aaron Wall (aaron.wall@waikato.ac.nz).

46
Next Farm Focus Day
                        Thursday 5th May, 2022

                       Weekly Farm Walk
                           Tuesdays, 10am

                          facebook.com/OwlFarmNZ

                           twitter.com/OwlFarmNZ

                                Owlfarmnz

     Subscribe to weekly updates by emailing enquiries@owlfarm.nz

47
You can also read