G20 CLIMATE RISK ATLAS - Impacts, policy, economics - CMCC Foundation
←
→
Page content transcription
If your browser does not render page correctly, please read the page content below
G20 CLIMATE RISK ATLAS
Impacts, policy, economics

ITALY
                                                                                                                                     With the scientific
                                                                                                                                      contribution of
                                                                                                                                     Enel Foundation

How to read the Atlas: graphs, colours and scenarios.
The maps used in this Atlas are taken from The World Bank Official Boundaries -
(accessed on May 28, 2021). For the section Energy, the maps are based on Panoply Data Viewer
Each sector of this Atlas contains data and information on various climate scenarios.
When reported in graphs, the colour black indicates data and information referring to the current state, the past or the baseline.
When the authors refer to RCP (Representative Concentration Pathways), the 3 colours used across the factsheet refer to 3 scenarios, which are 3
different development options with different levels of greenhouse gas emissions, respectively low emissions (green), medium emissions (orange), and
high emissions (red). The same colour code is used when RCPs are associated with Shared Socioeconomic Pathways (SSP).
In some cases, the authors refer to global warming scenarios. In these cases, the 3 colours used refer to a temperature rise of 1.5°C (green), 2°C (dark
green), and 4°C (red).
When the authors refer exclusively to Shared Socioeconomic Pathways - SSPs (Population affected by river floods in the section: “Water"), data related to
SSP3 - that encompasses, among other things, slow economic growth, material-intensive consumption, and persisting or worsening inequalities – are
reported in a lighter shade; SSP5 – which refers to social and economic development that is coupled with an energy-intensive lifestyle and the abundant
exploitation of fossil fuel resources – is shown using a middle shade of the colour, whereas data related to the present conditions are represented in a
dark shade.
Further details on scenarios, methodologies, and the full list of references are available at: www.g20climaterisks.org
                                                                                                                      Concept and graphic design by element6.eu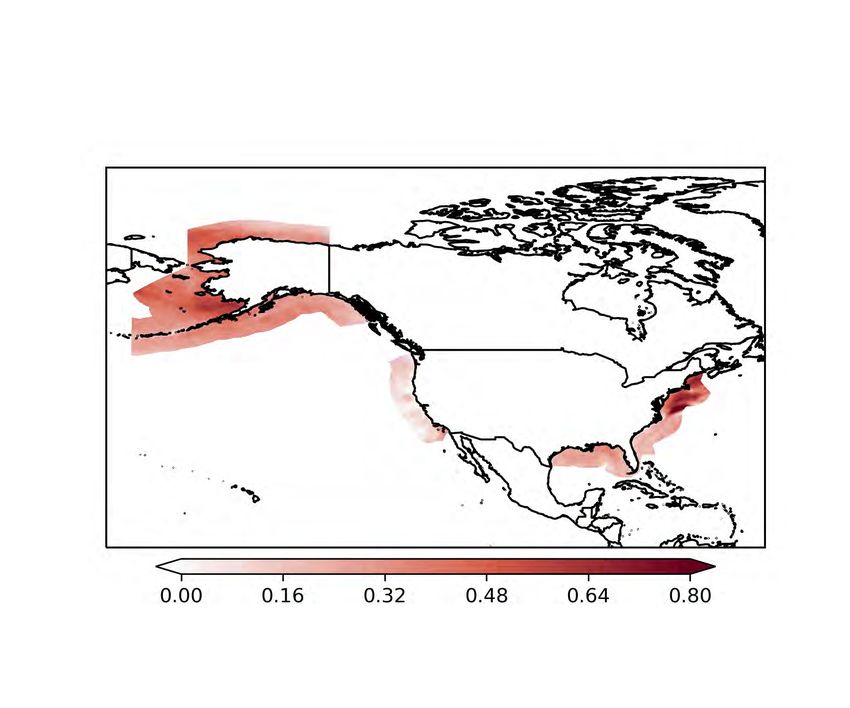
ITALY

CLIMATE
OVERVIEW                                                                  TEMPERATURE PROJECTIONS
Italy is characterized by an extremely variable climate,                  Under a low emissions scenario projected temperature variations will
which is mainly due to the long extension of the coun-                    remain contained at around +1.5°C, both by 2050 and 2100.
                                                                          Under a high emissions scenario, with no reduction in GHG emissions,
try and its geographical position. The northern part                      much greater temperature anomalies are expected by both 2050 and
exhibits a climate that is similar to the European conti-                 2100.
nent whereas in the South is typically Mediterranean.
Finally, the Alps are relativity cold with very peculiar
climate features.                                                                                                                      +5.9°C
                                                                                  TEMPERATURE                                          +2.7°C
                                                                                  ANOMALY                                              +1.7°C

TEMPERATURE                                                                                                         +2.5°C
Temperatures in Italy are regulated by the complex orography, ranging                                               +1.9°C
from high mountain chains (Alps and Apennines) to a very diverse                                                    +1.3°C
coastline. Overall, temperatures are lower in Northern Italy and higher
in Southern Italy.
                                                                                              +0.7°C

MEAN                         -1                                   19
                                                                           -0.4°C
TEMPERATURE                        Celsius degrees / Over 1991-2020

                                                                           1985               2014                  2050                  2100

                                                                          Historical Period

                                                                          EXPECTED VARIATION
                                                                          FOR TEMPERATURE AT 2050
                                                                          The indicators show variations in selected temperature characteristi-
                                                                          cs for a thirty-year period centred on 2050 (2036-2065) with respect
                                                                          to the reference period 1985-2014.

TEMPERATURE TREND                                                                     +2.4°C                  +3.7°C                     +1.9°C
Temperature anomalies over the last 60                           max
years with respect to the annual mean of                       1.7 °C                   +1.8°C                  +2.7°C                        +1.5°C
13°C in Italy during the 1961-1990 period
                                                                                      +1.5°C                  +2.5°C                     +1.3°C
 1961                                                                     Annual Mean            Max Temperature           Min Temperature
                                                                          Temperature            of warmest month          of coldest month

                                                               2020
 -0.7 °C
 min
PRECIPITATION                                                                  PRECIPITATION PROJECTIONS
The precipitation regime changes a lot due to the complex orography            Precipitation trends show a very complex signal,
and occurrence of different precipitation dynamics.                            under all emissions scenarios, with a very large
The Alps have the highest annual precipitation values, followed by the         variability among climate models. This can be explai-
Apennine mountains, which run down the entire peninsula.                       ned considering the complexity of the precipitation                  -14.8%
Precipitation patterns show neither pronounced nor constant trends             regime and dynamics requiring                                         -5.8%
on the Italian territory, due to the complexity of the precipitation           more detailed spatial and tempo-                                      -7.0%
regime and to possible compensation between opposite patterns                  ral analysis.
reported at a local level.
                                                                                        PRECIPITATION                            +0.4%
                                                                                        ANOMALY                                  +4.2%

MEAN                         399                                 3,331
                                                                                                                                 +3.8%
PRECIPITATION                              mm/year / Over 1991-2020
                                                                                                       -4.2%
                                                                                -1.9%

                                                                                1985                   2014                      2050                   2100

                                                                              Historical Period

                                                                               EXPECTED VARIATION
                                                                               FOR PRECIPITATION AT 2050
                                                                               The indicators show variations in selected precipitation characteristi-
PRECIPITATION TREND                                                            cs for a thirty-year period centred on 2050 (2036-2065) with respect
Precipiation anomalies over the last 60                                        to the reference period 1985-2014.
years with respect to the annual mean of                              max
1,025 mm/year in Italy during the                                   +31%
1961-1990 period                                                                               -2.1%                          +0.8%                     -7.2%
 1961                                                                                            +0.4%                           +2.4%                   -4.4%

                                                                                               +1.5%                          +4.8%                     -5.4%
                                                                                Annual total                  Precipitation of           Precipitation of
                                                                                precipitation                  wettest month             warmest quarter

 -24%                                                             2020
 min
                                                                 +35%                           +31%                          +1,461%                   +59%

                                                                  +19%                           +15%                            +261%                      +29%
VARIATION OF SPECIFIC                                            +14%                           +12%                          +100%                     +10%
CLIMATE INDICATORS                             Agricultural drought         Hydrological drought                 Heatwave                    Runoff
                                                proportion of time           proportion of time                  duration                   increase
Climate indicators variation showing                % of time                     % of time                      % of time                  % of area
impacts of climate change on sectors such
as agriculture, health and water. Analysis                       +74%                           +17%                          +80%                      +10%
considers 3 threshold average temperatu-
re increase: +1.5°C, +2°C, +4°C.                                  +50%                           +12%                            +35%                       +6%

                                                                 +35%                           +14%                          +21%                      +4%

                                                   Agricultural                Hydrological                      Heatwave                    Runoff
                                                drought frequency            drought frequency                   frequency                  decrease
                                                   % of change                   % of change                    % of change                 % of area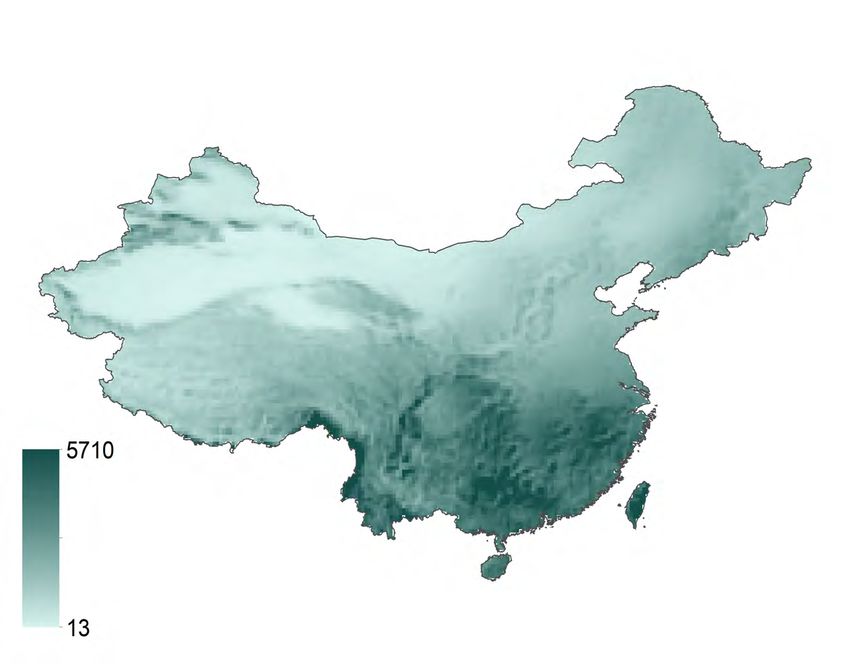
ITALY

OCEAN
OCEAN IN ITALY                                                       FUTURE PROJECTIONS
Italy's marine exclusive economic zone (EEZ) is mainly               Projected annual changes within the marine EEZ for the two most
characterized by a Mediterranean climate and hosts a                 significant marine indicators of climate change: sea surface water
large variety of ecosystems such as seagrass                         temperatures and pH.
meadows, rocky reefs, and lagoons. The wide                          Seawater temperature changes are in line
ensemble of coastal systems can be divided into three                with the definitions of each scenario, with
                                                                     maximum values in 2100 close to +5°C under
main subbasins: the Adriatic, Ionian, and Tyrrhenian                 a high emissions scenario.                            +4.9 °C
seas.                                                                                                                       +2.6 °C
                                                                                                                            +1.7 °C

CURRENT CLIMATE CONDITIONS
                                                                             SEA SURFACE            +2.2 °C
Mean sea surface temperature reflects the Mediterranean climate
regime, with cold waters located in the northern areas and warmer            TEMPERATURE            +1.7 °C
                                                                             ANOMALY
ones along the southern coasts.                                                                     +1.6 °C

                                                                                       0.4 °C

                                                                      -0.4 °C

 17                                         21         MEAN           1950                 2014         2050                   2100

SEA SURFACE TEMPERATURE
Celsius degrees / Over 1991-2020

 0.1                                       0.5        TREND
                                                                      0.05

                                                                                        -0.02

                                                                                                       -0.11
                                                                             SEA SURFACE
                                                                             pH ANOMALY                -0.13
                                                                                                       -0.16

                                                                     Seawater surface pH becomes more acidic in                -0.1
                                                                     all scenarios, closely reflecting rising                 -0.19
                                                                     atmospheric CO₂ concentrations, and only a
                                                                                                                             -0.38
Surface temperature trends indicate a general warming of 0.5°C per   low emissions scenario leads to a stable
decade in all marine areas.                                          condition by 2100.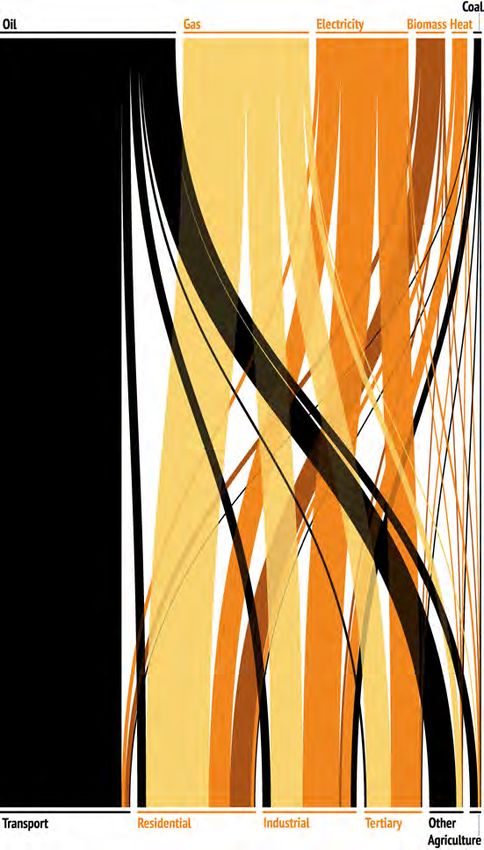
ECOSYSTEM
INDICATORS AT 2050
Regional changes in key marine ecosystem indica-
tors under projected future scenarios by mid-cen-
tury (2036-2065) with respect to present climate
conditions (1985-2014). Adriatic Ionian Tyrrhenian
+2.12 °C +2.62 °C +2.16 °C
Temperature regulates the metabolism of marine
organisms determining which habitats remain 17.94°C +1.72 °C 19.44°C +1.83 °C 18.78°C +1.56 °C
suitable. Excessive warming will likely push
ecosystems beyond tolerance thresholds. +1.71 °C +1.67 °C +1.68 °C
-0.16 -0.16 -0.16
pH represents the acid/base status of marine
waters, where a decreasing pH reflects the 8.11 8.1 8.11
-0.13 -0.13 -0.13
acidification of the ocean due to increased
absorption of atmospheric CO₂. -0.1 -0.11 -0.11
Oxygen is fundamental to sustain marine life and -4.96 % -4.46 % -3.04 %
its reduction can have a large impact on coastal 242.17 -3.48 % 233.36 -3.03 % 236.54 -2.1 %
ecosystem services including fisheries and mmol/m3 mmol/m3 mmol/m3
aquaculture. -3.03 % -2.5 % -1.54 %
Chlorophyll is an indicator of the biomass -0.59 % 0% +13 %
available at the base of the marine food web 0.17 +22.35 % 0.13 -27.48 % 0.1 -7 %
supporting all ecosystem productivity. mg/m3 mg/m3 mg/m3
+4.12 % -14.5 % -4 %
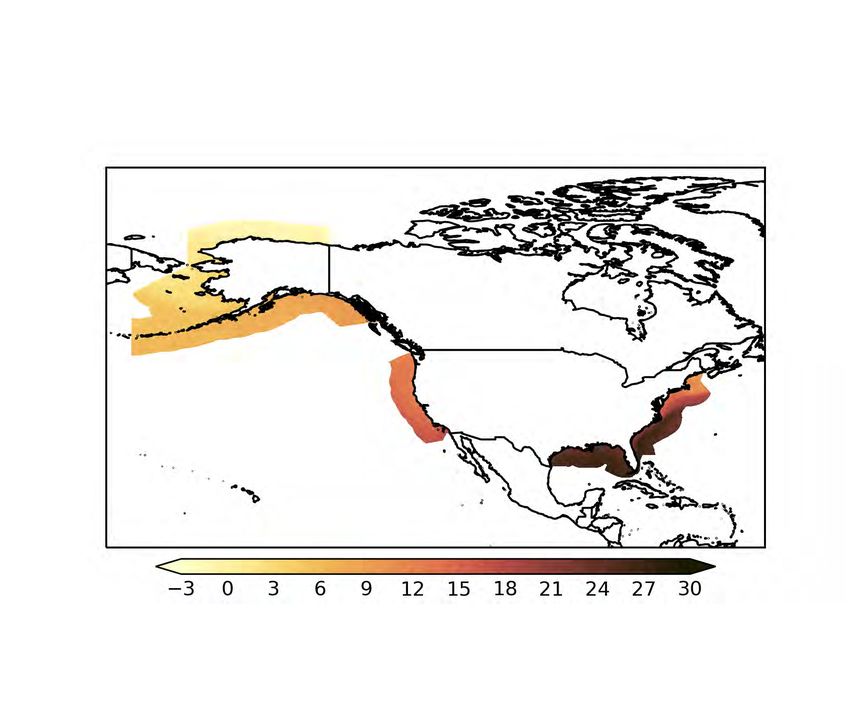
FISH CATCH POTENTIAL ANALYSIS DETAILS
Fish catch potential is an estimate of the maximum fish catch achie- All datasets were analysed using only data from within the
vable given the marine resources available over a sustained period. It marine EEZ and therefore excluding overseas territories,
is linked to the concept of maximum sustainable yield, meaning the detached islands and any disputed or joint territories with
maximum amount of fish that can be extracted from a system without other nations. In the assessment of current climate conditions,
causing a collapse in fish populations. seawater surface tempererature data was obtained using
satellite observations distributed in the framework of ESA
It is a characteristic of the natural system, which is substantially Climate Change Initiative.
different from realized catch, and a direct result of the fishery policy in
place. Future projections of marine indicators are represented by the
combined analysis of results from 15 different Earth System
While no specific data is available for the Italian EEZ, a decrease models participating in the Coupled Model Intercomparison
between 0 and 5% in potential catch for the Mediterranean Sea at mid Project Phase 6 (CMIP6). These models include new and better
century has been projected under a high emissions scenario. representations of physical and biogeochemical processes,
compared to previous IPCC assessment reports.
Fish catch potential data was obtained using the FAO's techni-
cal report and refers to the best and worst case climate scena-
rios from the Fifth IPCC Assessment Report. These mean
estimates are subject to substantial uncertainties as discussed
in the original work.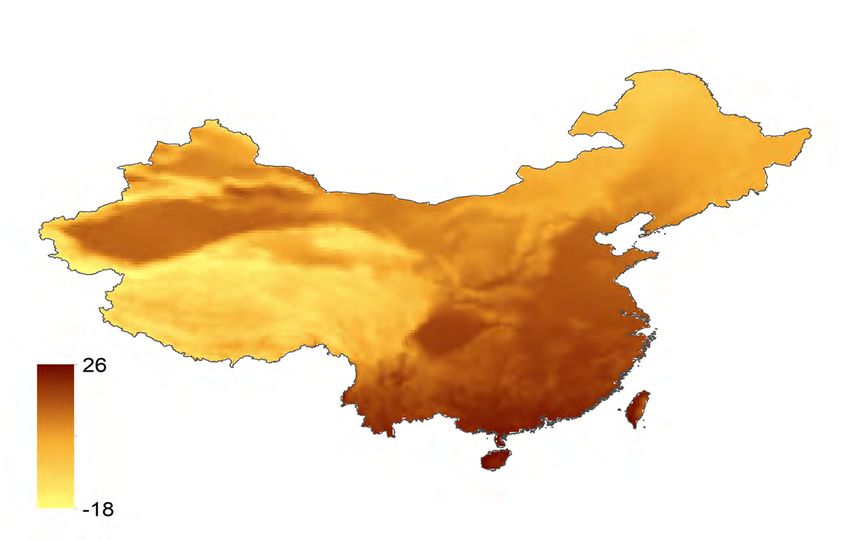
ITALY

COASTS
OVERVIEW
Surrounded by the Mediterranean and Adriatic seas,
and with a total length of over 9,000 kilometres, Italy’s
coastline is exceptionally geographically diverse as                              Shoreline                              9,226 km
well as both historically and economically valuable for                           Length
the country. Among the coastlines most notable featu-
res is the variety of natural features such as rocky and
sandy beaches, cliffs, river deltas, wetlands and lago-
ons. It is also home to a significant proportion of the                            Sandy
population.
                                                                                  Coast Retreat                                             -17.4 m
                                                                                  at 2050

CLIMATE CHANGE HAZARDS
Coastal hazards such as erosion, storm tide inundation and permanent             and temporary inundation due to storms are quite common along the
flooding, can have strong adverse impacts on coastal regions, with                Italian coast, in particular in areas with low lying beaches. The country
loss of sandy shores, damage to settlements, infrastructure and ecosy-           has already begun to feel the impacts of sea level rise, with numerous
stems. Climate change can exacerbate these impacts due to rising sea             areas being exposed to the impact of inundation and storms, such as
levels and increasing impacts of waves and storms. Coastal erosion               the North Adriatic Sea and the Venetian lagoon.

SEA LEVEL RISE                                                                   EXTREME SEA LEVEL
Based on observational data, the average sea level rise for Italy has            On average, one in 100 extreme sea level events are expected to rise
been estimated at 1.64 millimetres per year since 1903, with the                 from 1.12 metres at present day to 1.31 metres by 2050 under a
Northern Adriatic area identified as one of the most susceptible to sea           medium emissions scenario.
level rise. The latest IPCC projections indicate that, by 2050, global sea
levels may rise between 0.18 metres, under a low emissions scenario,
and 0.23 metres, under a high emissions scenario.

                                                                   0.23 m                                                                           1.39 m
Observed and                                                                     Current and
projected sea                          1.64                                      projected extreme                   1.12 m                          1.31 m
level rise at 2050              mm/year                                          sea level at 2050
                                                                   0.18 m

  OBSERVED                                                                          FUTURE
 STORMS            Several regions of the Italian coast, such as the low-lying
                   and subsiding Po Delta, are vulnerable to the effects of
                                                                                  STORMS            A projected increase in the frequency and intensity of
                                                                                                    extreme waves and storms could worsen the coastal
                   storm surges and extreme waves. Although the Mediter-                            impacts of climate change significantly, especially when
                   ranean Sea sees relatively small tides and low energy                            considered in combination with sea level rise, which will
                   storms an increasing number of extreme events are                                increase the probability of such events as well as
                   being observed, causing alarm due to fears of erosion                            compounding their severity. Although it is possible that
                   and other damages, particularly given a rising coastal                           storms may not increase in severity in a significant way,
                   population.                                                                      expected sea level rise is likely to lead to more severe
                                                                                                    impacts.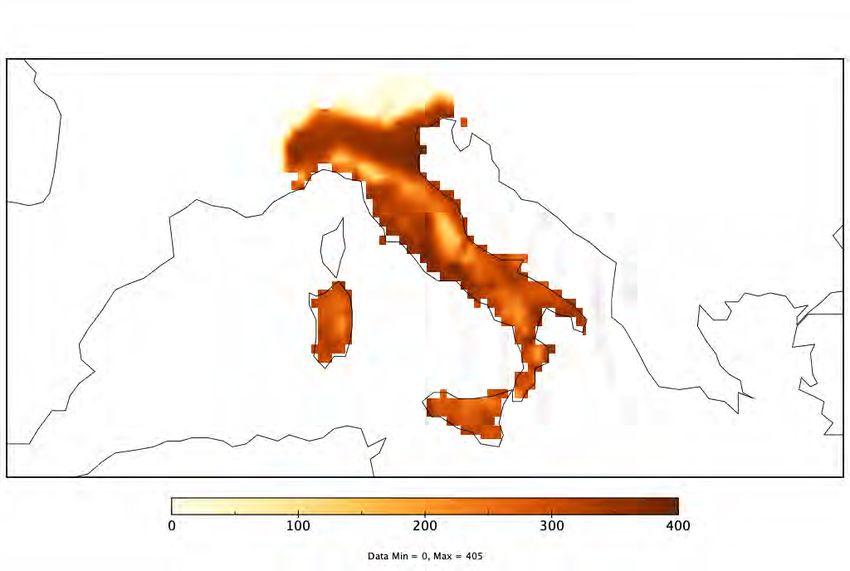
VULNERABILITY AND RISK
         Several important sectors are particularly vulnerable to                                                       VULNERABLE
         climatic risks, including coastal tourism, which is hugely                                      HISTORICAL     POPULATION
         important to the Italian economy, as well as industrial
         activities and important infrastructure and assets.

         Of particular note is the historic city of Venice, which is                                  0.43 Million
         already facing significant impacts from sea level rise
         and storm surges, threatening many points of cultural
         heritage.
                                                                                                                                      0.48 Million
                                                                                                           2050

         Numerous Italian localities suffer from chronic beach erosion and                                                              0.48 Million
         coastal risks have been increasing in the past few years, going hand in
         hand with increasing costs of shoreline protection and management.                                                           0.48 Million

         Furthermore, the fragile ecosystems that can be found in coastal areas,
         and the wildlife that inhabits them, will be threatened by degradation,
         saltwater intrusion, and loss of habitat. Under a medium emissions                                                           0.56 Million
                                                                                                           2100
         scenario, the population exposed to the annual coastal flood level is
         expected to increase from 430,000 to 480,0000 people by 2050.                                                                  0.54 Million

                                                                                                                                      0.52 Million

                           INFLUENCE OF SEA LEVEL RISE
                           ON EXTREME SEA LEVEL                                              + Wave set up refers to the accumulation of water near
                                                                                             the shore due to the presence of breaking waves.
         Present and future sea level rise are a consequence of
         carbon induced global warming causing melting ice                                   + Storm surge is an occasional increase in sea level driven
         and ocean expansion due to heat accumulation.                                       by shoreward wind-driven water circulation and atmo-
                                                                                             spheric pressure.
         The extreme sea levels reported here are based on the 100-year storm
         surge + wave set up + sea level rise + high tide indicators. The first two           + High tide is usually the highest tide reached in a given
         parameters (storm surge + wave set up) are based on the 100-year                    location based on tide records.
         value for the event; sea level rise is its projected value at 2050; and
         high tide is the absolute value of the highest tide calculated for a
         given locality, which won’t be influenced by climate change.

                                                                                                                                                 Wave set up
                                                                                                                                                         Storm surge
         Wave set up                                                                                                                             Storm surge
Storm surge
        Storm surge
          Lowest  tide

            Mean sea level                                                  Extreme     Mean sea level
                                                                                                                                                 Sea levelSea
                                                                                                                                                           riselevel rise
Sea levelSea
          riselevel rise                                                    sea level
                                            0m elevation (AHD)                                                         0m elevation (AHD)
Hig tide Hig tide                                                                       Lowest tide                                                   Hig tide Hig tide

         Present sea levels have risen globally by approximately 20 centime-            Future sea level rise is a projection based on different global
         tres over the past century.                                                    warming scenarios, at approximately 100 centimetres by the end of
                                                                                        2100, with consequent inundation during extreme sea level events.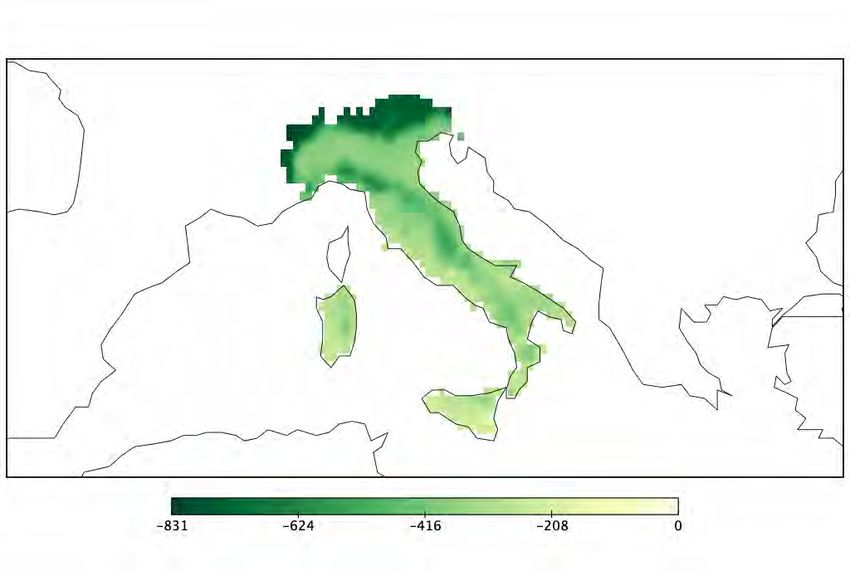
ITALY

WATER
OVERVIEW
Italy's water resource distribution is driven by a highly
variable annual rainfall, both in volume and spatial                         Renewable internal                        183
distribution. The trend over time and the distribution                       freshwater resources                billion m3
of cumulative annual rainfall are quite diversified.

This variability affects runoff, streamflow, groundwater
recharge and water availability for human activities.
Due to its geographical distribution, Italy experiences                      Renewable internal                     3,014
great meteorological variability from one region to the                      freshwater resources                        m3

other, which affects the availability of natural water                       per capita
resources.
                                                                            Italy’s water resources are distributed as follows: 60% agriculture,
The main rivers and the largest lakes are located in the                    25% energy and industrial sector, and 15% civil uses. Inefficiencies in
northern and central parts of the country.                                  distribution networks result in losses of around 40% for both drinking
                                                                            and irrigation waters. The most important rivers in Italy are located in
                                                                            the North of the country, including the Po, Adige and Brenta.

CLIMATE CHANGE HAZARDS
Climate change can affect water resources through increasing tempe-         security has been deeply affected by climate change: the country is
ratures, higher rates of evapotranspiration and altered rainfall            prone to water-related hazards and climate change is expected to
patterns. This leads to changes in the water cycle, including decrease      increase its vulnerability in coming decades. In the north of Italy, cities
of snow and ice coverage, alterations of surface runoff and groundwa-       that are vulnerable to extreme weather events, such as Venice and its
ter storage, as well as drought and flood occurrence. Italy's water          lagoon, are particularly at risk.

KEY POINT RUNOFF
                                                                                                                                           -2.3%
Marked variations in the fluvial seasonal streamflow may be observed          2050
due to climate change. In particular, an increase of the flow rate is                      Changes in
expected in winter in the Alps and at high altitudes, along with a                        annual runoff
decrease in the Po river, in the Italian plains and in summer, due to the                 % of change
changes in the snow line and in the water/glacial reservoirs.                                                                              -6.3%
At a country scale, an average decrease in surface runoff by approxi-
mately -6% and -2% is expected respectively under low and medium
emissions scenarios for the 2045-2055 period compared to                                                                                   +10.0%
2015-2025.                                                                  2050
                                                                                         Runoff increase
If temperatures rise by 1.5°C, 2°C or 4°C, 4%, 6.1% or 10% of the area                   % of area
of the country will likely experience an increase in runoff, while 10%,
28.6% and 59% of the surface of the country will likely experience a                                                                       +4.0%
decrease in runoff, respectively.
KEY POINT DROUGHTS
                                                                                                                                  +23.6%
The central and southern regions of Italy are more likely to experience
severe drought events: a common feature of Mediterranean droughts
                                                                             2050     Severe drought
is the persistence of high pressure systems. In the Mediterranean area,               likelihood increase
drought seems to be connected to La Niña, an anomalously high                         % of change
cooling of the equatorial Pacific Ocean; out of 14 La Niña events,                                                                 +14.0%
occurring between 1865 and 1990, 13 were associated with droughts
in the Mediterranean area. In southern Italy, a widespread decreasing
trend of annual rainfall is observed over 97% of the whole area from
1921 to 2001.                                                                                                                     +17.0%
The likelihood of severe droughts in Italy is expected to increase by
                                                                             2050     Hydrological
6%, 19.6% and 23.6% (2040-2059) under low, medium and high                            drought frequency
emissions scenarios. Similarly, If temperatures rise by 1.5°C, 2°C or                 % of change
4°C, there is an expected increase of hydrological drought frequency                                                              +10.0%
by 11%, 12.2% and 13%, respectively.

KEY POINT GROUNDWATER                                                                                                             -6.8%
Italy is one of the European countries where problems of groundwater         2050     Groundwater
overexploitation and subsequent salinization are felt most severely.                  Recharge
Groundwater recharge in Italy shows a declining trend, with conse-                    % of change
quent shrinking of fresh groundwater resources, especially in coastal                                                             +5.9%
areas.

Due to the general decreasing precipitation trend in Italy (especially
in the center and south of the peninsula), groundwater recharge is           a +5.9%, -1.7% and -6.8% change of the annual groundwater recharge
threatened, in particular in the least rainy regions. In addition, coastal   for the period 2040-2060 compared to the timeframe 2010-2030 is
groundwater may be susceptible to changes in salinity because of             expected respectively under under low, medium and high emissions
saltwater intrusion, associated with sea level rise. At the country level,   scenarios.

KEY POINT FLOODS                                                             POPULATION AFFECTED BY RIVER FLOODS
Italy is prone to floods, with 28 large events affecting Italy between
1939 and 2004, causing 694 victims, leaving 1.5 million people                TODAY                                                   17,366
homeless, 2.85 million people affected and vast economic damage.                                                                       people
Many Italian cities have experienced severe flooding events in recent
years: for instance, in Rome, between 2010 and 2019, 18 flash flood             2050 SSP3                                               76,104
events occurred; in Milan 23 analogous events, 17 of them related to                                                                   people
flooding of the Seveso and Lambro rivers.
                                                                              2050 SSP5                                             103,529
Changes in the population exposed to floods are expected, with an                                                                       people
increase from about 17,000 in the present day to 76,000 under SSP3
and 103,000 under SSP5 by 2050. As such, potential impacts related
to river floods might increase.

RISK INDICATORS
The water stress index summarises current and future water related
vulnerabilities and risks at the global level. Scores are based on the
ratio of total water withdrawals, including agriculture, industrial and
human consumption, to available renewable surface and groundwa-
ter supplies.

WATER STRESS
Italy's water stress level is considered high for the recent past
(1960-2014 average), and it is expected to increase in the near future
(2030-2050) based on climate change projections.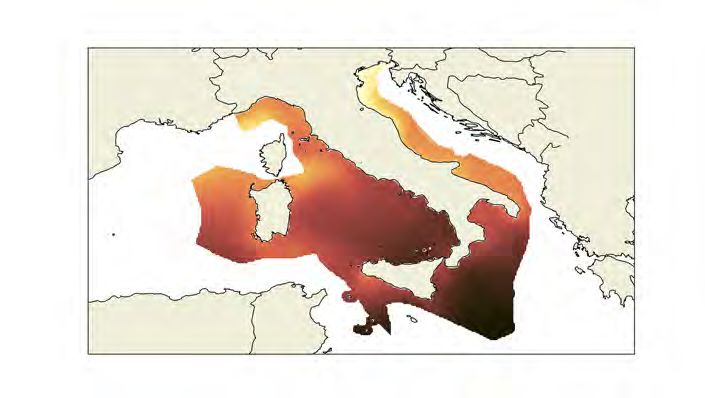
ITALY

AGRICULTURE
OVERVIEW
Italy is a major agricultural producer and exporter, with
agriculture still a relevant sector in terms of GDP and
employment.
The Italian landscape and its agriculture are highly diversified,                8.5 Mt               7.1 Mt               6.2 Mt
ranging from highly intensive farming in northern Italy to extremely            Grapes               Wheat                 Maize
marginal and fragmented farms in mountain zones and southern Italy.
More than half of the total agricultural area is cultivated with arable
crops (54.5%), whereas the rest features grasslands and pastures
(26.7%) and agricultural woody crops (18.5%). Maize and wheat
account for about 80% of total cereal production. Among tree crops,
the cultivation of olive and grapes stand out.

Irrigation adsorbs about 50% of total water withdrawal, and is mostly           5.7 Mt               2.5 Mt               1.9 Mt
used for maize, vegetables, fodder crops and several tree crops (olives,        Tomato               Citrus               Olives
grapes, citrus, etc.).

Added Value of Agricultu-              Share of Agriculture                   Agricultural                          Area Equipped
 re, Forestry and Fishing            Value added in Total GDP                    land                                for Irrigation

                                2000                                   2000                          2000

          38,294                                 2.1 %                          11,284                                     3,856
         USD Million                                                          Thousand HA                              Thousand HA

                                 2018                                  2018                           2018

          36,655                                 1.9 %                           9,160                                     4,124
         USD Million                                                          Thousand HA                              Thousand HA

EXPECTED IMPACTS
ON AGRICULTURE PRODUCTIVITY                                                                                                Rising
                                                                                                                     temperatures
                                                                                     Changes in
Rising temperatures, reduction in average annual precipitation, and                  precipitation
intensification of extreme events such as heat waves and drought,                     patterns
affect production variability with a tendency towards yield                                                                 Increased
reduction for many cultivated species, accompanied by a probable                                                     frequency of dry
decrease in food quality. Crops respond to increases in temperatures                                               spells and drought   Temperature
with changes in duration of the growing season, early appearance of                                                                       variability
phenological phases and potential shifts of cultivation areas toward                                  Increasing intensity of
higher latitudes and altitudes for better growing conditions. Howe-                                   extreme weather events
ver, impacts vary significantly depending on the geographical area
and specific crops in question.
CROP PRODUCTIVITY 3.9 9.4 (2.9)% 10.2 1.9 (-0.3)%
Crop productivity refers to the harvested yield of a crop per unit of
land area. It is strongly influenced by climate and other environmental 11.4 (5.7)% 1.5 (-2.7)%
and management factors. Wheat Maize
tons / ha tons / ha
Climate change is expected to have an impact on the productivity of
several major crops, although this may in part be offset by the fertili- 6.7 11.2 (-1.3)% 57.9 7.8 (0.4)%
zing effect of higher CO₂.
13.7 (-0.9)% 9.8 (na)%
Impacts are estimated using a range of model projections based on Rice Sugarbeet
tons / ha tons / ha
low to high emission scenarios and reported as percentage changes
between the 30-year average around the historical period and the
30-year average around 2050. Productivity change with (without) the CO₂ fertilization effect.
2050
Estimates assume sufficient water and nutrient supplies, and
do not include impacts of pests, diseases, or extreme events.
CHANGE IN WHEAT CHANGE IN MAIZE
_ = + _ = +
Although wheat productivity is expected to decrease in southern Italy suffer from extreme temperatures during flowering and ripening.
and the major islands, it is expected to see a general increase over Increasing frequency of extreme weather events during crucial crop
central and northern Italy. Maize is the main affected crop with signifi- development stages (e.g. heat stress during flowering, rainy days
cant losses in yield and some increases at higher elevation. Large yield during sowing) may reduce yields, particularly of summer crops.
reductions are also expected for spring-summer crops (sunflower, soy), Tree crop productivity is expected to decrease in Mediterranean areas
especially if not irrigated. Rice may see a general yield increase until due to drought and high temperatures, which can also deteriorate fruit
mid-century, followed by a decrease. However, rice productivity may quality, pushing cultivation of olive and grapes towards colder regions.
ADAPTATION IN AGRICULTURE AND WATER RESOURCES
Climate change may have some positive effects on some of the most change may affect water resources, pointing to a severe reduction in
widely used crops. However, higher temperatures will generally the quantity of renewable water resources, both superficial and under-
require an increase in irrigation demand due to higher plant evapo- ground, in almost all semi-arid areas. Water deficit will worsen in the
transpiration. Agriculture may therefore become more dependent on hot season when resources are scarce and demand for irrigation
more intensive irrigation, especially in the southern regions. Climate increases.
CHANGE IN WATER DEMAND
_ = +
Agriculture
Water Demand +17.7%
% of change
+18.8%
2050
A consistent increase in water demand (17 to 20% on avera-
ge) will be required to sustain current levels of agricultural
production, and it will require adaptation practices and crop
varieties that enhance water-use efficiency and limit stress
on water resources.ITALY
FORESTS
FORESTS IN ITALY
Forested areas in Italy, albeit largely fragmented, are 1990
considered the most important nature-based solution
with which to face the unfolding climate emergency.
Due to its complex topography, Italian forests include a 8 Mln ha 140 Tons/ha
wide variety of types such as deciduous broadleaved Million hectares Tons of Carbon per hectare
woods, mediterranean sclerophyllous and boreal coni- Forested area Carbon stock
ferous forests in the Alps.
2020
FORESTED AREA AND CARBON STORAGE
With a constant increase in recent decades, Italian forests have come
to cover nearly 40% of the territory. Italian forests remove approxima- 10 Mln ha 157 Tons/ha
tely 46.2 million tons of carbon dioxide from the atmosphere each Million hectares Tons of Carbon per hectare
year, which amounts to 12.6 million tons of accumulated carbon. Forested area Carbon stock
FOREST PRODUCTIVITY 2050
Forest productivity or Net Primary Production is the net carbon captu- Productivity anomaly +1.03
red by plants. It is the difference between the carbon gained by Gross Tons of Carbon per
hectare per year
Primary Production - net photosynthesis measured at the ecosystem +0.77
scale - and carbon released by plants' respiration. It is expressed per
unit land area.
Generalized increase expected throughout the country
except for the western and eastern mountainous
areas. Very marked increase under a medium
emissions scenario
+ Fertilizing effect of increasing atmospheric CO₂, nitrogen
deposition, rising temperature and increasing length of growing
season promotes productivity
No areas with an expected decrease in forest primary
production
+ Prolonged periods of drought stress reduce productivity
KEY SPECIES
VULNERABILITY SPREAD
SPRUCE THERMOPHILOUS
UNDER Forests dominated by spruce will have a
very high vulnerability
Progressive natural spread of lower altitude
thermophilus species strips both in the Alps
CLIMATE and Apennines
CHANGE EXPANSION
MED OAKS
VULNERABILITY
BEECH
Considerable expansion of mediterranean Negative variation in suitability values is
oaks such as the holm oak, downy oak and expected for European beech, especially in
Turkey oak the central and southern ApenninesFIRES IN ITALY WHERE DO FIRES OCCUR?
Fire is a structural ecological process that provides several types of Social factors such as unplan-
ecosystem services and impacts on socio-ecological systems, ned urbanization, land use
including human health, carbon budgets, and climate change. Changes Between 2000 and 2017, changes, as well as population
in global fire activity are influenced by multiple factors such as agricultural lands and pastures dynamics including rural exodus
land-cover change, policies, and climatic conditions. Fire also releases were most affected contributing and population ageing, have
large quantities of greenhouse gases into the atmosphere, contribu- to 58% of the total burned area. had a significant effect on fire
ting to a vicious cycle. Heartland and shrubland fires event frequency, particularly in
contributed to approximately the south.
During the last three decades, the total area affected by fire was 17.2% of the total burned area.
approximately 2.6 million hectares with 238 thousand fires occurring.
BURNING EMITTING
2.6 MILLION HECTARES 0.83 TERAGRAMMES
OF CARBON PER YEAR
Fires are concentrated in the
southern regions of Sicily,
Sardinia, Calabria, and The 2017 fire season was one of
FOREST FIRE EMISSIONS
12% OF TOTAL FIRE RELATED
COSTING Campania during the summer the worst in recent decades in
580 MILLION USD IN FIRE
CARBON EMISSIONS
SUPPRESSION AND FIRE months, representing 14% of terms of burned areas, with 160
DAMAGES IN 2005 ALONE total burned area in Europe thousand hectares burned,
over the last two decades. exceeding the 2008-2016
average by approximately 300%.
FUTURE BURNED AREA VARIATION OF SPECIFIC
Under a low emissions scenario, models project that the burned
area will mainly increase in Sardinia, Sicily, central and southern Italy. FIRE INDICATORS
This might predominantly affect sclerophyllous and semi-
deciduous forests. Burned area under a medium emissions scenario
is expected to follow a similar spatial pattern. % of change 2041-2070
High fire-risk days +46%
2050
Burned Area +131
km² per year
% of change 2041-2070
+120
Fire season lenght +11%
+46%
% of change 2010-2050
PM2.5 emissions +41%
FUTURE FIRE EMISSIONS
Fire emissions might follow the same spatial pattern as burned
area with the added variable of a large increase in the alpine areas.
Under a medium emissions scenario, this pattern is expected to
be more pronounced.
Decrease in burned areas for a low emissions scenario
2050
Increase in burned areas for a low emissions scenario Fire Carbon emission +1.3
+ Prolonged and more intense fire seasons and an increase in future fire Teragrams of Carbon per
weather risk due to warming and drought conditions year
+1.0ITALY
URBAN
OVERVIEW
In 2020, 71% of the population lived in urban areas. 2020
This rate is expected to increase slightly by 2050,
reaching 82%. 42,006,701
Population in
The Italian urban landscape is dominated by small Urban Areas
towns, whereby almost half the population live in cities 2050 44,670,873
with less than 300,000 inhabitants and more than one
third live in the four main Italian cities with more than
1 million inhabitants.
This situation, with a high rate of sub-urbanization, will Graphs refer to data provided by United Nations, Department of
Economic and Social Affairs, Population Division (2018). World Urbani-
not change substantially in the near future considering zation
the slightly declining demographic trend.
Built up areas cover 6.77% of Italy (20,387.38 square 2020
kilometers). 71.0%
Urbanization
Rate
2050
81.1%
OVERVIEW OF KEY
CLIMATE IMPACTS IN URBAN AREAS
Italian cities are most vulnerable to impacts from heatwaves and
flooding following intense precipitation events
+236.9%
HEATWAVES AND HEAT STRESS 2050
Cooling
Heatwaves are increasingly frequent and, in particular night-time Degree Days +78.3%
temperatures, contribute to health effects. During the 2003 European % of change
heatwave, Italy was one of the most affected countries where mortali- +47.1%
ty was up to two times higher than the European average.
During the 2003 heatwave particularly high numbers of heat related
deaths were observed in Turin, +23%, and Milan, +23%, a large amount +80.1%
2050
Heatwave
of which among the elderly, as well as people with low incomes and
low levels of education. frequency +35.1%
% of change
During a subsequent heatwave in 2008, mortality rates increased by +21.4%
22 and 30% in Rome and Milan, respectivley. From an analysis of
future climate scenarios, increasing mean and summer temperatures
and duration of heatwaves are expected for the whole country. +1,461%
Frequency, intensity and duration of heatwaves will be significantly
2050 Heatwave +261%
higher for urban areas. duration
% of time
+100%HEAT AND AIR POLLUTION
Heat related health impacts from rising temperatures in urban areas 2017
are accentuated by air pollution. While air quality has improved in Population exposed
94.8%
most EU countries during the past decade, the situation in Italy is to air pollution
improving at a slower pace. Safe levels of air pollution indicators such
as PM10 and PM2.5 were often exceeded in more than 30% of major
urban areas in Italy in 2017.
The Po plain experiences particularly high concentrations of air
pollution due to its geography, which causes frequent situations of air
stagnation. Urban population, and in particular the elderly and
children, suffer from the combined impacts of air pollution and high
temperatures. 2050 0.23 m
COASTAL FLOODING 0.18 m
Projected
In Italy, approximately 4,500 square kilometers of coastal areas are at sea level rise
risk of flooding due to sea level rise over the next 100 years; the areas
most at risk are situated in the northern Adriatic Sea, the Po delta and 0.77 m
the Venice lagoon, where there are highly urbanized areas, cultural 2100
heritage sites and industrial establishments situated below sea level.
0.38 m
"
+10%
FLOODING
2050 Runoff
Flooding from short but intense precipitation events affects Italian
increase +6%
% of area
cities frequently, due to an increasing rate of artificial surfaces both in
cities and throughout the country. This prevents water from infiltra- +4%
ting into the ground and causes increasing run-off and accumulation
of water in the lower parts of cities. Italy is exposed to a high risk of
flooding and landslides due to both its geography and rapid urbaniza- graphic trends. Flooding causes important economic damages and
tion. 91% of Italian municipalities are exposed to medium risks of frequently leads to loss of human lives. Despite decreasing overall
landslides and inundations and more than 6 million Italians live or precipitation trends, short and more intense events are expected to
work in areas of elevated risk. One of the main drivers is urban and occur more frequently in the future, putting in particular urbanized
sub-urban expansion into high risk areas despite decreasing demo- areas with high shares of sealed surfaces under threat.
SURFACE SEALING Heavy precipitation in cities is problematic due to the high level of sealed surfaces. Soil sealing
increases run off and reduces the amount of water absorbed by soil. Where there are large amoun-
AND FLOODS ts of impervious ground cover, short duration extreme rainfall events can lead to increased
flooding, even resulting in flash floods.
2010 % of urban population
ENERGY POVERTY AND HEAT-WAVES Population 0%
Energy poverty rates in Italy are higher than the EU average, whereby living in slums
low income households don't always have the means to keep their
homes cool in summer and warm in winter. Under future climate
scenarios this problem may be exacerbated.
% of total population
Urban population
2018
living in areas 4.2%
where elevation is
below 5 metersITALY
HEALTH
OVERVIEW
Italy has the highest heat-related effects on daily mor- endemic agents (such as tick-borne encephalitis, Lyme
tality in the international context (and therefore disease, Mediterranean spotted fever, and West Nile
among the G20), considering both hot temperatures fever), or the arrival of tropical communicable diseases,
and overall summer temperatures. 30.6% of heat-rela- such as dengue, chikungunya, Zika, Crimean-Congo
ted mortality in Italy from 1991 to 2015 can be attribu- fever, or Rift Valley fever and diseases occurring in
ted to human-induced climate change. Furthermore, animals, including, Bluetongue disease and lumpy skin
there is a concrete risk of a re-emergence of previously disease.
HEAT RELATED MORTALITY
The Italian population has increasingly been affected by heat waves,
especially with over 23% of the Italian population currently over 65. Heat-related mortality
% change with respect to 2000-2004
The increase in frequency and intensity of heat waves and population
ageing will significantly impact health in the future.
Guo et al. (2018) use historical daily time series of mean temperature
and all-cause mortality January 1984 and December 2015 and estima- 2018
te the change in heatwave-related excess mortality in the period
2031–2080 compared to 1971–2020 (present day). +25%
In 2018, there was a 25% increase in heat-related deaths in Italy from
a 2000 to 2004 baseline. 30.6% of heat-related mortality in Italy
during 1991 to 2015 can be attributed to human-induced climate
change.
IMPACTS ON LABOUR Impact on total labour
% change with respect to 1986-2005 baseline
Labour is directly affected by changes in environmental conditions.
Warming affects both the number of hours worked (labour supply) and
on the productivity of workers during their working hours (labour
productivity). Both labour supply and productivity are projected to
decrease under future climate change in most parts of the world, and 2050
particularly in tropical regions.
Parts of sub-Saharan Africa, south Asia, and southeast Asia are at
highest risk under future warming scenarios. Future climate change
will reduce global total labour in the low-exposure sectors by 18
percentage points and by24.8 percentage points in the high-exposure
-1.2%
sectors under a 3.0°C warming scenario
Labour is directly affected by changes in environmental conditions
and especially heat stress. In the agriculture, construction, service, and
-3.1%
industrial sectors in Italy, there was a 79.9% decline in potential hours 2080
of labour lost in 2019 compared to a 1990-94 baseline. Total labour
in Italy is expected to decline by 1.2% under a low emissions scenario,
and by 3.1% under a medium emissions scenario.CLIMATE CHANGE AND DENGUE
Dengue has spread throughout the tropical world over the past 60
years and now affects over half the world’s population. Globally, vecto- Dengue suitability
rial capacity for both dengue vectors (A. aegypti and A. albopictus) has % of population at risk
been rising steadily since the 1980s, with nine of the ten highest years
occurring since 2000.
Climatic stressors are one important driver of the current distribution 87.3%
and incidence of dengue. Climate change is likely to expand the 2050
geographical distribution and suitability of several vector-borne
human infectious diseases including dengue. The risk of dengue 86.2%
transmission is increased by warming climates, as the growth and
development of mosquitoes are significantly influenced by temperatu-
re, precipitation, and humidity.
CLIMATE CHANGE AND ZIKA
Zika virus has spread to at least 49 countries and territories since 2013.
Climate change impacts on transmission suitability risk have increased Zika suitability
over the years and future warming over 1.3 billion additional people % of population at risk
could face suitable transmission temperatures for Zika by 2050.
DENGUE AND ZIKA: POPULATION AT RISK 86.7%
2050
Italy is currently at low risk of dengue and Zika transmissions. However,
these risks will increase due to future climate change.
79.3%
Under a medium emissions scenario, 86.2% of the population will be
at risk of transmission suitable mean temperature for dengue by 2050,
whereas 87.3% will be at risk under a high emissions scenario.
In the case of Zika, 79.3% of the population will be at risk by 2050 with
medium emissions, whereas 86.7% will be at risk under high
emissions.
CLIMATE CHANGE AND MALARIA
Although Italy has essentially been free of malaria transmission since
the 1970s, malaria transmission stability has been rising due to clima- Malaria suitability
tic changes favouring vectors. % of population at risk
More than one-fifth of the Italian population will be at risk of malaria
due to future warming. 20.8% of the Italian population will be at risk 21.8%
of malaria in a low emissions scenario in 2050, whereas 21.8% will be 2050
at risk under a high emissions scenario.
20.8%
POLLUTION AND PREMATURE MORTALITY
Short and long term exposure to air pollution can have direct and
sometimes severe consequences on health. Although regulations have
helped improve outdoor air quality significantly, premature deaths due
to exposure to near-surface ozone and heat are likely to increase.
Under the medium emissions scenario, annual premature deaths due
to long-term exposure to near-surface ozone and heat will increase
from 8,349 (2010) baseline to 10,282 in 2050.ITALY
ENERGY
ENERGY SYSTEM IN A NUTSHELL ENERGY SUPPLY
Italy has seen a substantial downsizing of its ener- Italy's energy mix of total primary energy supply shows a prevalence
gy-intensive industries over the past 40 years, vis-a-vis of oil and gas (respectively, 34% and 42% in 2018), the virtual disap-
pearance of coal (4%), and a still minor, but fast-growing share of
an increasing relevance of the service sector. renewables (17%, including hydro and biofuels). There is no nuclear
energy in the country. Fossil fuels are imported from a diversified
Italy has a long-standing tradition of energy efficiency portfolio of sources, as national production is negligible.
policies, which has brought it to have one of the lowest
energy intensities of GDP in the world.
0.06 85%
ktoe/US$
Energy intensity Import
7.9% dependence ratio
AC Share in
electricity consumption
CLIMATE CHANGE TODAY
ENERGY
The Italian energy sector has so far shown a
high level of resilience to climate related
threats due to the international diversifica-
tion of its supply sources and the
reliability of its electricity transmission
and distribution grid and international
interconnectors.
AIR CONDITIONING
In more recent years, increasing summer
peak demand for air conditioning has caused
stress to the energy system at the local
level, resulting in short, localized blackouts.
HYDROPOWER
Spring and summer droughts have already ENERGY DEMAND
resulted in repeatedly low levels of water Energy in Italy is mainly used for transport (31% in 2018, mostly on
in hydropower dams, raising concerns about road), residential (27%) and tertiary (14)% sectors. Industry claims a
the ability of the system to satisfy demand. 26.5% share (including 6% of total demand for non-energy uses),
The issue was tackled by increasing imports, while agriculture and fishing combined only amount to a 2.6% share.
but also resulted in higher electricity prices. Air conditioning contributes 7.9% of residential electricity demand.FUTURE ENERGY DEMAND
Italy has a very varied climate, ranging from cold Alpine valleys to hot
southern regions. Overall, the decrease in heating demand is going to
be more than compensated by the increase in cooling needs by 60 PJ
Net change in 2050
+ 16.69
(16,7 billion Kwh) under a medium emissions scenario. energy demand due to
changes in DD/CDD
Billion KWh
COOLING NEEDS COOLING DEGREE DAYS 0 400
Marked increases in cooling degree days
all over Italy, bar at the highest elevations
in the Alps, whereas the Apennines are
less likely to escape from the increase in
cooling needs. Stronger increases are
expected in the densely populated Po
valley, Tuscany, Lazio, Campania (hence in
Florence, Rome and Naples) and in
general along the coasts.
HEATING NEEDS HEATING DEGREE DAYS -831 0
Heating needs are expected to decrease
all over Italy, particularly in traditionally
colder regions, where the territory is
partially mountainous, such as all
northern regions and to a lesser extent,
central Italy. Moderate decreases
expected in southern Italy.
FUTURE
ENERGY SUPPLY
The future configuration of the Italian energy mix is likely to be deter-
mined by the evolution of climate mitigation policies and hence is EXPECTED IMPACTS
outside the scope of this report. The EU net-zero carbon target by
2050 is likely to result in a marginal relevance of fossil fuels and their
OF CLIMATE CHANGE
vulnerabilities to climate change, while carbon free sources The current trend of rising summer temperatures, with rising
(renewables and imported electricity) and their vulnerabilities will chances of heatwaves and droughts, is expected to intensify, leading
prevail. to peak electricity demand coinciding with low water availability for
power generation and heat stress on the grid, particularly in central
and southern Italy, and in northern cities, due to the heat island
-3.30% effect. Hydropower generation is expected to decrease moderately
Change in 2050
on average.
Hydropower generation -3.73%
% of changeITALY
ECONOMY
OVERVIEW
Italy ranks 8th in GDP among G20 economies. It has
been one of the EU economies most severely hit by the
COVID crisis, experiencing a decline larger than 9% of 1.7/3.7%
GDP in 2020. 2050
0.02/2.2%
IMPACTS ON GDP
Italy, located in the Mediterranean hot spot for temperature, is particu-
larly vulnerable to changing climate conditions. GDP losses related to GDP Loss
climate change impacts can be significant already by mid century % change w.r.t baseline
under a low emissions scenario, peaking at 2.2% of GDP or 36 billion
EUR.
3.5/8.5%
Losses could reach 116 billion EUR (more than 8% of GDP) by the end 2100
of century in a high emissions scenario.
0.05/3.2%
SECTORAL ECONOMIC IMPACTS
IMPACTS ON INDUSTRY AND INFRASTRUCTURE
Italy features the 5th longest coastline in the EU and the 14th in the The direct costs of climate change for Italian agriculture may be
world. Damage to coastal area infrastructure from sea-level rise can relevant. Yield losses, affecting among others high value-added
be particularly severe. cultivars, can determine a production contraction quantifiable in an
aggregate cost of 12.5 billion EUR (0.7% of GDP) for a temperature
In part due to the country particular oro-geography, today 91% of increase of 2°C, to 30 billion EUR (1.9% of GDP) for a temperature
Italian municipalities are prone to hydro-geological risk; hence the increase of 4°C.
projected increase in frequency and intensity of riverine floods under
climate change is particularly worrisome. Due to its high-quality cultivars, Italy is also characterized by one of
the highest average farmland values in the EU. Climate-change howe-
ver can reduce the suitability of soils to grow high quality varieties
IMPACTS ON AGRICULTURE leading to a dramatic decline in farmland values.
As is typical of developed economies, the overall contribution of the
Italian agricultural sector to national GDP is rather limited: 1.9% in Estimates range from a loss of 1–11% of aggregate farmland values
2019. under a medium emissions scenario, and a loss of 4-16% under a high
emissions scenario by the end of century. Other studies report more
Nonetheless the high quality of Italian production offers a fundamen- pessimistic estimates of a 10% loss in farmland value per degree of
tal direct and indirect contribution to national exports. For instance, in temperature increase.
2020 the agri-food sector export volume totaled 46,1 billion EUR.
Wine product exports alone reached a value of 6,2 billion EUR.1.4/81
2050
SEA LEVEL RISE DAMAGES
1/49
Assuming that no new investments in coastal protection are underta-
ken, the expected annual damages on assets under a high emissions Sea Level Rise
Expected annual damages
scenario may peak at 81 billion EUR already in 2050.
Billion Euro
By 2100 annual damage can range between 18.4 and 213 billion EUR 18.4/213
depending on different assumptions on adaptation. 2100
10.4/111
1.9/4
2050
RIVER FLOODING DAMAGES
Increase in frequency and intensity of extreme weather events can
generate relevant economic losses associated with riverine floods.
Riverine 3.2/3.27
9.6 billion EUR in expected annual damage to infrastructure assets
could be experienced under a high emissions scenario in the second
Flooding
Expected annual damages
half of this century. Billion Euro
4.3/9.6
2100
2.9/5.3
IMPACTS ON ENERGY IMPACTS ON FORESTRY AND FISHERY
Economic impacts of shifts in household and firm energy demand (see The fishing sector may experience a reduction in catches with a direct
the "Energy" chapter) are difficult to predict and will mostly lead to production loss in 2070 ranging between 191 and 323 million EUR
redistribution effects. under low emissions and high emissions scenarios, respectively.
Being a temperate to warm country, Italy will see a decline in energy IMPACTS ON TOURISM
consumption for warming and an increase for cooling. Residential
electricity demand is for instance expected to increase between 5 and Tourism in Italy is one of the most important tertiary sectors. In 2019,
10% in 2070 under a high emissions scenario. The net effect on it contributed the 10.4% of national GDP. It can be also one of the
household bills is however difficult to estimate. sectors most severely impacted by climate change.
The loss of climatic attractiveness and amenity of Italian destinations,
becoming too hot, or loosing snow during the winter season, can
induce a loss of up to 17 and 52 billion EUR due to touristic demand
reduction under a low and high emissions scenario, respectively.ITALY
POLICY
OVERVIEW INTERNATIONAL COMMITMENTS
Italy is responsible for 0.87% of global GHG emissions Italy has the same target as the EU. In its 2020 NDC update, it
and has a 20% higher than world average rate of CO2 strengthened its emissions target to a 55% reduction below 1990
emissions per capita. Emissions have been declining levels by 2030.
since 2007, and a net zero emissions by 2050 target
has been set. CLIMATE POLICY
COMMITMENTS CHRONOLOGY
515 377
MtCO2eq MtCO2eq 2002 KYOTO PROTOCOL - 1ST PERIOD
6.5 % yearly average reduction in GHG over the
four year period 2008-2012, with respect to
1990 levels
2016 PARIS AGREEMENT - 1ST NDC
40% in GHG reduction by 2030, with respect to
1990 levels
2020 PARIS AGREEMENT - NDC UPDATE
55% GHG reduction by 2030, with respect to
1990 GHG EMISSIONS 2019 1990 levels
INTERNATIONAL CLIMATE Italy’s 4th Biennial Report shows a total commitment of 1.2 billion USD for climate action in
2017-2018. This is mainly provided in the form of grants. The majority is directed to multilate-
FINANCE ASSISTANCE ral institutions, while bilateral support mainly addresses sub-Saharan Africa.SUSTAINABLE RECOVERY POLICY ADAPTATION POLICY HIGHLIGHTS
According to the Global Recovery Observatory, in 2020 the proportion TRANSNATIONAL INITIATIVES
of green spending out of total recovery spending was 7%.
Regional Climate Change Adaptation Framework for
Others: 4.387 Billion USD the Mediterranean Marine and Coastal Areas
The aim of the Framework is to set a cross-border approach to increa-
se the resilience of the Mediterranean marine and coastal systems,
assisting decision-makers in the implementation of policies
Alpine Climate Action Plan 2.0
The plan is part of the Alpine Climate Target System 2050 strategy
693.39 12.09 0.81 that supports progress towards reaching climate-neutral and clima-
billion $ billion $ billion $ te-resilience in the Alps by 2050
Total Spending Recovery Spending Green Spending
NATIONAL INITIATIVES
Creiamo PA
DOMESTIC ADAPTATION POLICY The Ministry of Ecological Transition set up a technical assistance
programme to support Italian local administrations in developing
In 2015 the Ministry for the Ecological Transition adopted the National their own climate mitigation and adaptation plans
Adaptation Strategy to climate change, and in 2016 it started the
elaboration of the National Adaptation Plan. Some regions (Emilia Experimental programme of actions for adaptation
Romagna, Lombardy and Sardinia) approved their adaptation strategy. to climate change in urban areas
Other regions have started procedures aiming to define planning The program aims at increasing the resilience in municipalities with a
documents on adaptation. population of 60,000 inhabitants or more which are subject to climate
change risks (heat waves, extreme rainfall and drought)
Inclusion of Adaptation in NDCs
Integrated Adaptation & Mitigation Policy SUBNATIONAL INITIATIVES
Domestic
Adaptation Policy Un filo Naturale
Dedicated Adaptation Strategy
The City of Brescia is developing a “Climate Transition Plan” that will
Dedicated Adaptation Plan abate greenhouse gases emissions and mitigate the impacts of urban
flash floods and urban heat islands
Sectoral Adaptation Plans Sardinian Regional Adaptation Strategy
Subordinate The SRACC aims to assess the climate vulnerability and risk on the
Adaptation Policies Subnational Adaptation Plans island of Sardinia, to identify adaptation options, and to define a
governance system for the inclusion of adaption in all regional
Policy not in place Active policy
programs
ENERGY TRANSITION Energy Transition Fossil Fuels
Italy has undertaken a significant process of transformation of its energy sector and
is among the best performers in Efficiency, driven by the low level of energy intensity 58.7 45.3
of the economy and by the advanced digitalization of the electric grid, which had a
positive benefit in terms of transmission and distribution losses. During the last 52.3
64.6
decade, many investments have been made in Renewables increasing their funda-
mental role and also allowing Italy to substitute fossil fuels which are mostly impor-
ted. The good performance in terms of the overall Energy Transition indicator is also Renewables Efficiency
driven by significant improvements in Emissions. In order to further speed up the
transition, Electrification opportunities, especially in buildings and in transport
19.7 84.9
sectors, must be seized.
26.2 93.2
Only actively pursuing an energy transition based on decarbonization and Electrification Emissions
electrification – from policy and regulation, to health and education – will
enable countries to benefit the most from future opportunities and fight
G20 72.9
AVERAGE climate change whilst ensuring an equitable distribution of wealth. 70.8 72.9
COUNTRY
The Energy Transition indicators were developed by Enel Foundation in
cooperation with SACE, and provide a retrospective analysis based on 71.3 79.8
historical data.You can also read