Indirect contributions of global fires to surface ozone through ozone-vegetation feedback
←
→
Page content transcription
If your browser does not render page correctly, please read the page content below
Atmos. Chem. Phys., 21, 11531–11543, 2021
https://doi.org/10.5194/acp-21-11531-2021
© Author(s) 2021. This work is distributed under
the Creative Commons Attribution 4.0 License.

Indirect contributions of global fires to surface ozone through
ozone–vegetation feedback
Yadong Lei1,2 , Xu Yue3 , Hong Liao3 , Lin Zhang4 , Yang Yang3 , Hao Zhou1,2 , Chenguang Tian1,2 , Cheng Gong2,5 ,
Yimian Ma1,2 , Lan Gao1,2 , and Yang Cao1,2
1 Climate  Change Research Center, Institute of Atmospheric Physics, Chinese Academy of Sciences, Beijing, 100029, China
2 University of Chinese Academy of Sciences, Beijing, 100029, China
3 Jiangsu Key Laboratory of Atmospheric Environment Monitoring and Pollution Control, Jiangsu Collaborative Innovation

Center of Atmospheric Environment and Equipment Technology, School of Environmental Science and Engineering,
Nanjing University of Information Science and Technology (NUIST), Nanjing, 210044, China
4 Laboratory for Climate and Ocean–Atmosphere Studies, Department of Atmospheric and Oceanic Sciences,

School of Physics, Peking University, Beijing, 100871, China
5 State Key Laboratory of Atmospheric Boundary Layer Physics and Atmospheric Chemistry (LAPC),

Institute of Atmospheric Physics, Chinese Academy of Sciences, Beijing, 100029, China

Correspondence: Xu Yue (yuexu@nuist.edu.cn)

Received: 12 December 2020 – Discussion started: 13 January 2021
Revised: 2 July 2021 – Accepted: 2 July 2021 – Published: 3 August 2021

Abstract. Fire is an important source of ozone (O3 ) pre-         hancement will cause additional threats to public health and
cursors. The formation of surface O3 can cause damage             ecosystem productivity.
to vegetation and reduce stomatal conductance. Such pro-
cesses can feed back to inhibit dry deposition and indi-
rectly enhance surface O3 . Here, we apply a fully coupled
chemistry–vegetation model to estimate the indirect contri-       1   Introduction
butions of global fires to surface O3 through O3 –vegetation
feedback during 2005–2012. Fire emissions directly increase       Tropospheric ozone (O3 ) is a toxic air pollutant with detri-
the global annual mean O3 by 1.2 ppbv (5.0 %) with a max-         mental effects on vegetation (Yue and Unger, 2014; Juráň
imum of 5.9 ppbv (24.4 %) averaged over central Africa            et al., 2021). Plant stomatal uptake of O3 decreases both
by emitting a substantial number of precursors. Consider-         chlorophyll and Rubisco contents and increases the defor-
ing O3 –vegetation feedback, fires additionally increase sur-     mity rate of chloroplasts (Booker et al., 2007; Akhtar et al.,
face O3 by 0.5 ppbv averaged over the Amazon in Octo-             2010; Inada et al., 2012), which further reduces the leaf area
ber, 0.3 ppbv averaged over southern Asia in April, and           index (LAI) and gross primary productivity (GPP) of ecosys-
0.2 ppbv averaged over central Africa in April. During ex-        tems (Karnosky et al., 2007; Ainsworth et al., 2012). Mod-
treme O3 –vegetation interactions, such a feedback can rise       eling studies estimated that O3 damage reduces global GPP
to > 0.6 ppbv in these fire-prone areas. Moreover, large ra-      by 1.5 %–3.6 % with regional maximum reductions of 8 %–
tios of indirect-to-direct fire O3 are found in eastern China     20 % over eastern US, western Europe, and eastern China
(3.7 %) and the eastern US (2.0 %), where the high ambi-          (Yue and Unger, 2014; Lei et al., 2020; Zhu et al., 2021).
ent O3 causes strong O3 –vegetation interactions. With the        In turn, vegetation damage also influences both the sources
likelihood of increasing fire risks in a warming climate, fires   and sinks of O3 through biogeochemical and biogeophysi-
may promote surface O3 through both direct emissions and          cal feedbacks (Curci et al., 2009; Heald and Geddes, 2016;
indirect chemistry–vegetation feedbacks. Such indirect en-        Fitzky et al., 2019). The damaged vegetation decreases iso-
                                                                  prene emissions and stomatal conductance (Wittig et al.,
                                                                  2009; Feng et al., 2019), which influence O3 production and

Published by Copernicus Publications on behalf of the European Geosciences Union.
11532                                                      Y. Lei et al.: Indirect contributions of global fires to surface ozone

dry deposition. Moreover, weakened leaf-level transpiration         actions are expected because of high fire O3 concentrations
following O3 damage modulates meteorological parameters,            and dense vegetation cover. Previous studies showed that fire
such as surface air temperature and atmospheric relative hu-        O3 causes a large GPP reduction of 200–400 Tg C yr−1 over
midity, leading to substantial biogeophysical feedbacks on          the Amazon and central Africa (Pacifico et al., 2015; Yue
surface O3 (Lombardozzi et al., 2012; Sadiq et al., 2017).          and Unger, 2018). With likely increased wildfire activity due
   Interactions between air pollution and terrestrial ecosys-       to global warming, surface O3 will be further enhanced by
tems remain challenging due to limited process-based knowl-         wildfires (Amiro et al., 2009; Balshi et al., 2009; Wang et al.,
edge and the separate development of chemistry and vegeta-          2016; Yue et al., 2017), leading to more severe O3 damage
tion models (He et al., 2020). At present, the feedbacks from       on vegetation. Although the feedback of vegetation damage
O3 -damaging vegetation on O3 have only been examined by            on surface O3 has been comprehensively explored on global
four papers (Sadiq et al., 2017; Zhou et al., 2018; Gong et al.,    (Sadiq et al., 2017; Zhou et al., 2018; Gong et al., 2020)
2020; Zhu et al., 2021). Sadiq et al. (2017) implemented            and regional (Zhu et al., 2021) scales, these studies all fo-
a parameterization of O3 vegetation damage into a climate           cused on O3 –vegetation interactions from combined anthro-
model and quantified online O3 –vegetation coupling. Simu-          pogenic and natural sources. Therefore, quantification of the
lations showed that surface O3 could be enhanced by up to 4–        O3 –vegetation interactions associated with fire emissions is
6 ppbv over Europe, North America, and China through com-           very important for a comprehensive understanding of the ef-
parable effects from biogeochemical (decreased dry deposi-          fects of fires on surface O3 .
tion and increased isoprene emissions) and biogeophysical              Here, we apply a fully coupled chemistry–vegetation
(changes in meteorological variables following reduced tran-        model (GEOS-Chem-Yale Interactive terrestrial Biosphere –
spiration rate) feedbacks from O3 –vegetation interactions.         hereafter referred to as GC-YIBs) to examine the indirect
Similar conclusions were drawn by Zhu et al. (2021), who            contributions of fires to surface O3 . Fire-induced O3 affects
investigated the effects of O3 –vegetation interaction in China     plant photosynthesis and stomatal conductance. In turn, pre-
using a two-way coupled land–atmosphere model. By in-               dicted changes in LAI and canopy stomatal conductance in-
cluding O3 damage to isoprene emissions in a fully coupled          fluence both the sources and sinks of tropospheric O3 . Such
global chemistry–carbon–climate model, Gong et al. (2020)           O3 –vegetation interactions result in the additional enhance-
highlighted that such O3 –vegetation positive feedbacks were        ment of surface O3 caused by fire emissions (Fig. 1). Sec-
mainly driven by reduced dry deposition following O3 dam-           tion 2 describes the GC-YIBs model and sensitivity experi-
age to photosynthesis. Different from the three studies above,      ments conducted in this study. Section 3 quantifies the feed-
Zhou et al. (2018) implemented steady-state O3 -induced             backs of fire-induced O3 vegetation damage on surface O3
LAI changes into the GEOS-Chem model and quantified                 concentrations. The last section summarizes the findings and
only the influences of O3 –vegetation biogeochemical feed-          discusses the uncertainties.
backs because the model is driven with prescribed meteo-
rological fields. Results showed that O3 -induced damage to
LAI can enhance O3 by up to 3 ppbv in the tropics, east-            2     Materials and methods
ern North America, and southern China through changes
in dry deposition and isoprene emissions. All studies re-           2.1    The GC-YIBs model
vealed a strong positive O3 –vegetation feedback to surface
O3 , though the magnitudes are different due to discrepancies       GC-YIBs is a coupled chemistry–vegetation model devel-
in O3 -damaging schemes, as well as differences in the mod-         oped by implementing the Yale Interactive terrestrial Bio-
els.                                                                sphere (YIBs) model into GEOS-Chem version 12.0.0 (Lei
   Fire plays an important role in disturbing the terrestrial       et al., 2020). GEOS-Chem is a widely used global 3-D chem-
carbon budget (Bond-Lamberty et al., 2007; Amiro et al.,            ical transport model (CTM) for simulating atmospheric com-
2009; Turetsky et al., 2011; Yue and Unger, 2018). Global           position and air quality (Yue et al., 2015; Yan et al., 2018;
fires directly emit 2–3 Pg (1 Pg = 1015 g) carbon into the at-      David et al., 2019; Lu et al., 2019). This model uses a de-
mosphere every year (van der Werf et al., 2010). Moreover,          tailed HOx −NOx −VOC−O3 –halogen–aerosol tropospheric
fires contribute to the production of tropospheric O3 by emit-      chemistry to simulate tropospheric O3 fluxes (Barret et al.,
ting a substantial number of precursors (Cheng et al., 1998;        2016; Gong and Liao, 2019), while a simplified linearized
Kita et al., 2000; Oltmans et al., 2010; Jaffe et al., 2013; Lu     Linoz chemistry mechanism is applied to simulate strato-
et al., 2016). Globally, fires account for 3 %–5 % of the total     spheric O3 (McLinden et al., 2000). Aerosols simulated
tropospheric O3 (Bey et al., 2001; Ziemke et al., 2009; Jaffe       in GEOS-Chem include secondary inorganic aerosols, sec-
and Wigder, 2012). Regionally, especially in the Amazon and         ondary organic aerosols, primary organic aerosols, black car-
central Africa, fires can enhance surface O3 by 10–30 ppbv          bon, dust, and sea salt (Dang and Liao, 2019; Li et al.,
through emissions of NOx and volatile organic compounds             2019). The gas–aerosol partitioning of the sulfate–nitrate–
(VOCs) during fire seasons (Yue and Unger, 2018; Pope               ammonium system is computed by the ISORROPIA v2.0
et al., 2020). Over these regions, strong O3 –vegetation inter-     thermodynamic equilibrium model (Fountoukis and Nenes,

Atmos. Chem. Phys., 21, 11531–11543, 2021                                           https://doi.org/10.5194/acp-21-11531-2021
Y. Lei et al.: Indirect contributions of global fires to surface ozone                                                          11533

Figure 1. Diagram of the impacts of fires on surface O3 through direct emissions and O3 –vegetation feedback.

2007). The atmospheric emissions from different sources,               sis and canopy stomatal conductance; in turn, the online-
regions, and species on a user-defined grid are calculated             simulated vegetation parameters, such as LAI and stomatal
through the online Harvard–NASA Emissions Component                    conductance, in YIBs affect both the sources and sinks of
(HEMCO) module (Keller et al., 2014). HEMCO is highly                  O3 by altering precursor emissions and dry deposition at
customizable in that it can automatically combinate, overlay,          the 1 h integration time step. An earlier study evaluated the
and update emission inventories and scale factors specified            GC-YIBs model and showed good performance in simulat-
by the users. In general, the GEOS-Chem model overesti-                ing surface O3 , GPP, LAI, and O3 dry deposition (Lei et al.,
mates summer surface O3 concentrations in the eastern US               2020).
and China (Zhang et al., 2011; Travis et al., 2016; Schiferl
and Heald, 2018).                                                      2.2   Scheme of O3 vegetation damage
   YIBs is a vegetation model designed to dynamically sim-
ulate the changes in LAI and tree height based on carbon               The GC-YIBs model calculates the impacts of O3 expo-
assimilation, respiration, and allocation processes (Yue and           sure on photosynthesis based on a semi-mechanistic scheme
Unger, 2015). The model computes carbon uptake for nine                (Sitch et al., 2007):
vegetation types, including evergreen needleleaf forest, de-           A0 = α · A,                                                 (1)
ciduous broadleaf forest, evergreen broadleaf forest, shrub-
land, tundra, C3 /C4 grasses, and C3 /C4 crops. The canopy             where A0 and A represent the O3 -damaging and original leaf
is divided into an adaptive number of layers (typically 2–             photosynthesis, respectively. The O3 damage factor is repre-
16) for light stratification. The YIBs model applies a well-           sented by α; O3 can cause damage to photosynthesis only if
established Michaelis–Menten enzyme kinetics scheme to                 α < 1. The factor α is calculated as a function of excessive
compute the leaf photosynthesis (Farquhar et al., 1980; Von            O3 flux and damaging sensitivity coefficient (β):
Caemmerer and Farquhar, 1981), which is further upscaled to
the canopy level by the separation of sunlit and shaded leaves         α = −β · max FO3 − TO3 , 0 .                             (2)
(Spitters, 1986). The LAI and carbon allocation schemes are
from the TRIFFID model (Clark et al., 2011). Previous stud-            The coefficient β can have two values for each vegetation
ies have shown that the YIBs model has good performance                type (Table S1 in the Supplement), indicating low to high
in simulating the spatial pattern of and temporal variability in       O3 -damaging sensitivities (Sitch et al., 2007). TO3 represents
GPP and LAI based on site observations and satellite prod-             the O3 flux threshold, reflecting the O3 tolerance of differ-
ucts (Yue and Unger, 2015, 2018).                                      ent vegetation types. FO3 represents the stomatal O3 flux and
   The GC-YIBs model links atmospheric chemistry and                   is calculated based on ambient [O3 ], aerodynamic resistance
vegetation in a two-way coupling. As a result, changes in              (ra ), boundary layer resistance (rb ), and stomatal resistance
chemical components or vegetation will simultaneously feed             (rs ):
back to influence the other systems. In this study, the GC-                         [O3 ]
YIBs model is driven with the meteorological fields from the           FO3 =                     .                                 (3)
                                                                               ra + rb + k · rs0
Modern-Era Retrospective analysis for Research and Appli-
cations, version 2 (MERRA2) with a horizontal resolution               Here k represents the ratio of leaf resistance of O3 to leaf re-
of 4◦ latitude by 5◦ longitude, as well as 47 vertical layers          sistance of water vapor. Parameters ra and rb are calculated
from the surface to 0.01 hPa. Within GC-YIBs, the online-              by the GEOS-Chem model. O3 -damaging leaf photosynthe-
simulated surface O3 in GEOS-Chem affects photosynthe-                 sis (A0 ) is then integrated over all canopy layers to generate

https://doi.org/10.5194/acp-21-11531-2021                                              Atmos. Chem. Phys., 21, 11531–11543, 2021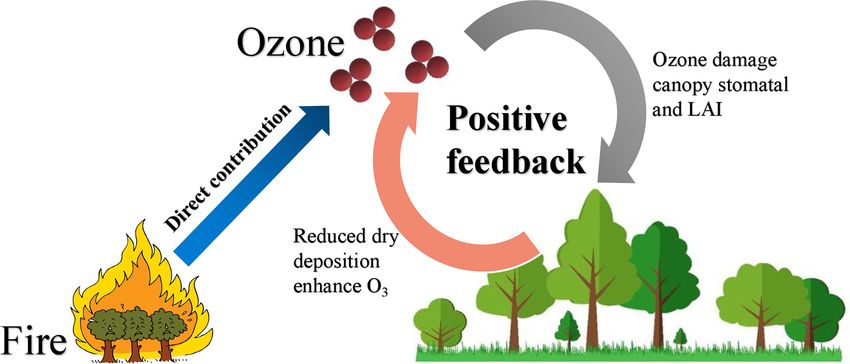
11534                                                     Y. Lei et al.: Indirect contributions of global fires to surface ozone

O3 -damaging GPP:                                                  [O3 ] at the Manaus (Brazil), Tanjung Malim (Malaysia),
                                                                   and Welgegund (South Africa) sites are from earlier studies
         Z       LAI
                                                                   (Ahamad et al., 2014; Laban et al., 2018; Pope et al., 2020).
GPP0 =                 A0 dL.                              (4)
             0
                                                                   2.5    Model simulations
The O3 -damaging stomatal resistance (rs0 ) is calculated based
on the model of Ball and Berry (Baldocchi et al., 1987):           In this study, eight simulations (Table 1) are performed to
                                                                   examine both the direct and indirect contributions of fires to
1           A0 · RH                                                surface O3 . These simulations can be divided into two main
   = gs0 = m net    + b,                                   (5)
 0
rs             cs                                                  groups:

where m and b represent the slope and intercept of empiri-             1. CTRL_FIRE and CTRL_NOFIRE are the control runs
cal fitting to the Ball–Berry stomatal conductance equation,              using the same emissions except that the latter omits fire
respectively. A0net represents O3 -damaging net leaf photosyn-            emissions. These runs calculate and output offline O3
thesis, RH represents the relative humidity, and cs is the am-            damage, which decreases instantaneous leaf photosyn-
bient CO2 concentration. Previous studies have shown that                 thesis but does not feed back to affect plant growth and
this scheme within the framework of YIBs can reasonably                   O3 dry deposition.
capture the response of GPP and stomatal conductance to
                                                                       2. O3CPL_FIRE and O3CPL_NOFIRE are the sensitive
surface [O3 ] based on hundreds of global observations (Yue
                                                                          experiments that consider online coupling between O3
et al., 2016; Yue and Unger, 2018).
                                                                          and vegetation. These runs include online O3 damage
                                                                          to plant photosynthesis, which feeds back to affect both
2.3   Fire emissions
                                                                          vegetation and air pollution. The two simulations ap-
Fire INventory from the National Center for Atmospheric                   ply the same emissions, except that the latter omits fire
Research (FINN) version 1.5 is used by GC-YIBs to simulate                emissions.
fire-induced perturbations in O3 . FINN provides daily global         For each of these four configurations, two runs are con-
emissions of many chemical species from open biomass               ducted with either high (HS) or low (LS) O3 -damaging sen-
burning at a resolution of 1 km2 (Wiedinmyer et al., 2011).        sitivities. All simulations are performed from 2002 to 2012
The inventory estimates fire locations and biomass burned          using the GC-YIBs model driven by MERRA2 meteorologi-
using satellite observations of active fires and land cover,       cal fields. The first 3 years are used as spinup, and the results
together with emission factors and fuel loadings. For each         of the last 8 years are analyzed. For the same configurations,
land type, emission factors for different gaseous and par-         the results from low and high O3 -damaging sensitivities
ticulate species are taken from measurements (Andreae and          are averaged. The differences between CTRL_NOFIRE and
Merlet, 2001; Andreae and Rosenfeld, 2008; Akagi et al.,           O3CPL_NOFIRE represent the surface O3 enhancements
2011). Daily fire emissions for 2002–2012 are available at         through O3 –vegetation feedback without fire emissions.
https://www.acom.ucar.edu/Data/fire/, last access: 1 August        The differences between CTRL_FIRE and CTRL_NOFIRE,
2021). In GC-YIBs, all biomass burning emissions occur in          named O3OFF, represent the direct contributions of fires
the atmospheric boundary layer. Such a configuration might         to surface O3 . The differences between O3CPL_FIRE and
slightly overestimate regional O3 formation as observations        O3CPL_NOFIRE, named O3CPL, represent both direct and
suggested ∼ 20 % of fire plumes reached the height above the       indirect contributions of fires to surface O3 . The differences
boundary layer (Val Martin et al., 2010) and consequently en-      between O3CPL and O3OFF represent the indirect contribu-
hanced the surface O3 level in the downwind regions (Jaffe         tions of fires to surface O3 through O3 –vegetation interac-
and Wigder, 2012). The FINN inventory has been widely              tions. It should be noted that only biogeochemical feedbacks
used in regional and global chemical transport models (e.g.,       from O3 vegetation damage on surface O3 are considered
WRF-Chem and GEOS-Chem) to quantify the impacts of                 in this study because GC-YIBs uses prescribed meteorology
fires on air quality and weather (Jiang et al., 2012; Nuryanto,    (MERRA2).
2015; Vongruang et al., 2017; Brey et al., 2018; Watson et al.,
2019).
                                                                   3     Results
2.4   Site-level measurements
                                                                   3.1    Model validation
Measurements of surface [O3 ] in the US are provided by Air
Quality System (AQS; https://www.epa.gov/aqs, last access:         Simulated surface daily maximum 8 h average O3 concentra-
1 August 2021), and those over Europe are provided by the          tions (MDA8 [O3 ], short for [O3 ] hereafter) are evaluated us-
European Monitoring and Evaluation Programme (EMEP;                ing measurements from the AQS and EMEP datasets over the
https://emep.int, last access: 1 August 2021). The observed        period of 2005–2012 (Fig. 2). The model captures well the

Atmos. Chem. Phys., 21, 11531–11543, 2021                                            https://doi.org/10.5194/acp-21-11531-2021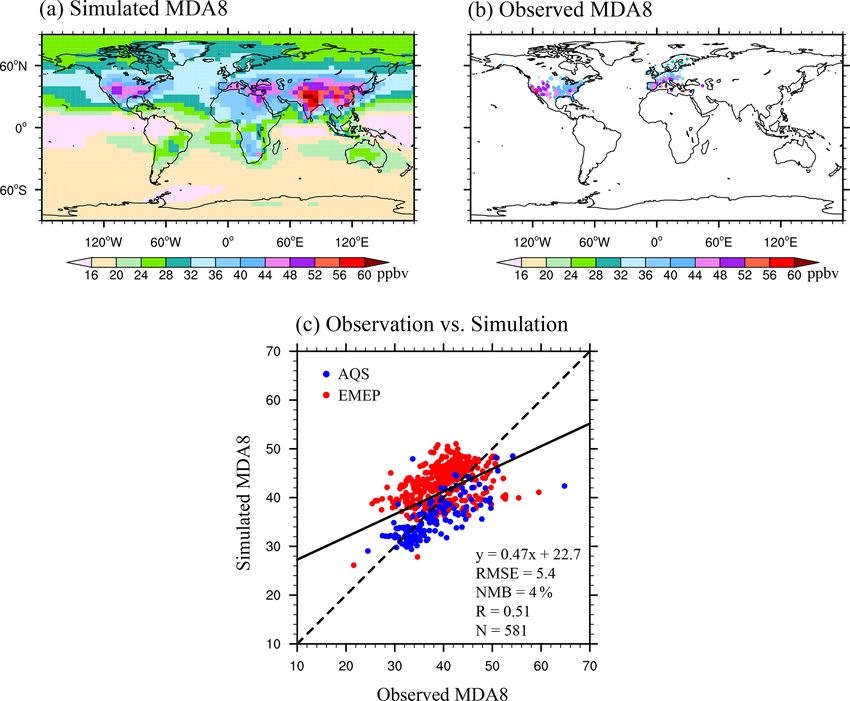
Y. Lei et al.: Indirect contributions of global fires to surface ozone                                                      11535

Table 1. Summary of simulations using the GC-YIBs model.

                           Name                    Emissions               O3 damaging    O3 sensitivities
                           CTRL_FIRE_HS            All including fires     Offline        High
                           CTRL_FIRE_LS            All including fires     Offline        Low
                           CTRL_NOFIRE_HS          All but without fires   Offline        High
                           CTRL_NOFIRE_LS          All but without fires   Offline        Low
                           O3CPL_FIRE_HS           All including fires     Online         High
                           O3CPL_FIRE_LS           All including fires     Online         Low
                           O3CPL_NOFIRE_HS         All but without fires   Online         High
                           O3CPL_NOFIRE_LS         All but without fires   Online         Low

observed spatial distribution of annual [O3 ] in the US and Eu-      3.3   Fire-induced O3 damage to GPP
rope, with a high correlation coefficient of 0.51 (p < 0.01).
Although GC-YIBs overestimates the [O3 ] in the eastern US           Surface O3 causes strong damage to ecosystem productivity
while underestimating it in western Europe, the normalized           (Fig. 4). Without fire emissions, surface O3 reduces global
mean bias (NMB) is only 4.0 %, with a root mean square               annual GPP by 1.7 % (3899.8 Tg C yr−1 ; Fig. 4a and c).
error (RMSE) of 5.4 ppbv. Therefore, the simulated O3 veg-           Regional maximum reductions of 10.9 % (372.0 Tg C yr−1 ),
etation damage in our study is slightly overestimated in the         6.1 % (366.1 Tg C yr−1 ), and 4.9 % (323.8 Tg C yr−1 ) are av-
eastern US but underestimated in western Europe.                     eraged respectively over eastern China, the eastern US, and
                                                                     western Europe; these reductions are attributed to the high
3.2   Direct contributions of fires to O3                            ambient [O3 ] level and the large stomatal conductance over
                                                                     these regions. The patterns of O3 -induced GPP reductions
Without fire emissions, the simulated global mean [O3 ]              agree with previous estimates using the same O3 damage
is 23.9 ppbv, with a grid maximum of 63.7 ppbv over                  schemes (Sitch et al., 2007; Yue and Unger, 2015). How-
the Beijing–Tianjin–Hebei region averaged for 2005–2012              ever, compared to simulations using another scheme (Lom-
(Fig. 3a). Most high [O3 ] is distributed in the Northern            bardozzi et al., 2012; Zhou et al., 2018; Zhu et al., 2021),
Hemisphere, where anthropogenic emissions make the dom-              this study estimates smaller GPP reductions. Such a discrep-
inant contributions. The inclusion of fire emissions increases       ancy indicates that there are large uncertainties in O3 veg-
global annual [O3 ] by an average of 1.2 ppbv (5.0 %).               etation damage schemes, and more observations should be
Regionally, the largest enhancement of [O3 ] by 5.9 ppbv             developed to evaluate different schemes in future studies.
(24.4 %) is averaged over central Africa, with smaller en-              The inclusion of fire emissions causes additional GPP re-
hancements of 5.7 ppbv (38.2 %) averaged over the Ama-               ductions. Globally, fire-induced 1O3 decreases annual GPP
zon and 3.8 ppbv (10.2 %) averaged over southern Asia.               by 0.4 % (1312.0 Tg C yr−1 ; Fig. 4b and d). Regionally, the
Smaller enhancements of 1.1 ppbv (2.2 %), 0.9 ppbv (2.1 %),          largest GPP reduction of 1.4 % (370.3 Tg C yr−1 ) is aver-
and 0.8 ppbv (2.2 %) are averaged respectively over eastern          aged over the Amazon due to the largest enhancement of
China, western Europe, and the eastern US (Fig. 3b). The             [O3 ] caused by fires. Furthermore, fire 1[O3 ] causes addi-
predicted fire-induced enhancements in [O3 ] agree well with         tional annual GPP reductions of 1.3 % (358.0 Tg C yr−1 ), av-
the simulations using the same model but with fire emissions         eraged over central Africa, and 1.0 % (77.1 Tg C yr−1 ), aver-
from the Global Fire Emissions Database (GFED) version 3             aged over southern Asia. In contrast, limited damage is found
(Yue and Unger, 2018).                                               in eastern China, western Europe, and the eastern US due to
   We further evaluated the model performance in simulat-            low fire 1[O3 ]. Following the changes in GPP, fire-induced
ing fire-induced 1[O3 ] at three sites across biomass burning        O3 damage to LAI shows a regional maximum of 0.3 %–
regions (Fig. S1 in the Supplement). Without fire emissions,         0.7 % in central Africa and a global reduction of 0.02 %–
the [O3 ] is obviously underestimated with NMBs of −25.5 %           0.5 % (Fig. S2).
at Tanjung Malim, −53.6 % at Manaus, and −21.3 % at Wel-
gegund. As a comparison, simulations with fire emissions             3.4   Indirect contributions of fires to O3
show NMBs in fire seasons of −8.7 % at Tanjung Malim,
−1.4 % at Manaus, and −15.1 % at Welgegund, suggesting               Vegetation parameters such as LAI and stomatal conductance
that O3 simulations were improved by including fire emis-            play important roles in modulating surface [O3 ]. The O3 -
sions.                                                               induced changes in these variables interactively feed back to
                                                                     alter local [O3 ] (Fig. 5). Without fire emissions, the annual
                                                                     1[O3 ] from O3 –vegetation interactions is limited in eastern
                                                                     China by 0.5 ppbv, the eastern US by 0.3 ppbv, and western

https://doi.org/10.5194/acp-21-11531-2021                                            Atmos. Chem. Phys., 21, 11531–11543, 2021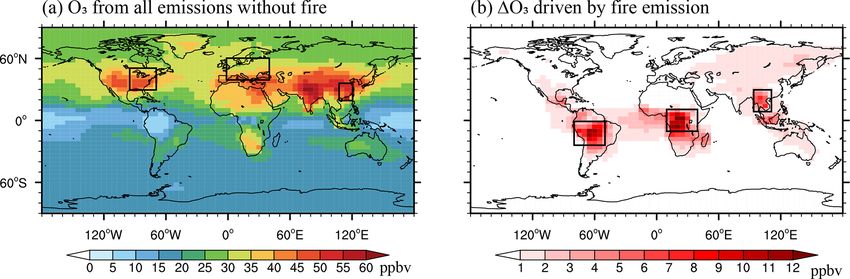
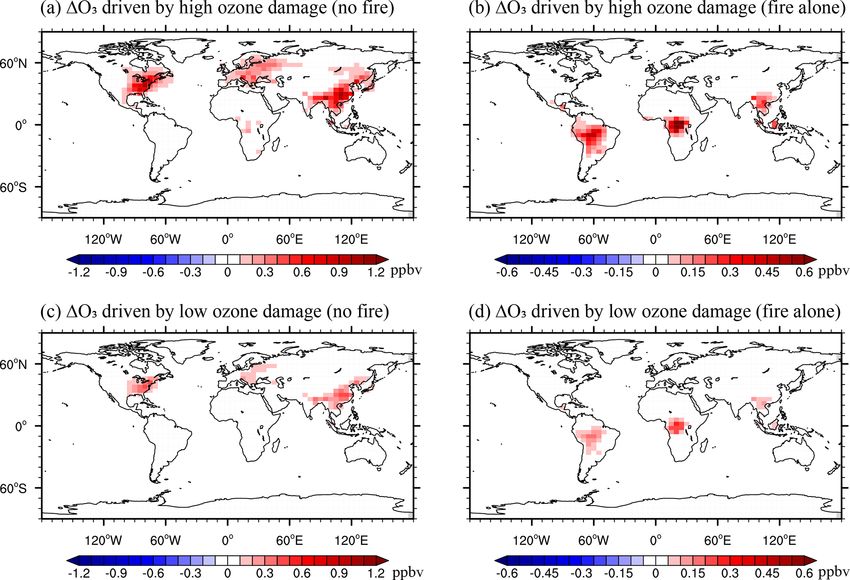
11536                                                          Y. Lei et al.: Indirect contributions of global fires to surface ozone

Figure 2. Spatial pattern of (a) simulated and (b) observed surface [O3 ]. (c) Scatter plot of surface [O3 ] over measurements in two regions.
The black line shows the linear regression between the observed and simulated [O3 ]. The regression fit, correlation coefficient (R), root
mean square error (RMSE), and normalized mean bias (NMB) are shown in the bottom panel with an indication of site numbers (N ) used
for statistics.

Figure 3. Annual surface [O3 ] from (a) non-fire sources and (b) fire sources alone. The six subregions are marked with black boxes: eastern
US (EUS; 30–50◦ N, 95–70◦ W), western Europe (WEU; 40–60◦ N, 0–40◦ E), eastern China (ECH; 20–35◦ N, 108–120◦ E), Amazon (AMZ;
25◦ S–0◦ , 80–50◦ W), central Africa (CAF; 10◦ S–10◦ N, 10–40◦ E), and southern Asia (SAS; 10–30◦ N, 95–110◦ E).

Europe by 0.2 ppbv. The largest grid positive feedback of up             the feedback of LAI changes is generally small (Fig. S3b),
to 0.8 ppbv is found in the eastern US (Fig. 5a and c). Sen-             which is mainly attributed to limited O3 damage to LAI
sitivity experiments further show that such an enhancement               (Fig. S2). The enhancement of [O3 ] from fires causes addi-
of surface [O3 ] mainly results from the inhibition of stom-             tional feedback to the surface [O3 ]. The largest annual 1[O3 ]
atal conductance following reduced photosynthesis because                of 0.13 ppbv due to O3 –vegetation feedback is averaged over
of O3 damage (Fig. S3a). Consequently, large 1[O3 ] values               the Amazon (Fig. 5b and d), where the highest GPP reduc-
(Fig. 5a and c) are collocated with areas enduring high levels           tions by fire-induced O3 are predicted (Fig. 4b and d). Such
of O3 vegetation damage (Fig. 4a and c). As a comparison,                feedbacks additionally enhances local [O3 ] by 0.12 ppbv,

Atmos. Chem. Phys., 21, 11531–11543, 2021                                                  https://doi.org/10.5194/acp-21-11531-2021
Y. Lei et al.: Indirect contributions of global fires to surface ozone                                                              11537

Figure 4. Annual percentage of reductions in GPP caused by O3 from (a, c) non-fire sources and (b, d) fire sources alone with (a, b) high
and (c, d) low O3 sensitivities. Please note the differences in color scales.

Figure 5. Annual feedback to surface O3 caused by O3 vegetation damage with (a, b) high and (c, d) low O3 sensitivities. Panels (a) and (c)
represent feedback by O3 from non-fire sources, and panels (b) and (d) represent feedback by O3 from fire emissions alone. Please note the
differences in color scales.

https://doi.org/10.5194/acp-21-11531-2021                                              Atmos. Chem. Phys., 21, 11531–11543, 2021
11538 Y. Lei et al.: Indirect contributions of global fires to surface ozone
averaged over central Africa, and 0.09 ppbv, averaged over non-fire sources, fire emissions cause larger relative pertur-
southern Asia. However, limited O3 –vegetation feedback is bations in surface [O3 ] through O3 –vegetation interactions
found in the eastern US, eastern China, and western Europe (Fig. 7b and d). The ratios of indirect to direct annual 1[O3 ]
because of either low fire-induced 1[O3 ] (Fig. 3b) or low are 3.7 % averaged over eastern China, 2.0 % averaged over
1GPP (Fig. 4b and d). The changes in O3 dry deposition ve- the eastern US, and 1.6 % averaged over western Europe.
locity broadly match the pattern of O3 –vegetation feedback For these regions, the absolute 1[O3 ] from direct fire emis-
(Fig. S4), suggesting that reduced dry deposition velocity due sions is usually lower than 1 ppbv (Fig. 3b). However, the
to O3 -induced inhibition of stomatal conductance is the dom- high level of background [O3 ] (all sources except fire emis-
inant driver for the enhanced surface [O3 ]. sions; Fig. 3a) provides such a sensitive environment that the
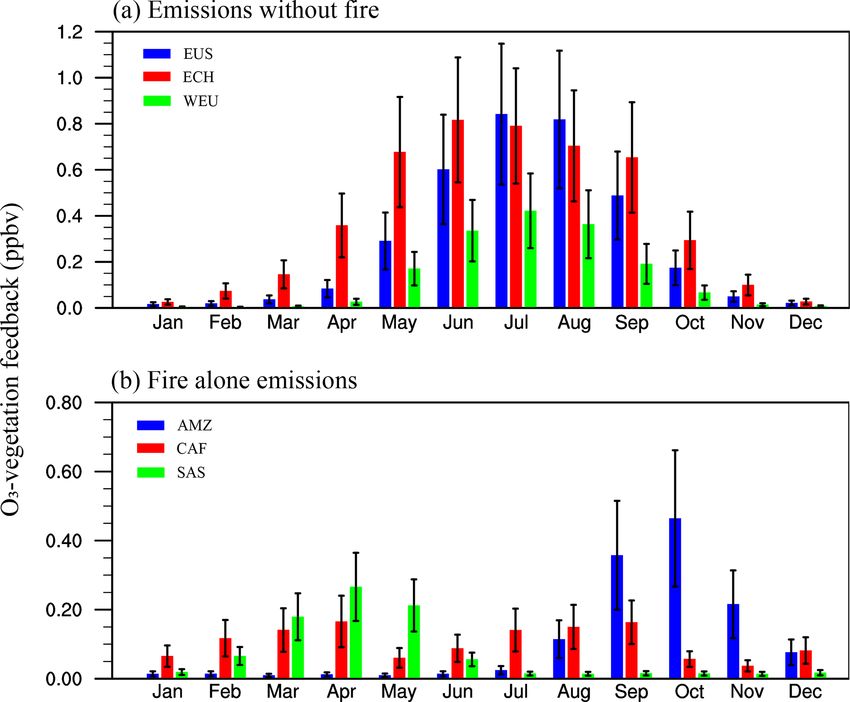
Figure 6 shows seasonal variations in O3 –vegetation feed- moderate increases in [O3 ] from fires can cause significant
back. Without fire emissions, O3 –vegetation feedback in feedback to regional surface [O3 ] through vegetation dam-
eastern China, the eastern US, and western Europe shows age. For fire-prone regions, the ratios of indirect to direct an-
similar seasonal variations, increasing from January to July nual 1[O3 ] are 2.6 % averaged over southern Asia, 1.9 % av-
and then decreasing (Fig. 6a). For these regions, surface eraged over the eastern US, and 1.4 % averaged over central
[O3 ] and stomatal conductance reach maximums during the Africa.
growth season (May–October), resulting in instantaneous O3
uptake. Therefore, O3 –vegetation interactions are expected 3.6 Aggravated O3 damage to GPP through
to be stronger during the growth season in the Northern O3 –vegetation feedback
Hemisphere. However, O3 –vegetation feedback driven by
fires in the Amazon and southern Asia reaches a maxi- The additional O3 enhancement can exacerbate the dam-
mum during August–December and February–June, respec- aging effects on vegetation. Without fire emissions, on-
tively. Moreover, double peaks are shown in central Africa, line O3 causes a global annual GPP reduction of 0.2 %
with maximums during February–April and July–September (299.6 Tg C yr−1 ; Fig. S6a and c) from the offline O3 . Re-
(Fig. 6b). The distinct seasonal variations in biomass burn- gionally, additional reductions are mainly found in eastern
ing regions are attributed to fire emissions. At low lati- China, the eastern US, and western Europe, where GPP is
tudes, stomatal conductance shows limited seasonal varia- further decreased by 27.1, 40.8, and 28.4 Tg C yr−1 , respec-
tions. Therefore, O3 –vegetation feedback driven by fires is tively. For fire emissions, the online fire-induced 1O3 results
mainly dependent on fire-induced 1[O3 ]. in a higher GPP reduction of 25.0 Tg C yr−1 averaged over
Fire-induced O3 shows stronger interactions with vegeta- the Amazon, 24.3 Tg C yr−1 averaged over central Africa,
tion under favorable meteorological conditions. We sort daily and 7.1 Tg C yr−1 averaged over southern Asia compared to
1[O3 ] from O3 –vegetation feedback and calculate the aver- the offline fire-induced 1O3 (Fig. S6b and d). Such spatial
age of 1[O3 ] above the 95th percentile (Fig. S5). The spatial patterns are broadly consistent with 1[O3 ] induced by O3 –
pattern of 1[O3 ] during extreme O3 –vegetation feedback is vegetation feedback (Fig. 5).
broadly consistent with that of the annual average, albeit with
much stronger O3 –vegetation feedback. Without fire emis-
sions, O3 –vegetation feedback enhances [O3 ] by 2.0 ppbv av- 4 Conclusions and discussion
eraged over eastern China, 1.8 ppbv averaged over the east-
ern US, and 1.1 ppbv averaged over western Europe (Fig. S5a Many studies have explored the direct contributions to sur-
and c). Fire emissions alone enhance [O3 ] through O3 – face O3 by fire emissions. However, the feedback of fire-
vegetation interactions by 1.1 ppbv averaged over the Ama- induced O3 vegetation damage to surface [O3 ] remains un-
zon, 0.8 ppbv averaged over southern Asia, and 0.6 ppbv quantified. In this study, we find that fire-induced O3 causes
averaged over central Africa during extreme O3 –vegetation a positive feedback to surface [O3 ] mainly because of the
feedback (Fig. S5b and d). inhibition effects on stomatal conductance. Regionally, O3 –
vegetation feedback driven by fires enhances surface annual
3.5 Indirect vs. direct contributions of fires to O3 [O3 ] by 0.13 ppbv averaged over the Amazon, 0.12 ppbv
averaged over central Africa, and 0.09 ppbv averaged over
We further compare the indirect and direct contributions of southern Asia. Such feedbacks exhibit large seasonal vari-
fire emissions to surface [O3 ]. Here, the direct contribu- ations, with the maximums of 0.5 ppbv averaged over the
tions indicate 1[O3 ] caused by fire emissions of chemical Amazon in October, 0.3 ppbv averaged over southern Asia
precursors, while the indirect contributions represent addi- in April, and 0.2 ppbv averaged over central Africa in April.
tional 1[O3 ] from O3 –vegetation interactions caused by fire- During extreme O3 –vegetation interactions, the feedback can
induced O3 . Without fire emissions, O3 –vegetation interac- rise to > 0.6 ppbv in these fire-prone areas. Although direct
tions cause an enhancement of [O3 ] by 1.0 % averaged over formations of O3 from fires are limited in eastern China and
eastern China, 0.8 % averaged over the eastern US, and 0.5 % the eastern US, the feedback of O3 –vegetation coupling re-
averaged over western Europe (Fig. 7a and c). Compared to sults in the additional enhancement of surface [O3 ] by 3.7 %
Atmos. Chem. Phys., 21, 11531–11543, 2021 https://doi.org/10.5194/acp-21-11531-2021Y. Lei et al.: Indirect contributions of global fires to surface ozone 11539 Figure 6. Seasonal variations in O3 –vegetation feedback driven by (a) non-fire sources and (b) fire sources alone. The blue, red, and green bars in (a) represent the O3 –vegetation feedback in eastern US (EUS), eastern China (ECH), and western Europe (WEU), respectively. The blue, red, and green bars in (b) represent the O3 –vegetation feedback in the Amazon (AMZ), central Africa (CAF), and southern Asia (SAS), respectively. The error bars represent low to high O3 -damaging sensitivities. Figure 7. Annal ratios of indirect 1[O3 ] to ambient [O3 ] from (a, c) non-fire emissions and the ratios of indirect to direct 1[O3 ] from (b, d) fire emissions alone with (a, b) high and (c, d) low O3 -damaging sensitivities. Please note the differences in color scales. https://doi.org/10.5194/acp-21-11531-2021 Atmos. Chem. Phys., 21, 11531–11543, 2021
11540                                                     Y. Lei et al.: Indirect contributions of global fires to surface ozone

and 2.0 % on the fire-induced 1[O3 ]. Such large ratios in         et al., 2014, https://doi.org/10.1016/j.atmosres.2014.01.003; Laban
these regions are attributed to the high level of ambient [O3 ]    et al., 2018, https://doi.org/10.5194/acp-18-15491-2018; Pope et
that provides a sensitive environment in which moderate in-        al., 2020, https://doi.org/10.1029/2019GL084143). The GC-YIBs
creases in [O3 ] from fires can cause large indirect contribu-     simulation results are available from the corresponding authors on
tions to regional [O3 ] through vegetation damage.                 request.
   Some uncertainties may affect the conclusions of this
study. (i) The GC-YIBs simulations do not consider the di-
                                                                   Supplement. The supplement related to this article is available on-
rect fire damage to vegetation and the consequent long-term
                                                                   line at: https://doi.org/10.5194/acp-21-11531-2021-supplement.
recovery of forests. In our study, we focus only on the feed-
backs of fire-induced O3 –vegetation interactions to surface
O3 . (ii) Fires can decrease VOC emissions from biogenic           Author contributions. XY conceived the study. YL conducted the
sources by damaging vegetation directly. However, com-             model simulations. YL and XY were responsible for results anal-
pared to the VOCs emitted by fires, the VOC loss from              ysis. HL, LZ, and YY revised and improved the manuscript. HZ,
burned vegetation is generally smaller (Fig. S7). Therefore,       CT, and CG helped prepare model input. YM, LG, and YC helped
the influence of reduced VOCs from vegetation loss on sur-         prepare the observation dataset.
face [O3 ] can be ignored. (iii) There is evidence that O3 ex-
posure may cause “sluggishness” that delays the stomatal
responses to O3 damage (Huntingford et al., 2018). How-            Competing interests. The authors declare that they have no conflict
ever, we do not include sluggishness in our scheme because         of interest.
its net impacts on stomatal conductance remain uncertain.
For example, observations found that the increased short-
term water loss (delayed stomatal responses) may be offset         Disclaimer. Publisher’s note: Copernicus Publications remains
by the decreased long-term water loss (lower steady-state          neutral with regard to jurisdictional claims in published maps and
stomatal conductance) with the stomatal sluggishness (Pao-         institutional affiliations.
letti et al., 2019). (iv) We employed a model resolution of
4◦ ×5◦ due to the limitations in computational resources. We
                                                                   Acknowledgements. The authors acknowledge the United States
performed a 1-year sensitivity simulation at a 2◦ × 2.5◦ reso-
                                                                   Environmental Protection Agency and European Monitoring and
lution. The comparisons show that fire-induced direct O3 en-
                                                                   Evaluation Programme for making their data publicly available.
hancement is very similar between the simulations at low and
high resolutions, although the former runs predict slightly
higher changes in [O3 ] than the latter (Fig. S8). (v) Differ-     Financial support. This research has been supported by the
ent biomass burning datasets may affect the estimated O3 –         Jiangsu Science Fund for Distinguished Young Scholars (grant
vegetation feedback in our study. At present, the FINNv1.5         no. BK20200040) and the National Natural Science Foundation of
and GFEDv4.1 inventories are available in the public release       China (grant no. 41975155).
of GEOS-Chem v12.0.0. Compared with the FINNv1.5 in-
ventory, simulations using the GFEDv4.1 inventory predict a
lower O3 –vegetation feedback in the Amazon (Fig. S9a) and         Review statement. This paper was edited by Manvendra K. Dubey
southern Asia (Fig. S9c) but a higher O3 –vegetation feed-         and reviewed by two anonymous referees.
back in central Africa (Fig. S9b).
   Despite these uncertainties, we present the first estimate
of O3 enhancement by fire emissions through O3 –vegetation         References
interactions. Such an enhancement is not limited to fire-
prone regions but is also significant over downwind areas          Ahamad, F., Latif, M. T., Tang, R., Juneng, L., Dominick, D.,
with high ambient [O3 ] levels. Although the absolute per-           and Juahir, H.: Variation of surface ozone exceedance
turbations may be moderate for the whole fire season, O3 –           around Klang Valley, Malaysia, Atmos. Res., 139, 116–127,
vegetation interactions can largely increase surface O3 dur-         https://doi.org/10.1016/j.atmosres.2014.01.003, 2014.
ing extreme O3 –vegetation interactions, leading to additional     Ainsworth, E. A., Yendrek, C. R., Sitch, S., Collins, W. J., and Em-
threats to public health and ecosystem productivity.                 berson, L. D.: The Effects of Tropospheric Ozone on Net Pri-
                                                                     mary Productivity and Implications for Climate Change, Annu.
                                                                     Rev. Plant. Biol., 63, 637–661, https://doi.org/10.1146/annurev-
                                                                     arplant-042110-103829, 2012.
Data availability. The site-level [O3 ] in the US can be down-
                                                                   Akagi, S. K., Yokelson, R. J., Wiedinmyer, C., Alvarado, M. J.,
load from AQS (https://www.epa.gov/aqs, AQS, 2021). The site-
                                                                     Reid, J. S., Karl, T., Crounse, J. D., and Wennberg, P. O.: Emis-
level [O3 ] in Europe can be download from EMEP (https://emep.
                                                                     sion factors for open and domestic biomass burning for use
int, EMEP, 2021). The observed [O3 ] at the Manaus, Tanjung
                                                                     in atmospheric models, Atmos. Chem. Phys., 11, 4039–4072,
Malim, and Welgegund sites are from earlier studies (Ahamad
                                                                     https://doi.org/10.5194/acp-11-4039-2011, 2011.

Atmos. Chem. Phys., 21, 11531–11543, 2021                                           https://doi.org/10.5194/acp-21-11531-2021
Y. Lei et al.: Indirect contributions of global fires to surface ozone 11541
Akhtar, N., Yamaguchi, M., Inada, H., Hoshino, D., Kondo, T., Curci, G., Beekmann, M., Vautard, R., Smiatek, G., Stein-
and Izuta, T.: Effects of ozone on growth, yield and leaf brecher, R., Theloke, J., and Friedrich, R.: Modelling study
gas exchange rates of two Bangladeshi cultivars of wheat of the impact of isoprene and terpene biogenic emissions
(Triticum aestivum L.), Environ. Pollut., 158, 1763–1767, on European ozone levels, Atmos. Environ., 43, 1444–1455,
https://doi.org/10.1016/j.envpol.2009.11.011, 2010. https://doi.org/10.1016/j.atmosenv.2008.02.070, 2009.
Amiro, B. D., Cantin, A., Flannigan, M. D., and de Groot, W. J.: Fu- Dang, R. and Liao, H.: Severe winter haze days in the Beijing–
ture emissions from Canadian boreal forest fires, Can. J. Forest. Tianjin–Hebei region from 1985 to 2017 and the roles of an-
Res., 39, 383–395, https://doi.org/10.1139/X08-154, 2009. thropogenic emissions and meteorology, Atmos. Chem. Phys.,
Andreae, M. and Rosenfeld, D.: Aerosol–cloud–precipitation inter- 19, 10801–10816, https://doi.org/10.5194/acp-19-10801-2019,
actions. Part 1. The nature and sources of cloud-active aerosols, 2019.
Earth-Sci. Rev., 89, 13–41, 2008. David, L. M., Ravishankara, A., Brewer, J. F., Sauvage, B.,
Andreae, M. O. and Merlet, P.: Emission of trace gases and aerosols Thouret, V., Venkataramani, S., and Sinha, V.: Tropo-
from biomass burning, Global Biogeochem. Cy., 15, 955–966, spheric ozone over the Indian subcontinent from 2000
2001. to 2015: Data set and simulation using GEOS-Chem
AQS: Ambient air pollution data from the Air Quality System, chemical transport model, Atmos. Environ., 219, 117039,
United States Environmental Protection Agency, available at: https://doi.org/10.1016/j.atmosenv.2019.117039, 2019.
https://www.epa.gov/aqs, last access: 1 August 2021. EMEP: The air quality monitoring network from European Moni-
Baldocchi, D. D., Hicks, B. B., and Camara, P.: A Canopy Stomatal- toring and Evaluation Programme, available at: https://emep.int,
Resistance Model for Gaseous Deposition to Vegetated Surfaces, last access: 1 August 2021.
Atmos. Environ., 21, 91–101, https://doi.org/10.1016/0004- Farquhar, G. D., von Caemmerer, S., and Berry, J. A.: A biochem-
6981(87)90274-5, 1987. ical model of photosynthetic CO2 assimilation in leaves of C3
Balshi, M. S., McGUIRE, A. D., Duffy, P., Flannigan, M., Walsh, species, Planta, 149, 78–90, 1980.
J., and Melillo, J.: Assessing the response of area burned to Feng, Z. Z., Yuan, X. Y., Fares, S., Loreto, F., Li, P.,
changing climate in western boreal North America using a Hoshika, Y., and Paoletti, E.: Isoprene is more affected by cli-
Multivariate Adaptive Regression Splines (MARS) approach, mate drivers than monoterpenes: A meta-analytic review on
Glob. Change Biol., 15, 578–600, https://doi.org/10.1111/j.1365- plant isoprenoid emissions, Plant Cell Environ., 42, 1939–1949,
2486.2008.01679.x, 2009. https://doi.org/10.1111/pce.13535, 2019.
Barret, B., Sauvage, B., Bennouna, Y., and Le Flochmoen, Fitzky, A. C., Sandén, H., Karl, T., Fares, S., Calfapietra, C.,
E.: Upper-tropospheric CO and O3 budget during the Asian Grote, R., Saunier, A., and Rewald, B.: The interplay between
summer monsoon, Atmos. Chem. Phys., 16, 9129–9147, ozone and urban vegetation–BVOC emissions, ozone deposition
https://doi.org/10.5194/acp-16-9129-2016, 2016. and tree ecophysiology, Frontiers in Forests and Global Change,
Bey, I., Jacob, D. J., Logan, J. A., and Yantosca, R. M.: Asian 2, 50, https://doi.org/10.3389/ffgc.2019.00050, 2019.
chemical outflow to the Pacific in spring: Origins, pathways, Fountoukis, C. and Nenes, A.: ISORROPIA II: a computa-
and budgets, J. Geophys. Res.-Atmos., 106, 23097–23113, tionally efficient thermodynamic equilibrium model for
2−
https://doi.org/10.1029/2001jd000806, 2001. K+ −Ca2+ −Mg2+ −NH+ + −
4 −Na −SO4 −NO3 −Cl −H2 O
−
Bond-Lamberty, B., Peckham, S. D., Ahl, D. E., and aerosols, Atmos. Chem. Phys., 7, 4639–4659,
Gower, S. T.: Fire as the dominant driver of central Cana- https://doi.org/10.5194/acp-7-4639-2007, 2007.
dian boreal forest carbon balance, Nature, 450, 89–92, Gong, C. and Liao, H.: A typical weather pattern for ozone pollution
https://doi.org/10.1038/nature06272, 2007. events in North China, Atmos. Chem. Phys., 19, 13725–13740,
Booker, F. L., Burkey, K. O., Pursley, W. A., and Heagle, A. S.: https://doi.org/10.5194/acp-19-13725-2019, 2019.
Elevated carbon dioxide and ozone effects on peanut: I. Gas- Gong, C., Lei, Y., Ma, Y., Yue, X., and Liao, H.: Ozone–
exchange, biomass, and leaf chemistry, Crop. Sci., 47, 1475– vegetation feedback through dry deposition and isoprene emis-
1487, https://doi.org/10.2135/cropsci2006.08.0537, 2007. sions in a global chemistry–carbon–climate model, Atmos.
Brey, S. J., Barnes, E. A., Pierce, J. R., Wiedinmyer, C., and Fis- Chem. Phys., 20, 3841–3857, https://doi.org/10.5194/acp-20-
cher, E. V.: Environmental Conditions, Ignition Type, and Air 3841-2020, 2020.
Quality Impacts of Wildfires in the Southeastern and Western He, C., Clifton, O., Felker-Quinn, E., Fulgham, S. R., Juncosa
United States, Earths Future, 6, 1442–1456, 2018. Calahorrano, J. F., Lombardozzi, D., Purser, G., Riches, M.,
Cheng, L., McDonald, K. M., Angle, R. P., and Sandhu, H. S.: Schwantes, R., Tang, W., Poulter, B., and Steiner, A. L.: Inter-
Forest fire enhanced photochemical air pollution. A case study, actions between Air Pollution and Terrestrial Ecosystems: Per-
Atmos. Environ., 32, 673–681, https://doi.org/10.1016/S1352- spectives on Challenges and Future Directions, B. Am. Mete-
2310(97)00319-1, 1998. orol. Soc., 102, E525–E538, https://doi.org/10.1175/BAMS-D-
Clark, D. B., Mercado, L. M., Sitch, S., Jones, C. D., Gedney, N., 20-0066.1, 2020.
Best, M. J., Pryor, M., Rooney, G. G., Essery, R. L. H., Blyth, Heald, C. L. and Geddes, J. A.: The impact of historical
E., Boucher, O., Harding, R. J., Huntingford, C., and Cox, P. land use change from 1850 to 2000 on secondary particu-
M.: The Joint UK Land Environment Simulator (JULES), model late matter and ozone, Atmos. Chem. Phys., 16, 14997–15010,
description – Part 2: Carbon fluxes and vegetation dynamics, https://doi.org/10.5194/acp-16-14997-2016, 2016.
Geosci. Model Dev., 4, 701–722, https://doi.org/10.5194/gmd-4- Huntingford, C., Oliver, R. J., Mercado, L. M., and Sitch, S.:
701-2011, 2011. Technical note: A simple theoretical model framework to
describe plant stomatal “sluggishness” in response to ele-
https://doi.org/10.5194/acp-21-11531-2021 Atmos. Chem. Phys., 21, 11531–11543, 202111542 Y. Lei et al.: Indirect contributions of global fires to surface ozone vated ozone concentrations, Biogeosciences, 15, 5415–5422, ity and trend of summer surface ozone in the mountainous https://doi.org/10.5194/bg-15-5415-2018, 2018. western United States, Atmos. Chem. Phys., 16, 14687–14702, Inada, H., Kondo, T., Akhtar, N., Hoshino, D., Yamaguchi, M., https://doi.org/10.5194/acp-16-14687-2016, 2016. and Izuta, T.: Relationship between cultivar difference in Lu, X., Zhang, L., Chen, Y., Zhou, M., Zheng, B., Li, K., Liu, Y., the sensitivity of net photosynthesis to ozone and reac- Lin, J., Fu, T.-M., and Zhang, Q.: Exploring 2016–2017 sur- tive oxygen species scavenging system in Japanese winter face ozone pollution over China: source contributions and me- wheat (Triticum aestivum), Physiol. Plantarum, 146, 217–227, teorological influences, Atmos. Chem. Phys., 19, 8339–8361, https://doi.org/10.1111/j.1399-3054.2012.01618.x, 2012. https://doi.org/10.5194/acp-19-8339-2019, 2019. Jaffe, D. A. and Wigder, N. L.: Ozone production from McLinden, C., Olsen, S., Hannegan, B., Wild, O., Prather, M., and wildfires: A critical review, Atmos. Environ., 51, 1–10, Sundet, J.: Stratospheric ozone in 3-D models: A simple chem- https://doi.org/10.1016/j.atmosenv.2011.11.063, 2012. istry and the cross-tropopause flux, J. Geophys. Res.-Atmos., Jaffe, D. A., Wigder, N., Downey, N., Pfister, G., Boynard, A., and 105, 14653–14665, 2000. Reid, S. B.: Impact of wildfires on ozone exceptional events Nuryanto, D. E.: Simulation of forest fires smoke using WRF-Chem in the Western US, Environ. Sci. Technol., 47, 11065–11072, model with FINN fire emissions in Sumatera, Procedia Environ. https://doi.org/10.1021/es402164f, 2013. Sci., 24, 65–69, https://doi.org/10.1016/j.proenv.2015.03.010, Jiang, X. Y., Wiedinmyer, C., and Carlton, A. G.: Aerosols from 2015. Fires: An Examination of the Effects on Ozone Photochemistry Oltmans, S. J., Lefohn, A. S., Harris, J. M., Tarasick, D. W., in the Western United States, Environ. Sci. Technol., 46, 11878– Thompson, A. M., Wernli, H., Johnson, B. J., Novelli, P. C., 11886, https://doi.org/10.1021/es301541k, 2012. Montzka, S. A., Ray, J. D., Patrick, L. C., Sweeney, C., Juráň, S., Grace, J., and Urban, O.: Temporal Changes in Ozone Jefferson, A., Dann, T., Davies, J., Shapiro, M., and Hol- Concentrations and Their Impact on Vegetation, Atmosphere, 12, ben, B. N.: Enhanced ozone over western North America from 82, https://doi.org/10.3390/atmos12010082, 2021. biomass burning in Eurasia during April 2008 as seen in sur- Karnosky, D. F., Skelly, J. M., Percy, K. E., and Chappelka, A. H.: face and profile observations, Atmos. Environ., 44, 4497–4509, Perspectives regarding 50 years of research on effects of tropo- https://doi.org/10.1016/j.atmosenv.2010.07.004, 2010. spheric ozone air pollution on US forests, Environ. Pollut., 147, Pacifico, F., Folberth, G. A., Sitch, S., Haywood, J. M., Rizzo, 489–506, https://doi.org/10.1016/j.envpol.2006.08.043, 2007. L. V., Malavelle, F. F., and Artaxo, P.: Biomass burning re- Keller, C. A., Long, M. S., Yantosca, R. M., Da Silva, A. lated ozone damage on vegetation over the Amazon forest: a M., Pawson, S., and Jacob, D. J.: HEMCO v1.0: a ver- model sensitivity study, Atmos. Chem. Phys., 15, 2791–2804, satile, ESMF-compliant component for calculating emissions https://doi.org/10.5194/acp-15-2791-2015, 2015. in atmospheric models, Geosci. Model Dev., 7, 1409–1417, Paoletti, E., Grulke, N. E., and Matyssek, R.: Ozone Am- https://doi.org/10.5194/gmd-7-1409-2014, 2014. plifies Water Loss from Mature Trees in the Short Term Kita, K., Fujiwara, M., and Kawakami, S.: Total ozone increase But Decreases It in the Long Term, Forests, 11, 46, associated with forest fires over the Indonesian region and its https://doi.org/10.3390/f11010046, 2019. relation to the El Nino-Southern oscillation, Atmos. Environ., Pope, R. J., Arnold, S. R., Chipperfield, M. P., Reddington, C. L., 34, 2681–2690, https://doi.org/10.1016/S1352-2310(99)00522- Butt, E. W., Keslake, T. D., Feng, W., Latter, B. G., Ker- 1, 2000. ridge, B. J., and Siddans, R.: Substantial increases in East- Laban, T. L., van Zyl, P. G., Beukes, J. P., Vakkari, V., Jaars, ern Amazon and Cerrado biomass burning-sourced tropo- K., Borduas-Dedekind, N., Josipovic, M., Thompson, A. M., spheric ozone, Geophys. Res. Lett., 47, e2019GL084143, Kulmala, M., and Laakso, L.: Seasonal influences on sur- https://doi.org/10.1029/2019GL084143, 2020. face ozone variability in continental South Africa and impli- Sadiq, M., Tai, A. P. K., Lombardozzi, D., and Val Martin, M.: Ef- cations for air quality, Atmos. Chem. Phys., 18, 15491–15514, fects of ozone–vegetation coupling on surface ozone air qual- https://doi.org/10.5194/acp-18-15491-2018, 2018. ity via biogeochemical and meteorological feedbacks, Atmos. Lei, Y., Yue, X., Liao, H., Gong, C., and Zhang, L.: Im- Chem. Phys., 17, 3055–3066, https://doi.org/10.5194/acp-17- plementation of Yale Interactive terrestrial Biosphere model 3055-2017, 2017. v1.0 into GEOS-Chem v12.0.0: a tool for biosphere– Schiferl, L. D. and Heald, C. L.: Particulate matter air pollu- chemistry interactions, Geosci. Model Dev., 13, 1137–1153, tion may offset ozone damage to global crop production, At- https://doi.org/10.5194/gmd-13-1137-2020, 2020. mos. Chem. Phys., 18, 5953–5966, https://doi.org/10.5194/acp- Li, S., Chen, L., Huang, G., Lin, J., Yan, Y., Ni, R., Huo, Y., 18-5953-2018, 2018. Wang, J., Liu, M., and Weng, H.: Retrieval of surface PM2.5 mass Sitch, S., Cox, P. M., Collins, W. J., and Huntingford, C.: concentrations over North China using visibility measurements Indirect radiative forcing of climate change through ozone and GEOS-Chem simulations, Atmos. Environ., 22, 117121, effects on the land-carbon sink, Nature, 448, 791–794, https://doi.org/10.1016/j.atmosenv.2019.117121, 2019. https://doi.org/10.1038/nature06059, 2007. Lombardozzi, D., Levis, S., Bonan, G., and Sparks, J. P.: Predict- Spitters, C.: Separating the diffuse and direct component of global ing photosynthesis and transpiration responses to ozone: decou- radiation and its implications for modeling canopy photosynthe- pling modeled photosynthesis and stomatal conductance, Bio- sis Part II. Calculation of canopy photosynthesis, Agr. Forest Me- geosciences, 9, 3113–3130, https://doi.org/10.5194/bg-9-3113- teorol., 38, 231–242, 1986. 2012, 2012. Travis, K. R., Jacob, D. J., Fisher, J. A., Kim, P. S., Marais, E. A., Lu, X., Zhang, L., Yue, X., Zhang, J., Jaffe, D. A., Stohl, A., Zhu, L., Yu, K., Miller, C. C., Yantosca, R. M., Sulprizio, M. Zhao, Y., and Shao, J.: Wildfire influences on the variabil- P., Thompson, A. M., Wennberg, P. O., Crounse, J. D., St. Clair, Atmos. Chem. Phys., 21, 11531–11543, 2021 https://doi.org/10.5194/acp-21-11531-2021
Y. Lei et al.: Indirect contributions of global fires to surface ozone                                                               11543

  J. M., Cohen, R. C., Laughner, J. L., Dibb, J. E., Hall, S. R.,      Yue, X. and Unger, N.: Ozone vegetation damage effects on
  Ullmann, K., Wolfe, G. M., Pollack, I. B., Peischl, J., Neuman, J.     gross primary productivity in the United States, Atmos.
  A., and Zhou, X.: Why do models overestimate surface ozone in          Chem. Phys., 14, 9137–9153, https://doi.org/10.5194/acp-14-
  the Southeast United States?, Atmos. Chem. Phys., 16, 13561–           9137-2014, 2014.
  13577, https://doi.org/10.5194/acp-16-13561-2016, 2016.              Yue, X. and Unger, N.: The Yale Interactive terrestrial Biosphere
Turetsky, M. R., Kane, E. S., Harden, J. W., Ottmar, R. D., Ma-          model version 1.0: description, evaluation and implementation
  nies, K. L., Hoy, E., and Kasischke, E. S.: Recent acceleration of     into NASA GISS ModelE2, Geosci. Model Dev., 8, 2399–2417,
  biomass burning and carbon losses in Alaskan forests and peat-         https://doi.org/10.5194/gmd-8-2399-2015, 2015.
  lands, Nat. Geosci., 4, 27–31, https://doi.org/10.1038/Ngeo1027,     Yue, X. and Unger, N.: Fire air pollution reduces
  2011.                                                                  global terrestrial productivity, Nat. Commun., 9, 5413,
Val Martin, M., Logan, J. A., Kahn, R. A., Leung, F.-Y., Nelson,         https://doi.org/10.1038/s41467-018-07921-4, 2018.
  D. L., and Diner, D. J.: Smoke injection heights from fires in       Yue, X., Mickley, L. J., Logan, J. A., Hudman, R. C., Martin, M. V.,
  North America: analysis of 5 years of satellite observations, At-      and Yantosca, R. M.: Impact of 2050 climate change on North
  mos. Chem. Phys., 10, 1491–1510, https://doi.org/10.5194/acp-          American wildfire: consequences for ozone air quality, Atmos.
  10-1491-2010, 2010.                                                    Chem. Phys., 15, 10033–10055, https://doi.org/10.5194/acp-15-
van der Werf, G. R., Randerson, J. T., Giglio, L., Collatz, G. J.,       10033-2015, 2015.
  Mu, M., Kasibhatla, P. S., Morton, D. C., DeFries, R. S.,            Yue, X., Keenan, T. F., Munger, W., and Unger, N.: Lim-
  Jin, Y., and van Leeuwen, T. T.: Global fire emissions and the         ited effect of ozone reductions on the 20-year photosynthesis
  contribution of deforestation, savanna, forest, agricultural, and      trend at Harvard forest, Glob. Change Biol., 22, 3750–3759,
  peat fires (1997–2009), Atmos. Chem. Phys., 10, 11707–11735,           https://doi.org/10.1111/gcb.13300, 2016.
  https://doi.org/10.5194/acp-10-11707-2010, 2010.                     Yue, X., Strada, S., Unger, N., and Wang, A.: Future inhibition
Von Caemmerer, S. and Farquhar, G. D.: Some relationships be-            of ecosystem productivity by increasing wildfire pollution over
  tween the biochemistry of photosynthesis and the gas exchange          boreal North America, Atmos. Chem. Phys., 17, 13699–13719,
  of leaves, Planta, 153, 376–387, 1981.                                 https://doi.org/10.5194/acp-17-13699-2017, 2017.
Vongruang, P., Wongwises, P., and Pimonsree, S.: Assessment of         Zhang, L., Jacob, D. J., Downey, N. V., Wood, D. A., Blewitt, D.,
  fire emission inventories for simulating particulate matter in Up-     Carouge, C. C., van Donkelaar, A., Jones, D. B., Murray, L. T.,
  per Southeast Asia using WRF-CMAQ, Atmos. Pollut. Res., 8,             and Wang, Y.: Improved estimate of the policy-relevant back-
  921–929, https://doi.org/10.1016/j.apr.2017.03.004, 2017.              ground ozone in the United States using the GEOS-Chem global
Wang, X., Parisien, M. A., Taylor, S. W., Perrakis, D. D., Lit-          model with 1/2 × 2/3 horizontal resolution over North America,
  tle, J., and Flannigan, M. D.: Future burn probability in south-       Atmos. Environ., 45, 6769–6776, 2011.
  central British Columbia, Int. J. Wildl. Fire, 25, 200–212,          Zhou, S. S., Tai, A. P. K., Sun, S., Sadiq, M., Heald, C. L., and Ged-
  https://doi.org/10.1071/WF15091, 2016.                                 des, J. A.: Coupling between surface ozone and leaf area index
Watson, G. L., Telesca, D., Reid, C. E., Pfister, G. G., and Jer-        in a chemical transport model: strength of feedback and implica-
  rett, M.: Machine learning models accurately predict ozone ex-         tions for ozone air quality and vegetation health, Atmos. Chem.
  posure during wildfire events, Environ. Pollut., 254, 112792,          Phys., 18, 14133–14148, https://doi.org/10.5194/acp-18-14133-
  https://doi.org/10.1016/j.envpol.2019.06.088, 2019.                    2018, 2018.
Wiedinmyer, C., Akagi, S. K., Yokelson, R. J., Emmons, L. K., Al-      Zhu, J., Tai, A. P. K., and Yim, S. H. L.: Effects of ozone-vegetation
  Saadi, J. A., Orlando, J. J., and Soja, A. J.: The Fire INventory      interactions on meteorology and air quality in China using a two-
  from NCAR (FINN): a high resolution global model to estimate           way coupled land-atmosphere model, Atmos. Chem. Phys. Dis-
  the emissions from open burning, Geosci. Model Dev., 4, 625–           cuss. [preprint], https://doi.org/10.5194/acp-2021-165, in review,
  641, https://doi.org/10.5194/gmd-4-625-2011, 2011.                     2021.
Wittig, V. E., Ainsworth, E. A., Naidu, S. L., Karnosky, D. F., and    Ziemke, J. R., Chandra, S., Duncan, B. N., Schoeberl, M. R.,
  Long, S. P.: Quantifying the impact of current and future tropo-       Torres, O., Damon, M. R., and Bhartia, P. K.: Recent
  spheric ozone on tree biomass, growth, physiology and biochem-         biomass burning in the tropics and related changes in
  istry: a quantitative meta-analysis, Glob. Change Biol., 15, 396–      tropospheric ozone, Geophys. Res. Lett., 36, L15819,
  424, https://doi.org/10.1111/j.1365-2486.2008.01774.x, 2009.           https://doi.org/10.1029/2009GL039303, 2009.
Yan, Y., Lin, J., and He, C.: Ozone trends over the United States
  at different times of day, Atmos. Chem. Phys., 18, 1185–1202,
  https://doi.org/10.5194/acp-18-1185-2018, 2018.

https://doi.org/10.5194/acp-21-11531-2021                                              Atmos. Chem. Phys., 21, 11531–11543, 2021
You can also read