GCAT|Panel, a comprehensive structural variant haplotype map of the Iberian population from high-coverage whole-genome sequencing
←
→
Page content transcription
If your browser does not render page correctly, please read the page content below
2464–2479 Nucleic Acids Research, 2022, Vol. 50, No. 5                                                                Published online 18 February 2022
https://doi.org/10.1093/nar/gkac076

GCAT|Panel, a comprehensive structural variant
haplotype map of the Iberian population from
high-coverage whole-genome sequencing
Jordi Valls-Margarit 1,† , Iván Galván-Femenı́a 2,† , Daniel Matı́as-Sánchez 1,† ,
Natalia Blay2 , Montserrat Puiggròs1 , Anna Carreras2 , Cecilia Salvoro1 , Beatriz Cortés2 ,
Ramon Amela1 , Xavier Farre2 , Jon Lerga-Jaso3 , Marta Puig 3 ,
Jose Francisco Sánchez-Herrero4 , Victor Moreno 5,6,7,8 , Manuel Perucho9,10 ,
Lauro Sumoy4 , Lluı́s Armengol11 , Olivier Delaneau12,13 , Mario Cáceres3,14 ,

                                                                                                                                                                       Downloaded from https://academic.oup.com/nar/article/50/5/2464/6527675 by guest on 03 July 2022
Rafael de Cid 2,*,‡ and David Torrents 1,14,*
1
  Life Sciences Department, Barcelona Supercomputing Center (BSC), Barcelona 08034, Spain, 2 Genomes for
Life-GCAT lab Group, Institute for Health Science Research Germans Trias i Pujol (IGTP), Badalona 08916, Spain,
3
  Institut de Biotecnologia i de Biomedicina, Universitat Autònoma de Barcelona, Bellaterra, Barcelona 08193, Spain,
4
  High Content Genomics and Bioinformatics Unit, Institute for Health Science Research Germans Trias i Pujol
(IGTP), 08916 Badalona, Spain, 5 Catalan Institute of Oncology, Hospitalet del Llobregat, 08908, Spain, 6 Bellvitge
Biomedical Research Institute (IDIBELL), Hospitalet del Llobregat, 08908, Spain, 7 CIBER Epidemiologı́a y Salud
Pública (CIBERESP), Madrid 28029, Spain, 8 Universitat de Barcelona (UB), Barcelona 08007, Spain, 9 Sanford
Burnham Prebys Medical Discovery Institute (SBP), La Jolla, CA 92037, USA, 10 Cancer Genetics and Epigenetics,
Program of Predictive and Personalized Medicine of Cancer (PMPPC), Health Science Research Institute Germans
Trias i Pujol (IGTP), Badalona 08916, Spain, 11 Quantitative Genomic Medicine Laboratories (qGenomics), Esplugues
del Llobregat, 08950, Spain, 12 Department of Computational Biology, University of Lausanne, Génopode, 1015
Lausanne, Switzerland, 13 Swiss Institute of Bioinformatics (SIB), University of Lausanne, Quartier Sorge – Batiment
Amphipole, 1015 Lausanne, Switzerland and 14 ICREA, Barcelona 08010, Spain

Received July 20, 2021; Revised December 24, 2021; Editorial Decision January 18, 2022; Accepted February 09, 2022

ABSTRACT                                                                             high coverage (30x) whole-genomes from the Iberian
                                                                                     GCAT Cohort, containing a median of 3.52M SNVs,
The combined analysis of haplotype panels with phe-
                                                                                     606 336 indels and 6393 SVs per individual. The
notype clinical cohorts is a common approach to ex-
                                                                                     haplotype panel is able to impute up to 14 360 728
plore the genetic architecture of human diseases.
                                                                                     SNVs/indels and 23 179 SVs, showing a 2.7-fold in-
However, genetic studies are mainly based on sin-
                                                                                     crease for SVs compared with available genetic varia-
gle nucleotide variants (SNVs) and small insertions
                                                                                     tion panels. The value of this panel for SVs analysis is
and deletions (indels). Here, we contribute to fill this
                                                                                     shown through an imputed rare Alu element located
gap by generating a dense haplotype map focused
                                                                                     in a new locus associated with Mononeuritis of lower
on the identification, characterization, and phasing
                                                                                     limb, a rare neuromuscular disease. This study rep-
of structural variants (SVs). By integrating multiple
                                                                                     resents the first deep characterization of genetic vari-
variant identification methods and Logistic Regres-
                                                                                     ation within the Iberian population and the first oper-
sion Models (LRMs), we present a catalogue of 35 431
                                                                                     ational haplotype panel to systematically include the
441 variants, including 89 178 SVs (≥50 bp), 30 325
                                                                                     SVs into genome-wide genetic studies.
064 SNVs and 5 017 199 indels, across 785 Illumina

* To
   whom correspondence should be addressed. Tel: +34 934134074; Email: david.torrents@bsc.es
Correspondence may also be addressed to Rafael de Cid. Tel: +34 930330542; Email: rdecid@igtp.cat
†
 The authors wish it to be known that, in their opinion, the first three authors should be regarded as joint First Authors.
‡
 Lead contact for data access.
Present address: Iván Galván-Femenı́a, Institute for Research in Biomedicine (IRB Barcelona), The Barcelona Institute of Science and Technology, 08028, Barcelona,
Spain.

C The Author(s) 2022. Published by Oxford University Press on behalf of Nucleic Acids Research.
This is an Open Access article distributed under the terms of the Creative Commons Attribution-NonCommercial License
(http://creativecommons.org/licenses/by-nc/4.0/), which permits non-commercial re-use, distribution, and reproduction in any medium, provided the original work
is properly cited. For commercial re-use, please contact journals.permissions@oup.com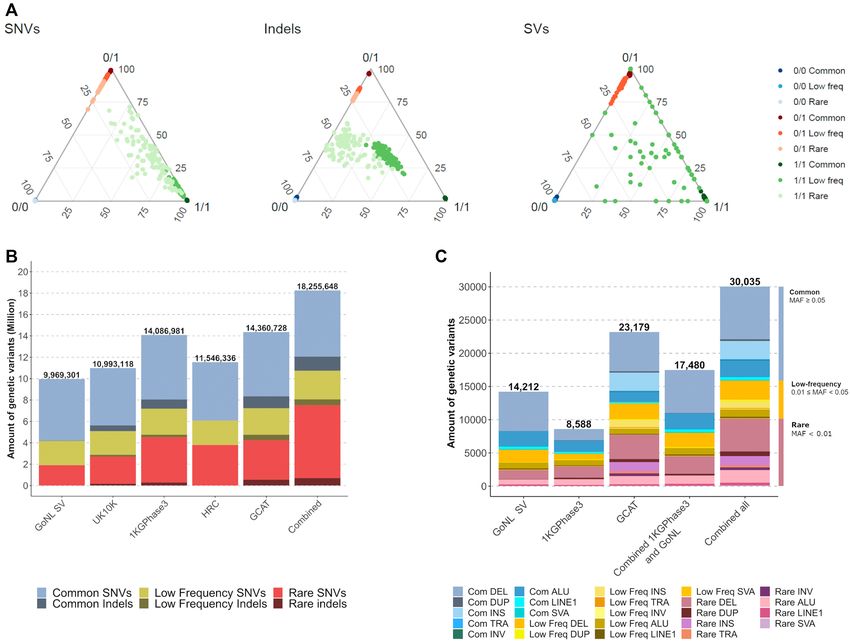
Nucleic Acids Research, 2022, Vol. 50, No. 5 2465

INTRODUCTION                                                     quality imputation (info score ≥ 0.7) of ∼9000–14 000 SVs
                                                                 (≥50 bp), but considering the ranges of SVs that the com-
One of the central aims of biology and biomedicine has been
                                                                 munity is now reporting across individuals, this is still in-
the characterization of genetic variation across humans to
                                                                 complete. Therefore, it is necessary to generate improved
answer evolutionary questions and to explain phenotypic
                                                                 variability reference panels of controlled populations by in-
variability in relation to disease. From the first genotyp-
                                                                 cluding SVs in the discovery and functional interpretation
ing and sequencing efforts, scientists have been gradually
                                                                 of associated variants to power-up current genetic studies.
identifying specific genomic regions that vary within and
                                                                    In this study, we contribute to fill this gap by generat-
across different populations, elaborating the first maps of
                                                                 ing a new SV-enriched haplotype reference panel of human
human genetic variation (e.g. the HapMap Phase I (1)).
                                                                 variation, through the analysis of whole-genome sequences
Next-generation sequencing (NGS) technologies are now
                                                                 (30×) of Iberian individuals from the GCAT|Genomes for
allowing to systematically evaluate the genetic variability
                                                                 Life Cohort (www.genomesforlife.com) (17,18). For this, we
across the entire genome of hundreds and thousands of
                                                                 developed and applied a comprehensive genomic analysis
individuals. This has increased >200-fold the number of
                                                                 pipeline based on the weighted integration and orthogonal
known genomic variants over the past 10 years, resulting in

                                                                                                                                   Downloaded from https://academic.oup.com/nar/article/50/5/2464/6527675 by guest on 03 July 2022
                                                                 validation of the results of multiple variant callers to gen-
much richer reference catalogues of genetic variability. One
                                                                 erate a robust catalogue of genetic variability that covers
example is HRC (2) or Trans-Omics for Precision Medicine
                                                                 from SNVs to large SVs. These variants were further phased
(TOPMed) (3), listing more than 39.2M and 410M poly-
                                                                 and converted into haplotypes that can be incorporated into
morphic positions, respectively, from several human popu-
                                                                 GWAS. This study represents an important step towards the
lations. The extensive genetic and phenotypic characteriza-
                                                                 completion of the annotation and characterization of the
tion of cohorts using rich variability reference panels is now
                                                                 human genome and provides a unique resource for the in-
fuelling up Genome-Wide Association Studies (GWAS). A
                                                                 corporation of SVs into genetic studies.
total of 151 703 unique genetic variants are already re-
ported to be associated across 5193 unique traits (GWAS
catalog, version1.0.2 release 05/05/2021, https://www.ebi.       MATERIALS AND METHODS
ac.uk/gwas/). Despite these advances, a large fraction of the
                                                                 Benchmarking samples
genetic variability underlying complex diseases still remains
unexplored, as studies have been mostly restricted to single     To benchmark our variant calling strategy, an in-silico sam-
nucleotide variants (SNVs) and small insertions and dele-        ple genome was generated, by inserting a controlled set of 5
tions (indels) (20 000 per individual (13–16), including repeat-rich re-    the GATK Best Practices guidelines.
gions, where short-read sequencing has traditionally shown
low call rates.
                                                                 Variant calling
   Genome-wide imputation from SNP-genotyping array
data is still the most practical and powerful strategy to pre-   We originally selected 17 candidate programs for variant
dict SVs, and test them for association with particular phe-     identification and classification, representing different call-
notypes. Current haplotype reference panels allow a high-        ing algorithms and strategies: Split Read, Discordant Read,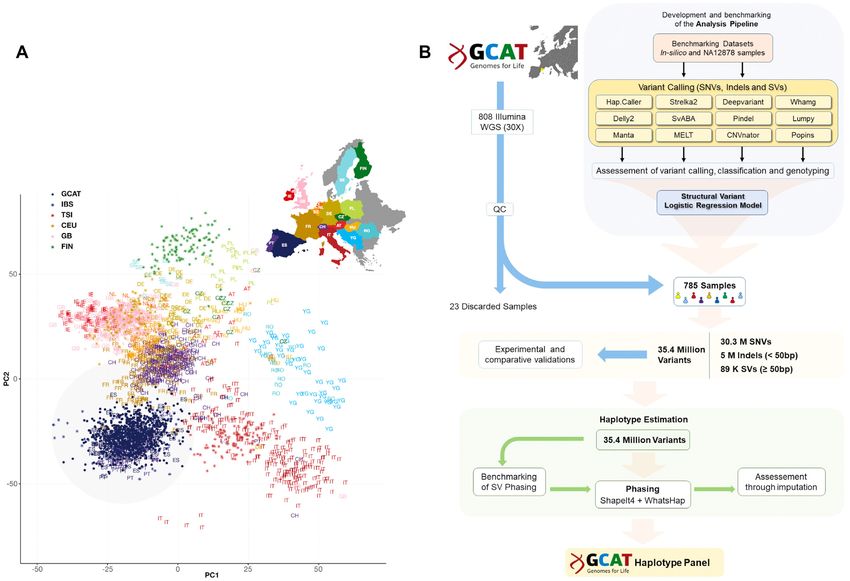
2466 Nucleic Acids Research, 2022, Vol. 50, No. 5

de novo Assembly and Read-depth. Variant callers were            VCF outputs from all included callers, a matrix of unique
Haplotype Caller (25) (version 4.0.2.0), Deepvariant (26)        variants and variant callers together. The criteria to obtain
(version 0.6.1), Strelka2 (27) (version 2.9.2), Platypus (28)    this dataset is described in the ‘Variant calling, filtering and
(version 0.8.1), and VarScan2 (29) (version 2.4.3) for SNVs      merging’ section. True positive detection of the variants was
and indels and Delly2 (30) (version 0.7.7), Manta (31) (ver-     assessed via logistic regression as follows: Y ∼ Xc1 + Xc2
sion 1.2), Pindel (32) (version 0.2.5b9), Lumpy (33) (version    + . . . + Xcn , where Y is the presence (true positive) or ab-
0.2.13), Whamg (34) (version v1.7.0-311-g4e8c), SvABA            sence (false positive) of the variant in the training set, and
(35) (version 7.0.2), CNVnator (36) (version v0.3.3), PopIns     Xc1 , Xc2 , .., Xcn are the genotypes reported by each variant
(37) (version damp v1-151-g4010f61), Genome Strip (38)           caller respectively. Predictions derived from the LRM were
(Version 2.0), Pamir (39) (version 1.2.2), AsmVar (40) (ver-     converted into a binary variable, indicating if the variant
sion 2.0) and MELT (41) (version 2.1.4) (Supplementary in-       was considered a true (PASS, if predicted probability ≥ 0.5)
formation section 3) for SVs. To keep consistency on the         or a false positive (NO PASS). The genotype considered in
type of variables provided by these callers that will later      the LRM is a consensus genotype reported by Haplotype
be used by the Logistic Regression Model (LRM), we have          caller, Deepvariant, and Strelka2 (Supplementary informa-

                                                                                                                                    Downloaded from https://academic.oup.com/nar/article/50/5/2464/6527675 by guest on 03 July 2022
only considered mapping-based methods, despite mapping-          tion section 5.1). The LRM was developed using R software
free methods can also identify SV efficiently.                   (version 3.3.1) and the ISLR package.
   Recall, precision, and F-score metrics were calculated to
evaluate the performance of each variant caller for each         Logistic regression model for SVs. For SVs, we randomly
variant type. The NA12878 sample was used as a gold stan-        splitted the in-silico sample into training, with 70% of the
dard to calculate performance metrics for SNVs and indels,       variants, and the test set, with the rest. True positive de-
and the in-silico was used to benchmark SVs. For SNVs            tection of the variants was assessed via logistic regression
and indels, a variant was considered a true positive when        using 10-fold cross-validations as follows: Y ∼ Xc1 + Xc2 +
the calling matched with the exact position and alternative      . . . + Xcn + G1 + G2 + G3 + G4 , where Y is the presence
allele shown on the benchmarking set. The criteria to clas-      (true positive) or absence (false positive) of the variant in
sify SVs as true positives were: (i) the chromosome and the      the training set Xc1 , Xc2 , .., Xcn are the genotypes reported
breakpoint position ± the breakpoint-error of the variant        by each variant caller; and G1, G2, G3 and G4 are the ge-
caller overlaps with the gold standard (Supplementary Ta-        nomic covariates such as size, number of callers, number of
ble S4), (ii) the SV type label matched with the gold stan-      strategies and reciprocal overlap (Supplementary Table S5).
dard, and (iii) the variant length reported by the caller has    Similar to indels, the input of the LRM for SVs is a merged
a ≥80% reciprocal overlap with the variant length in the         dataset of the VCF outputs from the callers (‘Variant call-
gold standard sample. In addition, for SVs, we also captured     ing, filtering and merging’ section). Prediction is a binary
information from the callers regarding breakpoint resolu-        variable depending on the predicted probability (PASS, if
tion, the size effect on variant calling, and the genotyping     predicted probability ≥ 0.5; NO PASS otherwise). Using
accuracy. Platypus, Varscan2, Genome Strip, Pamir and As-        stepwise backward criteria for determining which genomic
mVar (Supplementary Information section 4.2) were finally        covariates contribute to the true positive detection of the
discarded due to either technical incompatibilities with our     variants, we fitted an LRM for each SV type using the caret
computing environment or the low performance in bench-           (version 6.0–85) and e1071 (version 1.7–3) R packages. Fi-
marking, leaving 12 final variant callers to be applied to the   nally, to determine the performance of the model, the re-
GCAT–WGS samples.                                                ceiver operating characteristic (ROC) curves and area un-
   The effect of the coverage on the variant calling was done    der the curve (AUC) of the LRM were computed for the
by read downsampling of a group of 10 randomly selected          test sets of each SV type using the ‘ROCR’ R package. The
individuals from our cohort, reproducing 5×, 10×, 15×,           largest AUC values correlate with the highest F-scores sug-
20× and 25× coverage. We applied the complete variant            gesting that the LRM predictions are close to the 0 (false
calling strategy to the resulting samples.                       positive) and 1 (true positive) values.
                                                                      The strategy to determine the position of a variant in
                                                                 the LRM was different for each SV type. First, variant
Logistic regression model
                                                                 callers were ranked according to the accuracy in resolv-
Logistic Regression Model (LRM) was used on indels and           ing the breakpoint (with an interval of error of ±10 bp;
SVs to merge and filter the results from all callers, generat-   Supplementary Table S6) and the number of variants de-
ing a final set of high-quality variants with the highest re-    tected. This was used to select unique variants according
call and precision values. This method is proposed as an im-     to the position of the caller for that particular variant. In
proved alternative to other strategies based on the number       the case that a variant was not detected by the best-ranked
of coincident callers, which were also included for compar-      algorithms (Supplementary Table S6), the final position of
ison and evaluation purposes. As discriminative variables,       the variant was considered as the median position and the
LRM used variant and calling-related parameters, like size,      length reported by the rest of the callers.
reciprocal overlap and breakpoint resolution (Supplemen-              The strategy to determine the genotype of a variant in the
tary Table S5).                                                  LRM was adapted to each SV type (Supplementary Fig-
                                                                 ure S3). For Deletions and Insertions, we selected the fi-
Logistic regression model for indels. LRM was trained us-        nal genotype based on the highest recurrence across callers
ing indels of the NA12878 sample and tested using the in-        that identified a particular variant. For Inversions, we di-
silico sample. The LRM input was a merged dataset of the         rectly reported the genotype obtained from the caller with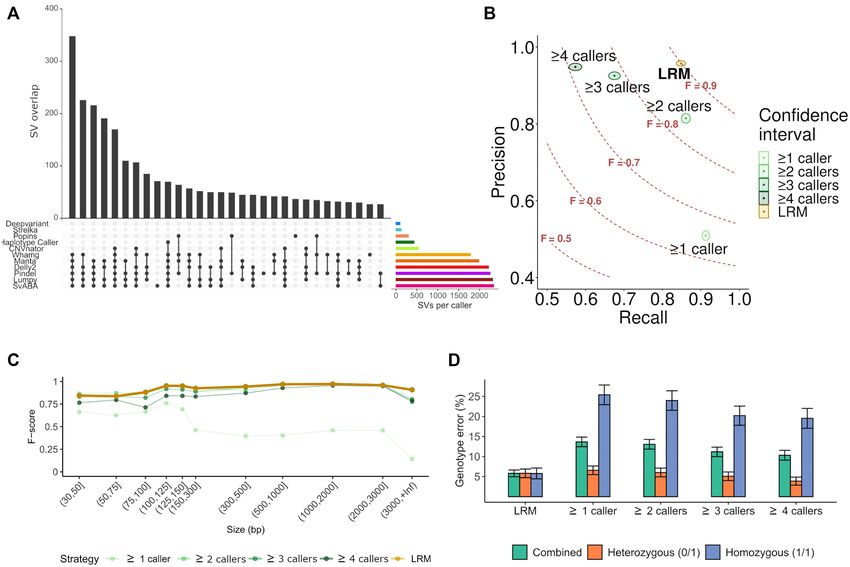
Nucleic Acids Research, 2022, Vol. 50, No. 5 2467

the smallest genotyping error in the benchmarking analysis.    section 7, Supplementary Figure S8), then merged by call
For Duplications and Translocations, which show the low-       and individual according to our benchmarking strategy to
est genotyping accuracy in the benchmarking, we applied a      produce the VCF.
customised genotyping method strategy. This is based on           SNVs and indels calls were merged by (i) the chromo-
the proportion of altered reads from the in-silico sample      some, (ii) position and (iii) REF/ALT allele. SVs were
around the breakpoint: if the proportion of altered reads      merged by (i) variant type, (ii) chromosome, (iii) position,
was  0.80, the genotype was 1/1 (Supplementary        rocal overlap ≥80% between callers (Supplementary infor-
information section 5.2.3).                                    mation section 8.2) and individuals (Supplementary infor-
                                                               mation section 8.3). Given the consistently high accuracy
Quality control                                                in detecting SNVs for most callers, we considered one of
                                                               these variants as a true positive if it was detected by at least
The GCAT Cohort is a prospective cohort study that in-
                                                               two callers. For indels and SV, we applied LRM consider-
cludes 19 267 volunteers from Catalonia, in the North-

                                                                                                                                  Downloaded from https://academic.oup.com/nar/article/50/5/2464/6527675 by guest on 03 July 2022
                                                               ing a variant as true positive if the prediction probability
east of Spain (http://www.genomesforlife.org/). The partic-
                                                               was ≥0.5.
ipants were recruited from the general population (2014–
                                                                  We calculated the true positive proportion for each vari-
2017) with the only restriction to live at least five years
                                                               ant determined by the LRM prediction in all GCAT sam-
in Catalonia and aged between 40 and 65 years. All par-
                                                               ples. We referred to this proportion as the quality score of
ticipants who agreed to be part of the study provided in-
                                                               the merged variant. Then, we considered a variant as PASS
formed consent and were asked to sign a consent agree-
                                                               if the quality score was ≥0.5. We reported the length and
ment. Whole-genome sequencing data from 808 individu-
                                                               position of each SV as the median length and median po-
als using HiSeq 4000 sequencer (Illumina, 30× coverage,
                                                               sition of all the samples that have that SV (Supplemen-
read length 150 bp, insert size 600 bp) was obtained in
                                                               tary methods). Finally, monomorphic variants, variants out
FASTQ format (Supplementary Tables S7 and S8). BAM
                                                               of Hardy-Weinberg equilibrium (Bonferroni correction P-
files were built using the hs37d5 reference genome and fol-
                                                               value < 5 × 10⁻⁸ ), and variants with ≥10% of missingness
lowing the GATK Best Practices (Supplementary Figure
                                                               were excluded from subsequent analysis. Data and Code
S4). FASTQ and BAM files corresponding to these samples
                                                               availability is described below. Summarized later at the re-
were deposited to the European Genome-Phenome Archive
                                                               source availability section.
(EGA, EGAS00001003018). The GCAT cohort protocol,
including sampling and processing, data generation and
health status is described elsewhere (www.genomesforlife.      Variant validation
com) (17,18).
                                                               Comparison with public datasets. SNVs and in-
   Quality control was applied by assessing the quality
                                                               dels from the GCAT dataset were compared with
alignment of the BAM files, the presence of contamina-
                                                               the NCBI dbSNP database (46) (Build version 153)
tion traces, possibly swapped samples, population struc-
                                                               (https://ftp.ncbi.nlm.nih.gov) to determine the number
ture and relatedness (Supplementary information section
                                                               of unique/shared variants between them. GCAT SVs
6.3). Alignment quality was analysed using PICARD (ver-
                                                               were compared with the following public databases:
sion 2.18.11), Biobambam (42) (version 2–2.0.65), and Al-
                                                               (i) The Genome Aggregation Database (gnomAD.v.2)
fred (43) (version 0.1.16). Contamination or swapped ID
                                                               (10)         (https://gnomad.broadinstitute.org/downloads),
samples was determined by VerifyBamID (44) (Supplemen-
                                                               (ii) the Database of Genomic Variants (DGV) (http:
tary Table S9 and Figure S6). Population structure was as-
                                                               //dgv.tcag.ca/dgv/app/downloads?ref=GRCh37/hg19) (47),
sessed using reference ancestry populations. Identity by de-
                                                               (iii) the Human Genome Structural Variation Consortium
scent (IBD) estimates was used to remove up to third-degree
                                                               set (HGSVC) (ftp://ftp.1000genomes.ebi.ac.uk/vol1/ftp/
relatives.
                                                               data collections/hgsv sv discovery/) (13), (iv) the Ira M
   The GCAT sample was characterized by Principal Com-
                                                               Hall dataset (https://github.com/hall-lab/sv paper 042020)
ponent Analysis (PCA). Firstly, we ran the Haplotype
                                                               (48), (v) the 1000G project (Phase3) (ftp://ftp.1000genomes.
Caller tool and only PASS variants from the VCF file were
                                                               ebi.ac.uk/vol1/ftp/phase3/) (11) and (vi) GoNL (release
retained. Then, SNVs with minor allele frequency (MAF)
                                                               6.2) (on request) (12). Finally, we determine the number
>0.01 and independent variants (LD, r2 < 0.2) were selected
                                                               of shared variants between the GCAT and at least one
with PLINK (version 1.90b6.7 64-bit). Finally, on retained
                                                               other public dataset and the number of unique vari-
variants (∼1M) we ran PCs together with reference samples
                                                               ants in the GCAT derived (Supplementary Information
of known ancestry (i.e. 1000G project sample and the Pop-
                                                               section 9.1.2).
ulation Reference Sample (45) (POPRES)). The genetic ho-
                                                                  We also carried out a comparison with the emerging
mogeneity of the GCAT sample was confirmed by PCA in
                                                               long-read sequencing technologies. We analysed with our
the retained cohort samples (Figure 1 and Supplementary
                                                               pipeline 30× short-read sequencing information from a
Figure S7).
                                                               1000G sample (id: NA12878) that had been also indepen-
                                                               dently sequenced and analysed using long-read technolo-
Variant calling, filtering and merging
                                                               gies. We ran our variant calling and filtering strategies in
Each of the 12 selected variant callers was first executed     this sample and matched the results obtained with those re-
independently on all samples (Supplementary information        ported in Audano’s study (15) (long-read sequencing) and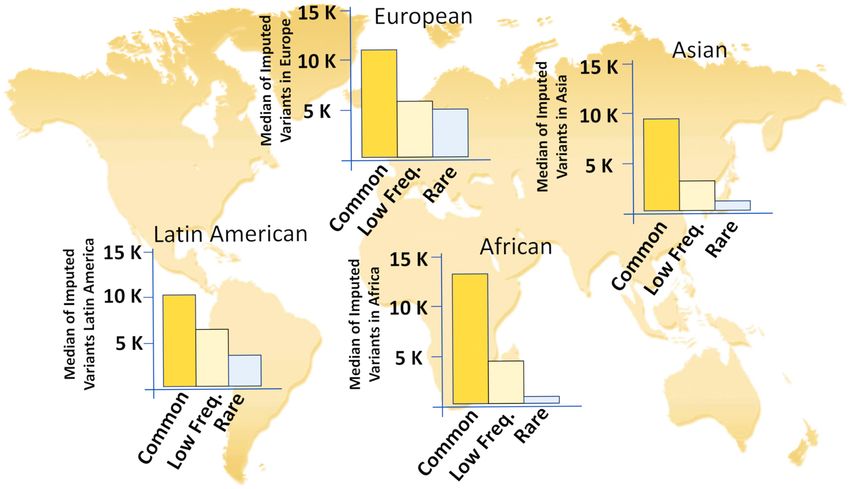
2468 Nucleic Acids Research, 2022, Vol. 50, No. 5

                                                                                                                                                            Downloaded from https://academic.oup.com/nar/article/50/5/2464/6527675 by guest on 03 July 2022
Figure 1. Overview of data and overall strategy. (A) Distribution of genetic data (SNVs) based on principal component analysis (PCA) (adapted from
Novembre et al. (45)). The PC grouped by geographic localization (coloured in grey) the individuals of the GCAT cohort (blue dots) with Iberian samples
from 1000G (asterisk) and POPRES (letters) projects in the context of other European samples. (B) Flowchart of the overall strategy followed in this
study, covering from the quality control of the initial data, to the final generation of the GCAT haplotype panel, with particular focus on SVs. Overall,
the complete strategy consumed ∼3.5 million CPU/hour, which highlights part of the computational challenges associated with this type of analysis
(Supplementary Table S11) (See also Supplementary Figure S7).

1000G Phase 3 (3–7× coverage), obtaining the number of                         resolved genotypes (49). GCAT genotypes were imputed
variants shared between projects.                                              with IMPUTE2 (50) with a genotype posterior probabil-
                                                                               ity ≥0.8 and classified as missing otherwise. Missing geno-
                                                                               types were recovered if they had a perfect tag SNP in the
Experimental validation. The validation of SNV and in-
                                                                               reference panel (r2 = 1).
del calling was performed using the SNP-array data avail-
                                                                                  Comparative genomic hybridization (CGH) method was
able from 570 of the 785 individuals analysed in this study.
                                                                               used to validate deletions and duplications using the
We include QCed genotypes generated in the GCAT cohort
                                                                               NA12878 sample from 1000 Genomes project as reference,
with the Infinium Expanded Multi-Ethnic Genotyping Ar-
                                                                               for which the lists of variants had been previously described
ray (MEGAEx) (ILLUMINA, San Diego, CA, USA) as
                                                                               (51). For each sample, we determined gains and losses and
described elsewhere (18) (i.e. 732 978 SNPs and 1168 in-
                                                                               compared them with those reported from our variant call-
dels). Genotypes from both strategies were compared by (i)
                                                                               ing analysis.
chromosome and position at base-pair resolution and (ii)
REF/ALT alleles; the recall and genotype concordance for
each individual sample was calculated.
                                                                               Phasing and imputation performance
  Inversions were validated using a recent benchmark
dataset, consisting of 59 validated human polymorphic in-                      In order to analyse the performance of the phasing and im-
versions from the InvFEST project (49). Allele frequency                       putation processes, all 785 GCAT samples were divided into
(using CEU and TSI European populations) and length                            two subsets, (i) a subset including 690 samples were first
concordance was determined using an overlapping window                         used to construct a pilot reference panel and (ii) the remain-
of ±1 kb around the inversion breakpoints. Accuracy of                         ing 95 samples, with WGS and SNP-genotyping array data
inversion genotyping was assessed for the 785 WGS sam-                         available, were then used as a test sample in the different
ples, using the available reference panel of experimentally-                   analyses.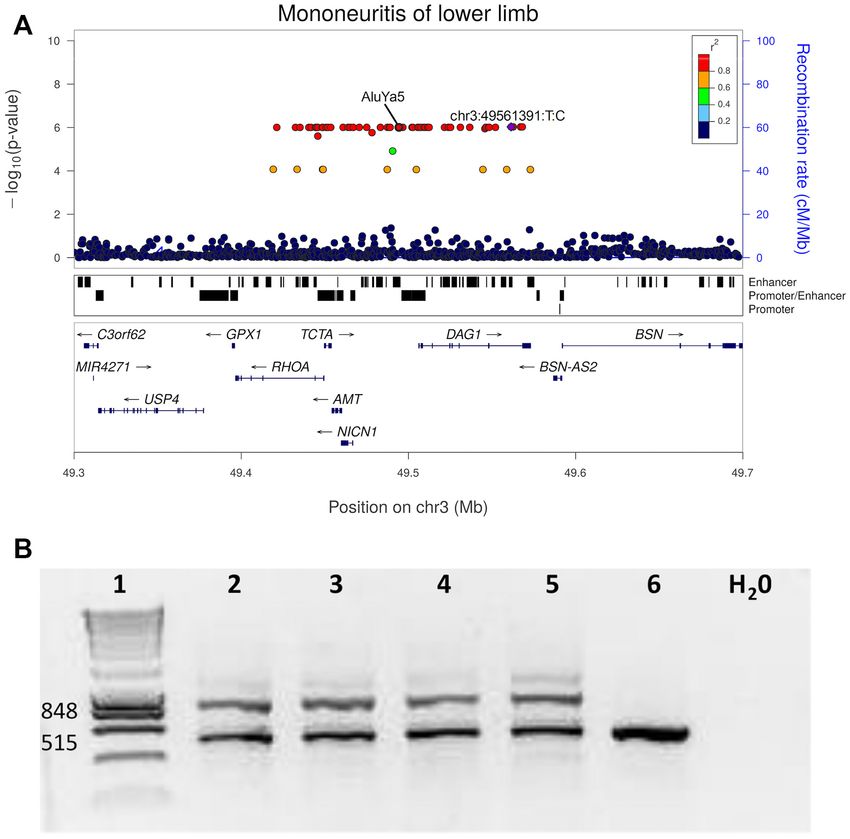
Nucleic Acids Research, 2022, Vol. 50, No. 5 2469

   The evaluation of phasing strategies was carried out by      Functional impact of structural variants
determining the imputation accuracy of SVs, using the
                                                                Variant annotation. Functional, regulatory, and clinical
genotypes independently generated by WGS and imputa-
                                                                annotations of SVs were predicted using AnnotSV (60). The
tion techniques across the 95 test GCAT samples, and with
                                                                functional impact of SVs was evaluated by considering (i)
the pilot reference panel of 690 individuals (Supplemen-
                                                                the level of overlap with known genes, (ii) the level of over-
tary Information section 10.1). Accuracy was determined
                                                                lap with regulatory regions (61), (iii) the predicted loss of
for chromosome 22, and the quality score of imputed vari-
                                                                function intolerance (pLI) effect and (iv) the reported dis-
ants was considered as a validation proxy of the best phas-
                                                                ease association studies. In addition, we used SVFX (62),
ing strategy. Each phasing strategy was evaluated by count-
                                                                a mechanism-agnostic machine learning-based workflow,
ing the number of variants with an info score ≥0.7, and
                                                                to evaluate the potential pathogenicity of large deletions
by calculating the genotype concordance between imputed
                                                                and duplications (>50 bp), in four major cardiometabolic
data and the calling. The phasing algorithms evaluated were
                                                                conditions from the GCAT cohort; diabetes, obesity, car-
ShapeIt2 (52) (version v2.r904), MVNcall (53) (version 1.0),
                                                                diovascular diseases, and hypertension. SVs were classified
ShapeIt4 (54) (version 4.1.3) and WhatsHap (55) (version
                                                                using the annotations of the SVFX tool into pathogenic

                                                                                                                                 Downloaded from https://academic.oup.com/nar/article/50/5/2464/6527675 by guest on 03 July 2022
0.18). We used IMPUTE2 (50) (version 2.3.2) for imputa-
                                                                (SV pathogenic score ≥ 0.9) or benign (SV pathogenic
tion analysis (Supplementary methods).
                                                                score ≤ 0.2). Finally, SNVs and indels (up to 50 bp) were
   In order to evaluate the imputation performance of the
                                                                annotated using SnpEff (63) and SnpSif (64) (v5.0e) tools,
GCAT|Panel for distant ethnicities, we used the 1000G
                                                                covering LoF and pathogenicity descriptors from ClinVar
SNP-genotyping array data covering 2318 samples from 19
                                                                (65) and CADD (66) resources.
populations (56) (Supplementary Table S13). First, quality
control was applied to the 1000G SNP-genotyping array per       Comparison with the GWAS catalog. GWAS catalog ver-
population by removing variants the met the following cri-      sion 1.0.2 (r2021-05-05) was downloaded from https://www.
teria: (i) ≥10% of missingness; (ii) matching A–T, C–G sites;   ebi.ac.uk/gwas/docs/file-downloads. First, we selected 106
(iii) in Hardy–Weinberg disequilibrium (P-value < 0.05);        906 variant-phenotype associations of 72 849 unique au-
and by discarding samples with (i) ≥10% of missing, (ii)        tosomal entries identified in European ancestry. Second,
Kinship coefficient ≥0.05 and (iii) an excess of heterozy-      we intersected with PLINK2.0 (67) 68 323 unique variant-
gosity ±2SD, obtaining finally 1880 individuals covering        phenotype associations (MAF > 0.01) with the GCAT
19 populations. Each population group was pre-phased            dataset (∼30M variants) by breakpoint coordinates. Fi-
with ShapeIt4 and imputed separately using IMPUTE2.             nally, we identified 1374 unique SVs (MAF > 0.01) in strong
Then, we compared the allele frequency, type of variant         linkage disequilibrium (r2 > 0.80) with variant-phenotype
distribution, and the quality of the imputed SVs across         associations in 1Mb window (Supplementary Figure S27).
populations.                                                    From these 1374 SVs, we evaluated the SV type, as well as
   To evaluate the imputation of SVs, we used as refer-         the overlap with genes and regulatory regions.
ence the Audano et al. (15) study that includes SVs identi-
fied using long-read sequencing. Imputed SVs with an info       Genome-wide association analysis. Association analysis
score ≥0.7 were compared considering a window of ±50 bp         was performed by 70 independent GWAS of chronic con-
around the breakpoint. Furthermore, we evaluated the con-       ditions. Phenotype selection was derived from the Elec-
cordance of SV type and SV length error reported by WGS         tronic Health Records registry from the cohort (2012–
calling. On the other hand, we also evaluated the concor-       2017) and chronicity was defined using public guidelines
dance of the genotype of our imputed SVs, using the SV list     for chronic condition definitions (68), and the Chronic
generated on the same samples, by Hickey et al. (57).           Condition Indicator (CCI) (http://www.hcup-us.ahrq.gov/
                                                                toolssoftware/chronic/chronic.jsp) (69,70), then grouped
Benchmarking different panels of genetic variability            considering ICD-9 codes and chapter descriptions. Condi-
                                                                tions with more than 50 cases were retained for the GWAS
QCed genotypes generated in the GCAT cohort with                analysis (i.e. 70). Each association test was performed as
the Infinium Expanded Multi-Ethnic Genotyping Array             independent logistic regression for each cohort, under the
(MEGAEx) (i.e. 756 773 SNVs) were used to impute 4448           assumption of an additive model for allelic effects, with
individuals (e.g. excluding those 785 with WGS) using the       adjustments made for age, sex and the first five principal
GCAT|Panel and the publicly available 1000G phase3 (11),        components. Gender-specific conditions were analysed only
GoNL-SV (12), UK10K (58) and HRC (2) reference pan-             for a specific gender. The analysis was performed using
els. Multiple reference panel imputation was conducted us-      PLINK2.0 (67) for autosomal chromosomes. A Bonferroni
ing GUIDANCE (59). For comparative purposes, we con-            correction accounting for the 10 ICD-9 categories used (i.e.
sidered imputed variants with info imputation score ≥0.7        body systems) was applied. Locus Zoom was derived for
and MAF >0.001. For SNVs and indels, variants were con-         specific regions, and suggestive tower profiles were analysed,
sidered coincident when the position and change matched.        based on LD patterns and gene-centered impact.
For SVs, matching variants were considered if their posi-
tions were within a ±1 kb window, and the variant type          Experimental validation of the Alu element. PCR ampli-
was the same. Since allele frequency impacts imputation,        con analysis was designed using Primer 3.0 software us-
we calculated the average of the info imputation score (r2 )    ing the hg19 dna range = chr3:49 492 813–49 496 062 se-
by frequency categories: rare (MAF < 0.01), low frequency       quence, including the Alu element. Sequence primers are
(0.01 ≤ MAF < 0.05), and common (MAF ≥ 0.05).                   for F-primer (5 CATTGACTCATTCAGCAAGCA 3 ) and
2470 Nucleic Acids Research, 2022, Vol. 50, No. 5
for R-primer (5 AAATTAAGCCCCACCCTAG3 ). Using and Methods), accordingly higher F-scores correlated with
standard conditions (35×, Tm = 60ºC) in a Veriti™ 96-Well larger AUC values (Supplementary Figure S30). This ap-
Thermal Cycler (Thermo Fisher Scientific), we obtain a 515 proach outperformed other typical curation strategies over
bp fragment corresponding to the control-allele and an 848 the entire spectrum of SV sizes (Figure 2C, Supplementary
bp one for the Alu-allele. Fragments were resolved by e- Figure S5). Furthermore, because accurate genotype calling
agarose gel, in a TapeStation (Agilent). Further, the am- is also key for downstream analyses, on top of this LRM, we
plicon of a non-ALU allele carrier was analysed by Sanger prioritized those callers that best resolved the heterozygos-
Sequence Method to verify the insertion point (i.e. at hg19 ity (i.e. genotypes) (see Materials and Methods), resulting in
Chr3:49 494 280) and the ALU sequence insertion (324 bp). a lower rate of genotype error (93% respectively)
origin (45). matched with dbSNP (Build 153.v) (46) entries (Supple-
mentary Figure S9a, b). Regarding SVs, the comparison
against different public databases (i.e. gnomAD-SV (10),
Generation of a comprehensive variant identification strategy
1000G (11), GoNL (12), HGSVC (13), DGV (47), dbVar
We designed, benchmarked, and implemented a compre- (47), Ira M. Hall Lab dataset (48); see Materials and Meth-
hensive strategy for capturing, classifying, and phasing a ods) highlighted 49,333 novel SVs (i.e. 61% of all SVs),
wide range of germline variants from short-read Illumina of which 27% were present in more than two individuals
sequences, with particular efforts devoted to the identifica- (Supplementary Figure S9). As to the type, 26% of these
tion and subclassification of larger structural variants (Fig- novel variants correspond to deletions, 8% to duplications,
ure 1B). Using sequencing data from an in-silico genome 20% to insertions, 20% to inversions, 4% to LINEs, 1% to
(Supplementary information 1, Supplementary Table S2), SVAs, and 21% to Alu elements. The comparison of our
and a real sample (NA12878, from the Genome In A Bottle results with array-based genotypes in a fraction of our co-
(GIAB) project (24)), we assessed the performance (i.e. re- hort (n = 570 individuals) validated 96% and 87% of SNVs
call, precision and F-score metrics) of 17 variant callers cov- and indels, respectively, with a genotype concordance of
ering SNVs, small indels (0.01
on a minimum constraint of having the support from at from the InvFEST project (49) to evaluate this type of
least two callers, which provided high recall (>95%) and variants within our catalogue. Of these 59 inversions, we
precision (>96%) values. On the other hand, for the fil- detected 51 (86%), with concordant size and allele fre-
tering of small indels and SVs, which show high levels of quency values (Supplementary Figure S11a, b; see Materi-
discrepancy across individual callers and their combina- als and Methods). This validates ∼38 000 of ∼40 000 inde-
tions (Figure 2A), we built a Logistic Regression Model pendent inversion calls across the entire cohort, with an av-
(LRM), to prioritize caller results through a reliability score erage genotype concordance of 95% (Supplementary Figure
from the weighted combination of different calling param- S11c). In addition, we have applied CGH, which best targets
eters (Figure 2B, Supplementary Figure S2) (see Materials duplications, as well as large deletions (>20 kb). Using thisNucleic Acids Research, 2022, Vol. 50, No. 5 2471
Downloaded from https://academic.oup.com/nar/article/50/5/2464/6527675 by guest on 03 July 2022
Figure 2. Benchmarking of the structural variant identification and classification pipeline. (A) Structural variant (SV) detection patterns according to the
programs used. Lines and dots indicate the programs used and bars the number of overlapping calls resulting from that combination. The first 30 patterns
with more coincident SV calling are shown. Right coloured horizontal bars indicate the total number of SVs detected by each caller. Variant callers that
detect all SV types and sizes tend to recover more SVs than those that detect specific SV types (i.e. CNVnator) and smaller SVs (i.e. Strelka2). (B) Overview
of the detection performance of different strategies and filtering results from multiple variant callers. Each strategy is plotted according to the recall and
precision ratios (F = F-score) using the benchmarking dataset. The logistic regression model (LRM), with a F-score of 0.9, outperformed other commonly
used strategies that are based on the number of coincident callers (logical rules). The confidence interval for each case is represented by coloured area
of each strategy. (C) Comparison of performances (F-score) of different merging and filtering strategies according to the size of the structural variant.
(D) Comparative overview of the genotype error, associated to each strategy for each allelic state. Error values and their intervals were inferred from the
benchmarking dataset (see supplementary Figures S2, S3 and S5 for the information across the different SV types).
technique, we could validate 76% of our deletions, as well Predicted functional impact of SVs
as 20% of the duplications (Supplementary Table S16). Fi-
A first assessment of the potential functional impact and
nally, we contextualized our results in the frame of other SV
pathogenicity of our SVs was obtained using AnnotSV
identification efforts, through the analysis of the NA12878
(60). 46% of all SVs overlapped with genes, affecting a
sample from the 1000G project that has been sequenced and
median of 2868 per individual, whereas 18% overlapped
analysed using long and short read technologies at differ-
with gene regulatory regions (see Data and Code Avail-
ent coverages. From all SVs identified with long-read tech-
ability at the resource availability section for the corre-
nology (15), our strategy was able to identify 24% of them
sponding gene lists). While the majority (88%) of gene-
when applied to NA12878 at 30× short-read sequence. This
overlapping SVs mapped within intronic regions (Supple-
overlap is different across different SV types, as we detected
mentary Figure S24a), 9% of them affected coding sequenc-
14% of the insertions and duplications, but up to 48 and
ing regions (CDS). In agreement with known variant fixa-
57% of the inversions and deletions, respectively. The same
tion patterns within populations, we observed that rare SVs
comparison using the 1000G annotation of NA12878 at 3–
(MAF < 0.01) tend to be more disruptive, compared to
7× coverage showed a coincidence with long-read results
common variants (MAF ≥ 0.05), as 13% of rare SVs are
of 4, 2 and 0.1% for deletions, inversions, and duplications
overlapping coding regions, compared to 5% of the com-
respectively (Supplementary Table S17), showing a signifi-
mon ones (RR = 0.13/0.054 = 2.4, 95% CI = [2.14,2.69], P-
cant detection improvement when using higher coverages,
value = 2.6 × 10−67 , Supplementary Table S15a, b). Of the
identifying between a 2- and 7-fold the number of variants
affected genes, 28% (10 600 SVs) are related to disease, as
with 30× coverage, compared with 15× and 5× coverages,
indicated by the predicted loss-of-function intolerance pa-
respectively (Supplementary Figure S31).
rameter (pLI) (71) (Supplementary Figures S25a, S26 and2472 Nucleic Acids Research, 2022, Vol. 50, No. 5
Downloaded from https://academic.oup.com/nar/article/50/5/2464/6527675 by guest on 03 July 2022
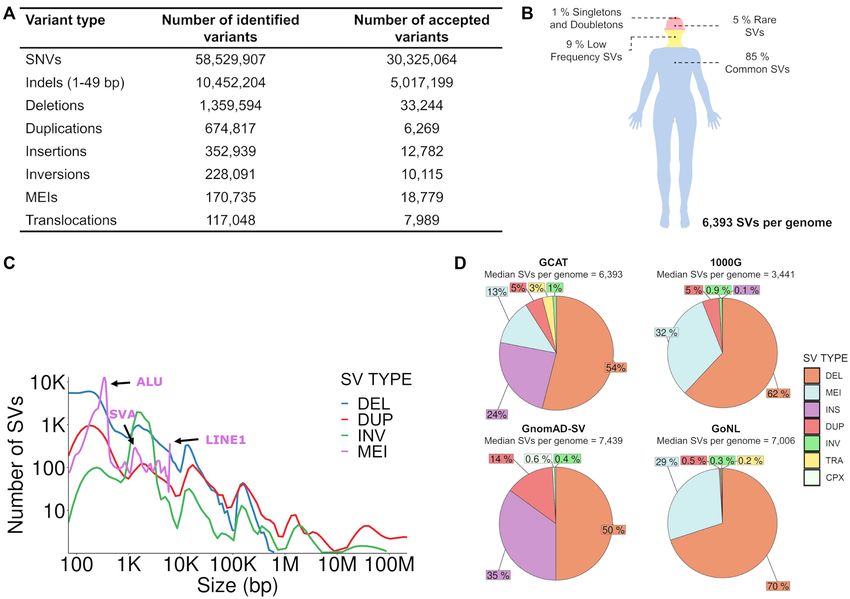
Figure 3. Overview of the GCAT variant catalogue. (A) Table with the numbers of identified and accepted variants after applying the filters ‘at least two
callers detecting the same variant’ for SNVs, the LRM for indels and SVs, Hardy–Weinberg equilibrium, and discard monomorphic variants and those
with >10% missingness within the GCAT cohort, according to their class. (B) Overview of the variant distribution within an average individual in the
GCAT cohort, according to their observed minor allele frequency (MAF). (C) Distribution of SV type according to their genomic sizes. (D) Comparative
overview of the SV type number and distribution across the GCAT, 1000G, GnomAD and GoNL catalogues.
Table S14). Additionally, when we analysed the putative cardiovascular traits, respectively, suggesting that duplica-
causal role of our SVs variants across multiple phenotypes, tions are twice more likely to be involved in these traits.
we observed that 1374 SVs (MAF ≥ 0.01) are in strong link- From the annotation obtained using SnpEff (63) we ex-
age disequilibrium (LD) (r2 ≥ 0.8) with loci associated with tracted 2855 variants that were classified as LoF and ob-
human traits from the GWAS Catalog (version1.0.2 release tained their pathogenicity using ClinVar (65) and CADD
05/05/2021), tagging mainly deletions (Supplementary Fig- (66) data. ClinVar data was available for 243 variants 70 of
ure S27), with more than half of them (799) directly overlap- which were reported as pathogenic or likely pathogenic, and
ping genes or regulatory regions. Finally, we further refined CADD data was available for 2850 variants, 2330 of which
these results with annotations from the SVFX tool (62) for were classified as deleterious (CADD PHRED score > 20).
four major cardiometabolic conditions; obesity, cardiovas-
cular traits, hypertension, and diabetes. Our analysis iden-
tified 106 GWAS catalog (P-value < 10−8 ) hits (i.e. 8% of Iberian Haplotypes estimation
total hits) that overlap with pathogenic annotated variants As a resource for the enrichment of SVs within genome-
in the four analysed traits; 55% variants overlap with obe- wide association studies, we built a haplotype reference
sity and related obesity traits, 20% with diabetes, 16% with panel by phasing together all the variants identified within
cardiovascular-related diseases and 9% with Hypertension all GCAT samples. We first generated a cross-validation
and related traits. Of these, 95% were common and 5% were framework to identify the best available phasing strategy
low-frequency variants. We observed a ratio of pathogenic for SV (see Materials and Methods), using downstream
to benign deletions of 0.95, 1.93, 1.85 and 0.40 for dia- imputation results as the evaluation and ranking criteria
betes, hypertension, obesity, and cardiovascular traits, re- (Supplementary Figures S12 and S13 and Table S12). In
spectively. In the case of duplications, these ratios were 2.06, our hands, the combination of ShapeIt4 (54) and What-
4.42, 4.06 and 0.82 for diabetes, hypertension, obesity, and sHap (55), which include phase informative reads (PIRs),Nucleic Acids Research, 2022, Vol. 50, No. 5 2473
Downloaded from https://academic.oup.com/nar/article/50/5/2464/6527675 by guest on 03 July 2022
Figure 4. Phasing and Imputation performance of the GCAT|Panel. (A) Ternary diagram of the genotype imputation accuracy by variant type and fre-
quency, considering the genotype calling as reference. Three dots evaluate each genotype state per sample. The samples with high concordances between
genotype imputation and genotype calling were located at ternary diagram vertices. (B) Number of SNVs and indels imputed (info score ≥ 0.7) using dif-
ferent reference panels and combining their imputation results. More indels were recovered by GCAT|Panel. (C) Number of SVs imputed (info score ≥ 0.7)
using different panels, and combining the imputation results with and without GCAT|Panel. (See also Supplementary Figure S21).
provided the best results. Using this protocol (Supplemen- with common deletions, insertions, inversions, and mobile
tary Figure S14), the resulting haplotype panel allowed the element insertions (MEIs) was in the range of 39–42, in
imputation (info scores > 0.7) of 98%, 92%, and 90% of contrast to duplications and translocations, which showed
our common SNVs, indels and SVs, respectively, recover- mean values of 12 and 8 variants respectively (Supplemen-
ing a median of 5120 SVs (SD = 50), from a maximum of tary Figure S17a). In fact, as expected, a positive significant
6393 SVs estimated per individual. While the best impu- correlation was observed between the number of variants
tation results came from de novo insertions and deletions, in LD and the score of imputation for common SVs (Pear-
with 96% and 95% recovery rates, respectively, duplications son’s r = 0.38, 95% CI = [0.37, 0.40], P-value < 2 × 10⁻¹⁶ )
and translocations were imputed at lower rates, i.e. 48% and (Supplementary Figure S17b), and for all SV types (except
19%, respectively (Supplementary Figure S15). Overall we translocations) (Supplementary Figure S18).
imputed common SNVs, indels and SVs with a genotyping
concordance of 99% (SD = 0.4), 97% (SD = 0.6) and 98%
(SD = 1.2) (Figure 4A), respectively. The lowest values were Imputation performance of the haplotype panel
observed for duplications and translocations, with genotype Following this strategy, we generated a complete and op-
concordances of 84% (SD = 9.2) and 73% (SD = 27.6), re- erational panel of Iberian haplotypes, with all the variants
spectively (Supplementary Figure S16). of our 785 individuals. To assess the value and benefits of
As the possibilities of accurately imputing SVs are ex- the resulting GCAT|Panel, as an imputation resource for
pected to correlate with the number of neighbouring SNVs enriching genetic association studies with SVs, we first im-
and indels in LD, we next analysed the variation context puted the genotyping array data of 4448 GCAT individuals
of our SVs. Using one megabase window, we observed that and compared the results with those of other reference pan-
the number of SNVs and indels in strong LD (r2 ≥ 0.8) els, such as 1000G (11), GoNL (12), HRC (2), and UK10K2474 Nucleic Acids Research, 2022, Vol. 50, No. 5
Downloaded from https://academic.oup.com/nar/article/50/5/2464/6527675 by guest on 03 July 2022
Figure 5. Genome-wide association analysis using GCAT|Panel and experimental validation of an AluYa5-element. (A) Locus zoom plot of the lo-
cus associated with mononeuritis of lower limb (ICD-9 355) (P-value = 9.84 × 10⁻⁷ ), showing the lead variant in purple. The AluYa5-element
(g.49494276 49494600ins (hs37d5) maps in an enhancer element upstream of the DAG1. (B) Experimental validation of an AluYa5-element, agarose e-gel
electrophoresis of PCR products after amplification of Alu-insertion-specific DNA fragments from blood DNA Lanes: 1, 100 bp DNA ladder marker
(Life Technologies), expected sizes of both states are shown to the left; 2–5 Alu carriers (EGA 04200, EGA 01901, EGA 13378, EGA 03940); six control
individual (EGA 01399). The numbers to the left refer to the size (bp) of marker DNA fragments. Electrophoresis analysis of Alu carriers show two-band
amplicons (515 bp and 848 bp) detected in Alu carriers (lanes 2–5) and one-band amplicon (515 bp) in control non-Alu-allele individuals (lane 6) (See also
Supplementary Figure S29).
(58). With IMPUTE2 (50), the GCAT|Panel was able to In an exploratory analysis, structural variants imputed by
impute a total of 14 383 907 variants with MAF > 0.001 the GCAT|Panel were also tested (together with SNV and
and high quality (info score ≥ 0.7). Across different refer- indels) for association across 70 identified chronic condi-
ence panels, the overall imputation performance for SNVs tions within the cohort. Conservatively, only structural vari-
and indels (0.7 and conditions with >50 cases
slight overperformances of the GCAT|Panel on indels, and were included in this analysis. Forty six SV loci showed sug-
of 1000G and HRC panels on SNVs. While HRC and gestive association with 26 conditions after Bonferroni cor-
1000G recovered rarer SNVs, likely because of their larger rection (P-value ≤ 1 × 10⁻⁶ ) (Supplementary Figure S28).
sample sizes, the GCAT|Panel was able to recover rarer Of all these associations, 63% could potentially be function-
indels (Figure 4B). At the structural variation level, the ally explained through SVs, as they either lead the associa-
GCAT|Panel was able to impute a total of 23, 179 SVs tion (37%) or are in strong LD (r2 ≥ 0.8) with the lead vari-
with info scores ≥0.7, resulting in a 1.6-, 2.7- and 1.3-fold ant (26%). A notable example is a rare AluYa5-element in
increase, compared with the 1000G, the GoNL, and both chr3 (g.49494276 49494600ins (hs37d5), MAF = 0.0013),
panels combined, respectively (Figure 4C). For common located near the dystroglycan gene (DAG1) and associated
SNVs/Indels (MAF > 0.05) the GCAT|Panel showed simi- (P-value = 9.84 × 10⁻⁷ ) with Mononeuritis of lower limb
lar performance as HRC, 1000G, GoNL and UK10K refer- (ICD-9 355) (Figure 5A). The presence of this Alu element,
ence panels (mean r2 > 0.96, Supplementary Figure S21a). imputed only with the GCAT|Panel (info score = 0.98), was
For common SVs, the GCAT|Panel outperformed (mean experimentally confirmed in all carrier individuals (Figure
r2 = 0.91, SD = 0.15) 1000G (mean r2 = 0.80, SD = 0.21) 5B, Supplementary Figure S29).
and GoNL-SV reference panels (mean r2 = 0.82, SD = 0.21, Finally, we evaluated the portability of the GCAT|Panel
Kruskal–Wallis P-value < 2.2 × 10⁻¹⁶ , Supplementary Fig- to infer SVs across 19 different ethnic groups using 1880
ure S21b). individuals from the 1000G project. While the imputationNucleic Acids Research, 2022, Vol. 50, No. 5 2475
Downloaded from https://academic.oup.com/nar/article/50/5/2464/6527675 by guest on 03 July 2022
Figure 6. Structural Variant imputation performance using GCAT|Panel across all continents. European and Latin American populations recover more
low frequency and rare SVs at high info scores (≥0.7) than African and Asian populations (see also Supplementary Figures S22 and S23).
quality of SVs was higher within the European populations nology, we also expect a slight detection bias against low
(Supplementary Figure S22), the GCAT|Panel was also able complexity (repeated) regions of the genome, where short-
to impute a large fraction of SVs across all other ethnici- read sequencing tends to be less informative, in contrast
ties (Figure 6, Supplementary Figure S23a). Of nearly 50K to long-read sequencing technology (13–16). This is further
unique SVs imputed across all groups, 25%, 35% and 40% highlighted by the high portion (54%) of our SVs affecting
of them were detected within the Asian, African and Latin genes or regulatory regions, which also tend to be within the
American populations, respectively (Figure 6, Supplemen- non-repetitive portion of the genome.
tary Figure S23). In agreement with the mixed origin of Given the increasing incorporation of whole-genome se-
Latin Americans, nearly half of all imputed variants within quencing into genetic studies, it is crucial to highlight the
this group showed low-frequency values (MAF < 0.05), importance of accurately identifying and resolving SVs with
compared with other non-European groups, where the im- the correct genotype, to then obtain robust and meaningful
putation covered predominantly common variants (Figure results during the imputation in a different cohort. Here, we
6). In addition, 73% of all the structural variants identi- found a positive correlation between the number of neigh-
fied and genotyped in previous studies, using long and short bouring variants in LD with SVs and their quality of im-
WGS (15,57) were also imputed by our panel on the same putation, suggesting that variants with a high genotyping
individuals, with 88% of matching genotypes (Supplemen- error show a lower number of variants in LD, which trans-
tary Figures S19b and S20a). lates into a lower imputation accuracy for those variants
(Supplementary Figure S17). On the other hand, software
limitations (PLINK or ShapeIt4), can translate into poor
DISCUSSION
estimations of haplotypes and LD, directly hampering the
Here, we present the GCAT|Panel, the first Iberian Hap- association test, which relies on accurate counts of vari-
lotype reference panel derived from high-coverage whole- ant allele frequencies and states. Improved variant calling
genome sequencing. The strategy developed for variant strategies that can accurately identify and define complex
identification, classification, and phasing, has provided a structural variation events are still needed, together with
comprehensive and high-quality catalogue of genetic vari- new and dedicated analysis frames (e.g. phasing and LD) for
ants, with low rates of false-positive calls and genotyping SVs, where the actual size and type of the variant is consid-
errors for all variant types, including SVs. This is due to the ered, in contrast to the current scenario where SVs are taken
combination of high sequencing coverage (30×) with a com- as SNVs.
prehensive analysis strategy that integrates multiple variant In our cohort, the GCAT|Panel led to the identifica-
callers and a Logistic Regression Model for maximzing re- tion of potential risk SV, including those within the rare
call and precision for each SV type and size. spectrum. Here, we highlight the identification of a rare
Increasing the sequencing coverage to 30× allowed us to polymorphic 324 bp-long AluYa5 element in chromosome
resolve a large fraction of SVs and accurately define the 3 (g.49494276 49494600, MAF = 0.0013) associated with
genotypes that cannot be properly defined with lower se- Mononeuritis of the lower limb (ICD-9 355). This SV is
quencing depths. In addition, while previous projects in- located within a multi enhancer-elite element (GeneCards)
ferred SVs into phased haplotype scaffolds (11,12), our se- (73), proximal to DAG1, a gene involved in pathways re-
quencing coverage allows us, for the first time, to phase SVs sponsible for neuromuscular diseases, and already causing
together with biallelic SNVs and indels, and to use phase in- severe limb-girdle muscular dystrophy type 2P (LGMD2P)
formative reads (PIRs), which are expected to improve the through missense point mutations (74). Further studies are
imputation of rare variants (72). With this sequencing tech- now needed to validate the resulting hypothesis, in which2476 Nucleic Acids Research, 2022, Vol. 50, No. 5
this Alu element could be affecting the expression of the specially Ignasi Morán and Lorena Alonso, for their help-
DAG1 gene in this disease. ful discussions and valuable comments on the manuscript;
This study also provides detailed guidance for the com- and the technical support group from the Barcelona Super-
prehensive analysis of whole-genome sequences, including computing Center Center. We acknowledge Red Española
the identification, classification, and phasing of SVs. We ex- de Supercomputación (RES) for awarding us access to
pect that this type of analysis will soon become the stan- MareNostrum4 supercomputer from Barcelona Supercom-
dard within large genetic studies that are already incor- puting Center (proposal numbers BCV-2018-3-0010 and
porating whole-genome Illumina sequences and combining BCV-2019-1-0015). Figure 1a has been Adapted/Translated
them with existing genotyping array information. by permission from Springer Nature: Nature Genes mirror
Taken together, the availability of a high-quality haplo- geography within Europe, John Novembre et al., August 31,
type panel, including a comprehensive fraction of struc- 2008.
tural variability, will significantly impact evolutionary and Author contributions: J.V.M., I.G.F., D.M.S., D.T. and
biomedical studies at different levels. The possibility of R.dC. designed and planned the whole study. J.V.M., I.G.F.,
enriching current genome-wide association studies (e.g. D.M.S., D.T. and R.dC. contributed to the writing and
Downloaded from https://academic.oup.com/nar/article/50/5/2464/6527675 by guest on 03 July 2022
GWAS and eQTL) with SVs through imputation, directly editing of the manuscript. A.C. prepared and QCed sam-
increases the chances of variant discovery, as well as of their ples for NGS. J.V.M. created the in-silico and D.M.S. pre-
functional interpretations. Our analysis evidence the poten- pared the NA12878 sample. J.V.M., I.G.F. and D.M.S. per-
tial of using population-matched reference panels, for the formed the variant calling and designed the Logistic Regres-
identification of rare structural variants involved in disease, sion Models. J.V.M., I.G.F., D.M.S. contributed to the cre-
and the important contribution to the understanding of the ation of BAM files, quality control, variant merging, filter-
underlying genomic architecture of genetic diseases. ing and genotyping, with the collaboration of M.P. J.V.M.,
I.G.F. and D.M.S. performed a comprehensive compara-
tive analysis of the Iberian catalogue with other reposito-
RESOURCE AVAILABILITY
ries. J.V.M., I.G.F. and D.M.S. conducted the SNV, indel
Below we attach the information of the data and code avail- and large deletion and duplication validations, collaborat-
ability used in this study. ing with L.A. on behalf of qGenomics conducting CGH
validation analysis. The inversion validation and genotype
data analysis was provided by J.L.J., M.Pu and M.C. J.V.M.,
DATA AVAILABILITY
I.G.F. and D.M.S. performed the SV annotation, the cre-
The data generated in this study, including the FASTQ, ation of the GCAT|Panel, and their benchmarking, in col-
BAM and VCF files of the 808 individuals with their geno- laboration with C.S. R.A. executed and adapted GUID-
typing information, as well as the entire GCAT|Panel, are ANCE with ShapeIt4 and GCAT|Panel. I.G.F., N.B., X.F.,
accessible upon request (rdecid@igtp.cat) from the Euro- B.C. conducted and analysed the Phenome analysis, from
pean Genome-phenome Archive (EGA), under the acces- phenotype extraction to GWAS analysis. N.B., R.dC., X.F.
sion number EGAS00001003018. All the GCAT catalogue and L.A. conducted the AluY5a validation. L.S., J.F.S.H.
variants, the SV (Figure 3A), SNVs and indels annotations conducted SNP-Array validation analysis of SV. V.M. and
files, and the in-silico information (i.e. FASTQ, BAM files, M.Pe contributed to the editing of the manuscript. D.T.
catalogue of variants inserted) are available at http://cg.bsc. and R.dC. supervised the study. All authors reviewed and
es/GCAT BSC iberianpanel. approved the manuscript. J.V.M., I.G.F. and D.M.S. con-
All original code has been deposited at (https://github. tributed equally to this study.
com/gcatbiobank/GCAT panel) and is publicly available as
of the date of publication. DOIs are listed in the key re-
FUNDING
sources table.
GCAT|Genomes for Life, a cohort study of the Genomes
of Catalonia, Fundació Institut Germans Trias i Pujol
SUPPLEMENTARY DATA
(IGTP); IGTP is part of the CERCA Program/Generalitat
Supplementary Data are available at NAR Online. de Catalunya; GCAT is supported by Acción de Di-
namización del ISCIII-MINECO; Ministry of Health of
the Generalitat of Catalunya [ADE 10/00026]; Agència
ACKNOWLEDGEMENTS
de Gestió d’Ajuts Universitaris i de Recerca (AGAUR)
We thank Dr Lluı́s Puig and Vanessa Plegezuelos on behalf [2017-SGR 529]; B.C. is supported by national grants
of Blood and Tissue Bank from Catalonia (BST), who col- [PI18/01512]; X.F. is supported by VEIS project [001-P-
laborated in GCAT recruitment, and all the GCAT volun- 001647] (co-funded by European Regional Development
teers that participated in the study. We also thank the Cen- Fund (ERDF), ‘A way to build Europe’); a full list of
tro Nacional de Análisis Genómico (CNAG-CRG), who the investigators who contributed to the generation of the
collaborated in the sequence analysis of the study; members GCAT data is available from www.genomesforlife.com/;
of the Comparative and Functional Genomics Group at the Severo Ochoa Program, awarded by the Spanish Govern-
UAB for helping with the inversion validation; Dr. Francesc ment [SEV-2011-00067 and SEV2015-0493]; Spanish Min-
Calafell for his comments on the manuscript; Marta Morell istry of Science [TIN2015-65316-P]; Innovation and by the
from qGenomics for the technical assistance in the Alu val- Generalitat de Catalunya [2014-SGR-1051 to D.T.]; Agen-
idation; the Computational Genomics Group at the BSC, cia Estatal de Investigación (AEI, Spain) [BFU2016-77244-You can also read